

Книги по МРТ КТ на английском языке / MR Imaging in White Matter Diseases of the Brain and Spinal Cord - K Sartor Massimo Filippi Nicola De Stefano Vincent Dou
.pdfConventional MRI Techniques in Multiple Sclerosis |
211 |
14 Conventional MRI Techniques in Multiple Sclerosis
Anthony Traboulsee, David K.B. Li, Guojun Zhao, and Donald W. Paty
CONTENTS
14.1Introduction 211
14.2Technical Considerations 211
14.3 |
Pathophysiology of MS 212 |
14.3.1 |
Lesion Morphology and Distribution 212 |
14.3.2Lesion Development 214
14.3.3Gadolinium-Enhancing Lesions 214
14.3.4 |
T2W Active Lesions 215 |
14.3.5 |
Lesion Reactivation and Accumulation 215 |
14.3.6“Black Holes” 215
14.3.7Atrophy 216
14.4Diagnosis 217
14.5Clinical Correlations 219
14.5.1Relapses 219
14.5.2Disability 219
14.5.3Prognosis 220
14.6Monitoring Treatment 220
14.7Summary 221 References 221
covery (FLAIR) sequences for lesion identification, and gadolinium-enhanced T1-weighted imaging for identifying new lesion activity.
Despite the limitations of signal quality with the earliest MRI images (Young et al.1981) of MS patients it was quickly recognized that MRI provided a valuable tool for identifying lesions within the brain that were similar in shape and location to plaques seen pathologically. Since then, MRI, both conventional and non-conventional techniques, has transformed all aspects of MS research and clinical practice.
14.2
Technical Considerations
14.1 Introduction
The conventional MRI techniques used in MS in general are the sequences that are routinely used on a standard clinical MRI scanner. These typically include proton density (PD) and T2-weighted (T2W) spin-echo (SE) and fluid-attenuated inversion re-
A. Traboulsee, MD, FRCPC
Instructor, Division of Neurology, Department of Medicine, The University of British Columbia, S195-2211 Wesbrook Mall, Vancouver, British Columbia, Canada, V6T 2B5
D.K.B. Li, MD, FRCPC
Professor, Department of Radiology, The University of British Columbia, Main Floor, 2211 Wesbrook Mall,Vancouver, British Columbia, Canada, V6T 2B5
G. Zhao, MD
Research Associate, Division of Neurology, Department of Medicine, The University of British Columbia, Gerald McGavin Building, 2386 East Mall,Vancouver, British Columbia, Canada, V6T 1Z4
D.W. Paty, MD, FRCPC
Professor, Emeritus, Division of Neurology, Department of Medicine, The University of British Columbia, S195-2211 Wesbrook Mall, Vancouver, British Columbia, Canada, V6T 2B5
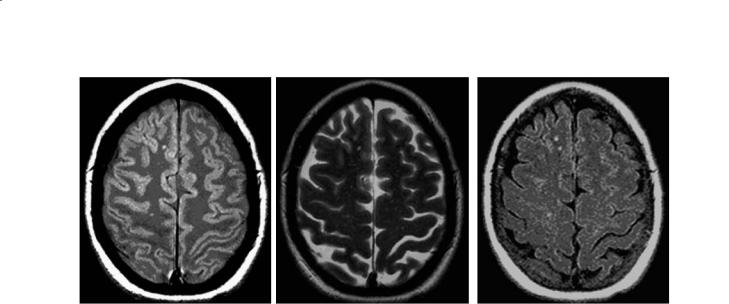
PD and T2W images are acquired simultaneously (double echo) with conventional SE techniques. Repetition times (TR) are long (2500–3000 ms), and lesion intensity increases with the longer echo time (TE) of the T2W (TE 80–120 ms) compared to PD (TE 15–40 ms) sequences (Fig. 14.1). Posterior fossa lesions are best seen on T2W images and periventricular lesions best seen with PD images. Faster acquisition sequences (fast or turbo spin echo) which allow additional signal averaging provide the ability to obtain thinner slices. This compensates for the occasional risk of missing smaller lesions due to the edge blurring associated with the shorter effective TE.Fast FLAIR is popular for periventricular and juxtacortical lesion identification because of the excellent suppression of cerebrospinal fluid (CSF) partial volume effects (Rydberg et al. 1995). However, it may be less sensitive for some brainstem and spinal cord lesions (Filippi et al. 1996a; Gawne-Cain et al. 1997). Commonly used protocols range from 5 mm thick slices with 2.5 mm gaps to 3 mm contiguous slices. There is better reproducibility and slightly higher lesion volume detection using 3 mm rather than 5 mm slice thickness (Filippi et al. 1997; Rovaris et al. 1998). The Consortium of MS Centers’ MRI Working Group recommends contiguous 3 mm slice thickness with no gap for clinical MRI protocols.
212 |
A. Traboulsee et al. |
a |
b |
c |
Fig. 14.1a–c. PD (a), T2W (b) and FLAIR (c) axial brain images with small MS lesions
14.3
Pathophysiology of MS
14.3.1
Lesion Morphology and Distribution
Post-mortem studies have validated that the T2 lesions seen on MRI correlate with the typical plaques of MS seen on gross pathology (Stewart et al. 1986). The classic MRI appearance is typically multiple white matter lesions with periventricular predominance (Fig. 14.2). MS plaques appear as bright T2 lesions because of the longer T2 relaxation times. However, the T2 lesions are not specific for plaque age, degree of myelin loss, amount of inflammation and edema, or the degree of axonal loss (Barnes et al. 1991). Most lesions have an expanded extracellular space, and it is possible that T2W lesions overestimate the extent of the pathology due to the edema, particularly with new inflammation (Newcombe et al. 1991). Lipids have a relatively short T2 relaxation time, making them effectively invisible on conventional MRI. Therefore, the lipid loss due to myelin sheath breakdown in demyelination probably does not directly contribute to the change seen on MRI. However, the loss of myelin lipid does create a more hydrophilic environment and the increased water content will lead to proton density increase and prolonged T1 and T2 relaxation times (increased intensity lesions on PD/T2W and decreased intensity lesions on T1W sequences). Thus, other pathologies, such as infarcts, infection, tumors and inflammation can produce similar MRI signal changes.
The most common location for MS lesions on MRI is periventricular and it would be unusual to have sparing of this region in MS. Lesions can occur in any CNS tissue where there is myelin, including the cortex. However, most of these lesions are missed with conventional MRI due to similarities in signal intensities of MS lesions and gray matter, and the partial volume effects of CSF within the adjacent sulci (Kidd et al. 1999). FLAIR sequences currently are preferred for the detection of cortical lesions (Boggild et al. 1996). Dawson fingers refer to the oval, elongated lesions in the corona radiata and the centrum semiovale.These lesions are oriented along subependymal veins that are perpendicular to the walls of the ventricles, representing perivenular inflammation that is a unique pathological feature of MS (Horowitz et al. 1989). These are best seen on sagittal PD/T2W or FLAIR images. The sagittal image is also useful for demonstrating lesions within the corpus callosum. Lesions are also often seen in the temporal lobes, at the gray-white matter junction (juxtacortical), brainstem and cerebellum. A fat-suppression technique improves the sensitivity to detect lesions within the optic nerves (Tien et al. 1991). Optic nerve involvement was detected on MRI in 76% of 25 patients investigated, only 4 of whom had a history of optic neuritis (Davies et al. 1998).
Spinal cord lesions are most common in the cervical cord (Fig. 14.3) (Bot et al. 2002) and they tend to involve the posterior and lateral regions and occupy less than half the area of the cord on axial images (Thielen and Miller 1996). These lesions rarely extend beyond two vertebral segments (Tartaglino et al. 1995). Spinal cord lesions can be found in 50–90%
Conventional MRI Techniques in Multiple Sclerosis |
213 |
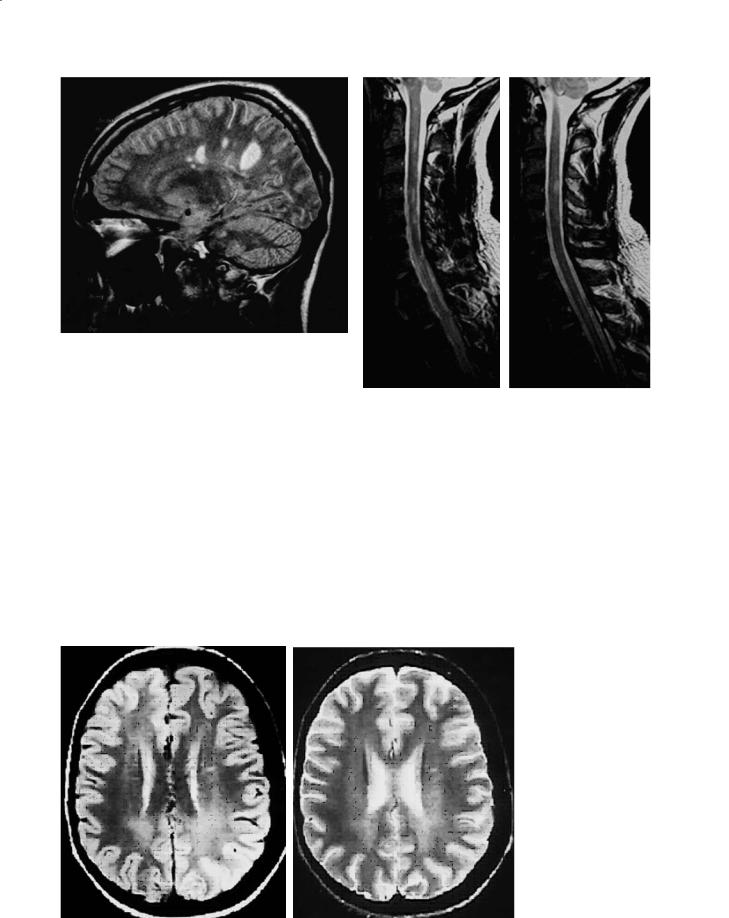
Fig. 14.2. Sagittal FLAIR brain image showing typical MS T2 lesions
a |
b |
of MS patients, and in one study of 68 patients, 38 had multiple lesions (56%) (Tartaglino et al. 1995).
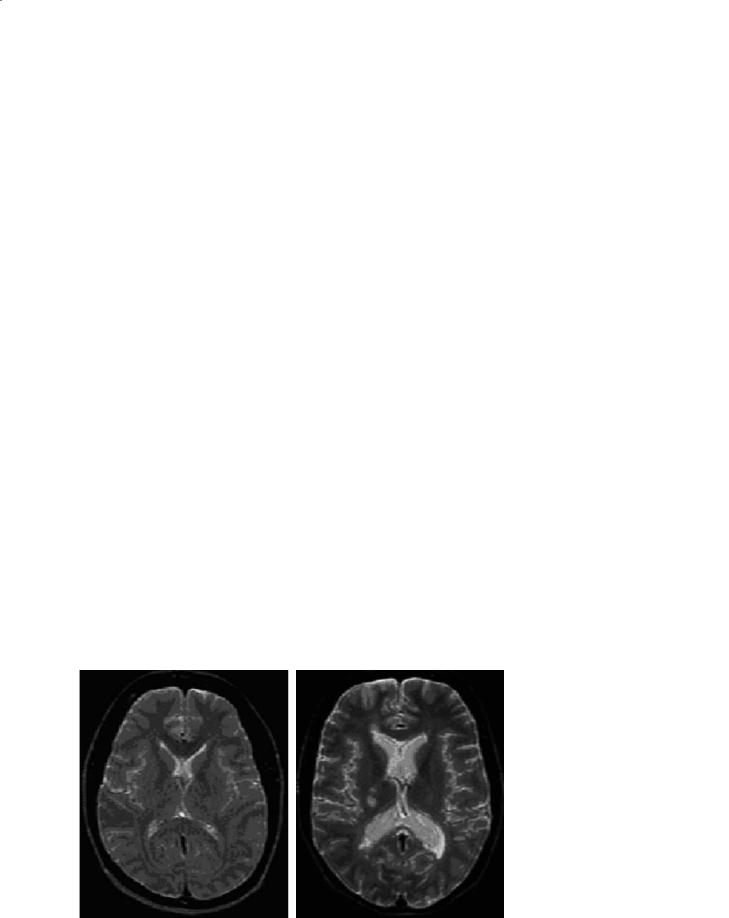
Not all lesions are discrete on MRI. There are diffuse changes throughout the normal-appearing brain tissues pathologically that can be investigated with non-conventional MRI techniques such as magnetization transfer imaging (Ostuni et al. 1999), diffu- sion-weighted imaging (Ciccarelli et al. 2001), MR spectroscopy (De Stefano et al. 2002), and myelin water imaging (Whittall et al. 2002). However, there can also be large, diffuse lesions visible on conventional MRI with poorly defined boundaries (Fig. 14.4). These areas of dirty-appearing white matter (DWM)
Fig. 14.3a,b. Consecutive sagittal T2W images of MS lesions in the cervical spinal cord
are most common around the ventricles, especially adjacent to the occipital horn. DWM can extend over several contiguous slices and was present in 17% of relapsing-remitting MS (RRMS) patients in one study (Zhao et al. 2000). The degree of tissue abnormalities as determined with magnetization transfer imaging within DWM appears to be intermediate between normal-appearing brain tissue and lesions (Ge et al. 2003).
|
|
Fig. 14.4a,b. Dirty white |
|
|
|
matter (a PD image; b |
|
|
|
T2W image) refers to |
|
|
|
large diffuse areas of in- |
|
|
|
creased T2 hyperintensity. |
|
|
|
Unlike typical T2 lesions, |
|
|
|
DWM has poorly defined |
|
|
|
borders, and often extends |
|
|
|
through several slices. It is |
|
a |
b |
seen in fewer than 20% of |
|
RRMS patients |
|||
|
|
214 |
A. Traboulsee et al. |
14.3.2
Lesion Development
Serial MRI studies have provided unique insights into the pathogenesis of new MS lesion formation (Harris et al. 1991; Isaac et al. 1988; McFarland et al. 1992; Willoughby et al. 1989). MRI is ideally suited for evaluating the cycle of dynamic changes in vivo, by providing full coverage of the CNS in a reasonable time frame, and without the safety concerns of ra- diation-based neuroimaging techniques. Perhaps the greatest impact of several MRI natural history studies is a better understanding of the degree of clinically silent MRI lesion activity that frequently occurs even during periods of clinical stability or remission.
14.3.3
Gadolinium-Enhancing Lesions
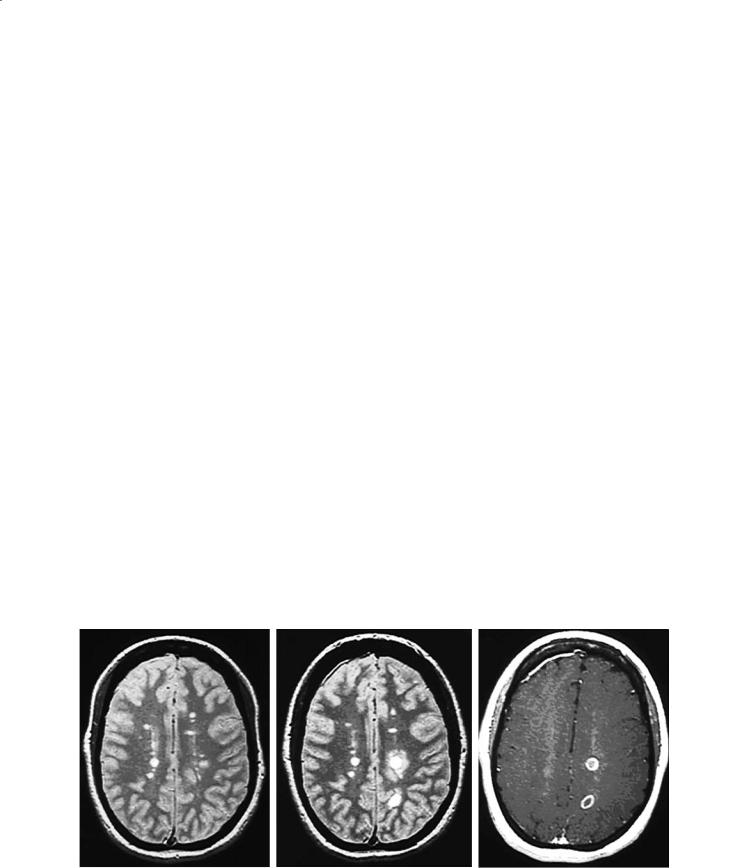
New disease activity (inflammation) can be detected by conventional MRI as gadolinium enhancement on the postcontrast T1W image, and as new and enlarging T2W lesions on serial studies (see below). Gadolinium enhancement (Fig. 14.5) can precede new T2W lesions by hours or days (Miller et al. 1988) and represents breakdown of the blood–brain barrier as proinflammatory T cells infiltrate into the brain parenchyma (Nesbit et al. 1991). The enhancement is more often solid and homogeneous with fresh lesions, particularly when they are small and may appear ring-like with lesions that are larger and several weeks old. Enhancement usually lasts 4 weeks
with a gradual decline during the next 2 to 4 weeks (Kermode et al. 1990). It is extremely unusual for a MS lesion to have gadolinium enhancement beyond 3 months. This could help in distinguishing MS lesions from CNS tumors of the brain or spinal cord that can sometimes mimic early MS clinically. Gadolinium enhancement is sensitive to steroids and other antiinflammatory treatments. The majority of new T2W lesions will enhance with gadolinium. Preexisting T2W lesions can also enhance, indicating new activity, and in general newly enhancing lesions are seen twice as often as new T2 activity (new or enlarging T2W lesions). Higher (“double or triple”) doses of gadolinium, longer delays between injecting the gadolinium and acquiring the postcontrast T1W images, thinner slices and incorporating a magnetization transfer sequence have been shown to increase the number of enhancing MS lesions as well as the intensity of some lesions (Filippi et al. 1996b; Silver et al. 1997). For clinical MRI scans, the Consortium of MS Centers MRI Working Group recommends a standard dose of gadolinium of 0.1 mmol/kg with a minimum delay of 5 min.
Although the heaviest plaque burden in MS is usually found in the periventricular regions, we have observed that only 20% of enhancing lesions are immediately periventricular in distribution, 80% being nonperiventricular, 56% in the deep white matter and 24% at the gray–white matter junction. This difference in distribution between acute and chronic lesions raises questions about the genesis and ultimate fate of these new and dynamic lesions seen on MRI (Lee et al. 1999).
a |
b |
c |
Fig. 14.5. a Baseline axial brain PDW image with multiple T2 lesions. b The registered image 1 month latter demonstrating several new T2 lesions that developed in the absence of any new clinical symptoms. c Corresponding axial postcontrast T1W image showing gadolinium enhancement of the new lesions
Conventional MRI Techniques in Multiple Sclerosis |
215 |
14.3.4
T2W Active Lesions
New T2W lesions represent new inflammation (Fig. 14.5). They increase in size during the acute phase mostly due to edema associated with inflammatory infiltrates, reaching their maximum size within 4 weeks (Willoughby et al.1989).The process is selflimiting, and the lesions slowly decrease in size over the next 6 to 8 weeks as edema resolves and remyelination occurs. However, most lesions leave a smaller residual T2W lesion (Koopmans et al. 1989c).
14.3.5
Lesion Reactivation and Accumulation
On average, MS patients will develop four or five new MRI lesions per year with great variability amongst individuals (Paty 1988). Preexisting T2W lesions can reactivate with re-enhancement only, enlargement on T2W imaging, or both. The pathology within the chronic lesion is probably maturing to include gliosis and axonal loss in addition to demyelination. Eventually, after many reactivations, lesions will fuse with adjacent lesions. Thus, what may have started out as several small lesions may end up forming one large confluent lesion (Koopmans et al. 1989b).
Annually there is net accumulation of new and enlarging lesions that increases the total T2 volume or burden of disease (T2 BOD) of 5 to 10% per year (Paty et al. 1994). However, the variability between
individuals is enormous, and this is not normally distributed. Thus, median values are the preferred descriptors when these are used as outcome measures in clinical trials. Monthly the T2 BOD can fluctuate due to the changes in disease activity especially if the baseline BOD is rather small (Stone et al. 1995). It is valuable if not essential to see an increase in T2 BOD in placebo groups for internal validation of any quantification methodology.
14.3.6 “Black Holes”
On the accompanying unenhanced T1W image, some T2 lesions may be isointense to surrounding white matter and therefore undetectable. However, some lesions will appear hypointense on the T1W (socalled T1 hypointensity or “black hole”; Fig. 14.6). A proportion of these black holes are acute lesions that enhance when gadolinium is given and almost half of these will resolve slowly over months (Bagnato et al. 2003). Those that do not enhance represent (1) subacute or resolving lesions, and (2) chronic or stable lesions. We recommend that chronic black holes be defined as T2 lesions which are nonenhancing and hypointense T1W lesions, that persist for a minimum of 6 months after their first appearance, and have a signal intensity on T1W images less than or equal to that of gray matter. The chronic T1W hypointense black holes are associated with greater tissue destruction and axonal loss (van Walderveen et al. 1999) compared to chronic, stable T2 lesions without a cor-
a |
b |
c |
Fig. 14.6a–c. Chronic T1W hypointense lesions (black holes) are a subset of T2 lesions that do not enhance with gadolinium and have been present for at least 6 months. They are associated with greater tissue destruction and axonal loss than those T2 lesions that are isointense on T1W imaging. However, acute black holes can be commonly identified with new lesions, and many will resolve within 6–12 months
216 |
A. Traboulsee et al. |
responding black hole. Furthermore, these lesions may have a better correlation with clinical disability because of their greater pathological specificity for severe axonal loss (Truyen et al. 1996) and have been suggested as a potential outcome measure in clinical trials for the degenerative processes of MS (Filippi et al. 2000).
14.3.7 Atrophy
Brain and spinal cord atrophy has been recognized in autopsy material from MS patients prior to the current widely available neuroimaging techniques. It is likely that axonal loss accounts for the irreversible and progressive clinical disability that occurs in MS (McDonald and Ron 1999) and atrophy is the result of axonal loss, in addition to myelin loss, and shrinkage due to gliosis. Thus, global brain atrophy is another important measure of the neurodegenerative component of MS (Miller et al. 2002).
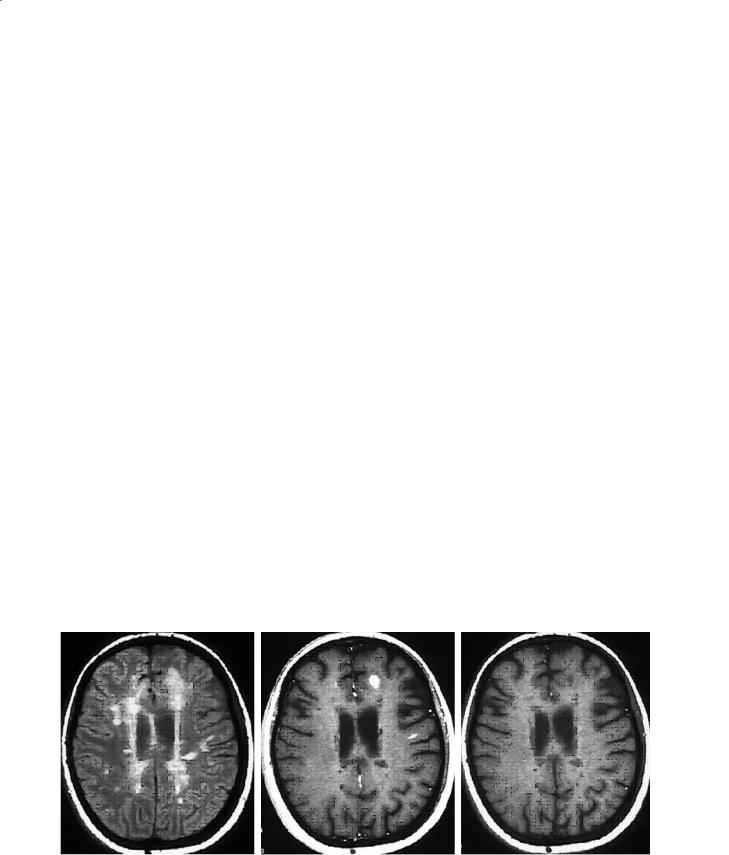
An early CT study of 100 MS patients in 1978 demonstrated atrophy as a feature of MS brains and also demonstrated that it was progressive in a small subset of patients followed for up to 21 months (Cala et al. 1978). MRI studies have also shown that atrophy is common (Fig. 14.7), ranging from 47% to 100% of MS patients, depending on the population and technique (Filippi et al. 1998; Liu et al. 1999). It is more severe in patients with secondary progressive MS (SPMS) than RRMS (van Walderveen et al. 1998). It can be detected after a single attack of demyelination (clinically isolated syndrome, CIS) before the diagnosis of MS is made, and in the presence of only a small T2 lesion burden (Brex et al. 2000). Brain
volume measurements are reliable and reproducible, with the majority of current techniques using MRI rather than CT data. Different methods have been used including: ventricular size (including linear measurements), corpus callosum area, measuring selected brain slices, segmentation of the entire brain to calculate a normalized brain parenchyma fraction or volume (BPF/BPV), and spinal cord cross-sectional area. Each method has unique strengths and limitations depending on the quality of the MRI data available, and the population being studied (Miller et al. 2002).
Atrophy is progressive during the course of MS. Patients with RRMS tend to lose 17.3 ml/year of BPV compared to 23.6 ml/year for SPMS (Ge et al. 2000). Ventricles increase in size by 1.6 ml/year in MS compared to 0.3 ml/year for control subjects,while the annual rate of cerebral atrophy in the same study was of 0.8% and 0.3%, respectively (Fox et al. 2000). Several other studies have shown similar annual rates of brain volume decrease in MS, ranging from 0.6% to 0.8% (Comi et al. 2001a; Rovaris et al. 2001; Rudick et al. 1999). Brain volume changes, however, are complex and may also be affected by inflammation, edema, and hydration. Furthermore, the use of high-dose intravenous steroids for an acute clinical relapse can temporarily decrease brain volumes (Hoogervorst et al. 2002), and it is possible that some of the dis- ease-modifying therapies used in the treatment of MS could have a similar effect.There have been mixed reports of the relationships between the T2 BOD, T1 black hole BOD, gadolinium activity and the degree of brain atrophy (Losseff et al. 1996a; Paolillo et al. 2000; Zivadinov and Zorzon 2002). This suggests that any relationship between these measures is partial at best. Furthermore, this may indicate that the
|
|
Fig. 14.7a,b. Compared to age- |
|
|
|
matched controls (a),MS patients |
|
|
|
(b) tend to have less brain paren- |
|
|
|
chyma volume, increased size of |
|
a |
b |
the ventricles, and increased CSF |
|
spaces (i.e. atrophy) |
|||
|
|

Conventional MRI Techniques in Multiple Sclerosis |
217 |
pathological mechanisms underlying lesion formation are somewhat independent of the mechanisms leading to progressive tissue loss and atrophy.
14.4 Diagnosis
MS is a chronic disease, and most, if not all, MS patients will have T2 lesions on their brain and/or spinal cord images at some point in their disease course. The majority of MS patients have attacks of neurological dysfunction and a minority will have a slow progressive early course (Lublin and Reingold 1996). The clinical diagnosis requires two attacks or relapses consistent with demyelination of the central nervous system, and confirmed by a physician with adequate knowledge of the disease (McDonald et al. 2001; Poser et al. 1984). However, the interval between attacks is often years and this leads to a period of uncertainty for many patients who have suffered a single attack of demyelination (CIS). Although this group of patients are at risk for developing MS (recurrent attacks of demyelination), they are not necessarily destined to do so. The brain MRI findings at the time of a single clinical attack (CIS) are perhaps the best predictor of developing clinical MS (Brex et al. 2002; Cole et al. 2000).
The Optic Neuritis Treatment trial was one the earliest studies to systematically follow patients from multiple centers after a single event of demyelination. Approximately 50% of patients had a baseline brain MRI that had one or more T2 lesions. An abnormal MRI was the best predictor of converting to clinically definite MS (CDMS) at 10 years, with 56% of that group developed CDMS, whereas only 22% of those patients with a normal brain MRI at baseline subsequently developing CDMS (Beck et al. 2003). Similar results have been found by several groups investigating the natural history of developing MS after CIS including O’Riordan et al. (1998) after 10 years of follow-up. Subsequently Brex et al. (2002) followed the natural history cohort of O’Riordan et al. for up to 14 years since the first attack. This group included other typical forms of demyelination in addition to optic neuritis. In this population, approximately 88% of patients with an abnormal brain MRI at baseline converted to CDMS or laboratory-supported definite MS. However, only 19% of those with a normal initial brain MRI subsequently went on to MS.Although these studies differ in selection criteria and patients lost to follow-up, they support the prognostic value of early MRI abnormalities in MS.
The expanding knowledge of the predictive value of MRI in high-risk patients and that gained from the natural history of MRI changes in MS have led to a revision in the diagnostic criteria for MS proposed by an international panel of experts that met in London in 2000 (McDonald et al. 2001). In the appropriate clinical setting, MRI can support the diagnosis by providing additional evidence for disease dissemination that is separated in space and in time, especially in those patients who have only had the disease for a short period of time and lack sufficient clinical evidence to make the diagnosis. Table 14.1 summarizes how the MRI evidence required to support the diagnosis varies depending on the strength of the clinical findings. Table 14.2 illustrates the timing of serial MRI required to provide evidence for disease activity disseminated in time. The impact of using MRI in this manner is that patients can be diagnosed sooner with MS before they have new clinical symptoms. In a prospective natural history study of patients with a CIS, Dalton et al. found that only 20% of patients had had a second clinical attack at 2 years and met the Poser criteria, while 48% had a new clinically silent MRI activity and met the new international panel diagnostic criteria (Dalton et al. 2002). These patients included those with and without abnormalities on the baseline brain MRI. The specificity of the new criteria, compared to the traditional Poser criteria, was 95% (Dalton et al. 2003).
How valid these MRI criteria would be in atypical MS populations such as pediatric MS is not known. Furthermore, the evolution of MRI lesions in other white matter diseases such as neuroborreliosis, CNS angiitis, and CNS lupus have not been systematically studied to determine the specificity of these new diagnostic criteria. It is not uncommon to come across case series, such as with CNS involvement with Sjögren’s disease (De Seze et al. 2001) where the MRI appearance and the clinical evolution resemble MS. Therefore, it must be emphasized that MRI plays a supportive role in the diagnosis, in the appropriate clinical situation, and always at the exclusion of alternative diagnoses (McDonald et al. 2001).
In diagnostically uncertain cases, the addition of spinal cord imaging can be extremely useful. Although the incidence of spinal cord lesions in MS is lower than that of brain lesions (present in 50–90% of patients with CDMS), the combination of spinal cord lesions with an abnormal brain MRI can improve the diagnostic confidence when other diseases are under consideration (Lycklama et al. 2003). An abnormal spinal cord MRI does not occur in normal controls, even in the elderly, and is much less com-

218 |
A. Traboulsee et al. |
Table 14.1. International Diagnostic Criteria for MS (McDonald et al. 2001) (RRMS relapsing-remitting MS; CIS monosymptomatic, clinically isolated syndrome consistent with demyelination; PPMS primary progressive MS)
Clinical evidence |
|
|
MRI evidence required to support diagnosis of MS |
|
|
|
|
|
|
Clinical attacksa |
Physical signsb |
|
Dissemination in spacec |
Dissemination in timed |
Two or more (RRMS) |
Two or more |
|
Not needed (but recom- |
Not needed |
|
|
|
mended) |
|
Two or more (RRMS) |
One |
|
Required |
Not needed |
One (CIS) |
Two or more |
|
Not needed |
Required |
One (CIS) |
One |
|
Required |
Required |
None (PPMS) |
One |
|
Requirede (and positive |
Not needed (but helpful) |
|
|
|
CSF) |
|
|
|
|
|
|
a Clinical attacks must be documented.
bPositive visual evoked potentials (delayed but well-preserved wave form) can substitute for one abnormal physical sign.
cMRI criteria for dissemination in space criteria in RRMS requires one of:
A.Two MRI lesions and positive CSF (oligoclonal IgG bands or elevated IgG index) OR
B.Positive MRI by modified Barkhof criteria requires three of the following four criteria (one spinal cord lesion can substitute for one brain lesion, but a spinal cord lesion does not count as an infratentorial lesion):
One or more gadolinium-enhancing lesions OR nine or more T2 lesions One or more infratentorial lesions
One or more juxtacortical lesions Three or more periventricular lesions
d MRI criteria for dissemination in time (Table 2).
eDissemination in space criteria for MRI in primary progressive MS (PPMS) requires positive CSF and one of: Two or more spinal cord lesions
Three or more brain lesions and one spinal cord lesion and positive visual evoked potentials Four or more brain lesions and one spinal cord lesion
Four or more brain lesions and positive VEPs Nine or more T2 lesions (brain) only
Table 14.2. MRI evidence for dissemination in time
First scan |
Follow-up scan requirements for dissemination in time |
|
(time since first attack, months) |
(not required if a second clinical attack occurs) |
|
|
|
|
Early (<3) |
Second scan ≥3 months after attack but |
Gadolinium-enhancing lesion on |
|
<3 months after first MRI |
second scan |
Early (<3) |
Second scan ≥3 months after first MRI |
New T2 or gadolinium-enhancing |
|
|
lesion on second scan |
Delayed− (≥3, and no gadolinium- |
Second scan ≥3 months after first MRI |
New T2 or gadolinium-enhancing |
enhancing lesions present) |
|
lesion on second scan |
Delayed+ (≥3, and gadolinium- |
Follow-up scan not required |
|
enhancing lesion present) |
|
|
|
|
|
mon with ischemia and other neurological diseases (6%) (Bot et al. 2002). Currently, the other recommended paraclinical tests used in the diagnosis of MS include cerebral spinal fluid analysis and visual evoked potentials. Although they lack the sensitivity of MRI, they can be helpful when the MRI abnormalities are indeterminate (McDonald et al. 2001).
MRI is not required for the diagnosis of MS. Nor are the individual lesions seen with conventional MRI techniques specific to MS. However, the pattern and evolution of MRI lesions, in the appropriate clinical setting, has made MRI abnormities important criteria for the early diagnosis of MS.

Conventional MRI Techniques in Multiple Sclerosis |
219 |
14.5
Clinical Correlations
14.5.1 Relapses
Most new MRI lesions are neurologically silent. The ability of conventional MRI to detect these lesions in the absence of clinical symptoms has contributed (ironically) to its generally poor correlation with overall clinical disability. The factors that determine neurological expression are probably a combination of location and the intensity and nature of pathology in the active lesion. Most clinical relapses are associated with new lesions on MRI (Smith et al. 1993; Thorpe et al. 1996) and RRMS patients can have new MRI lesions five to ten times more frequently than clinical relapses. Thus, only one of ten MRI active lesions hits an eloquent neurological tract and causes specific neurological symptoms to be identified as a clinical relapse. The severity of the pathological process in that lesion will affect the severity of the symptoms being expressed. Lesions that occur in relatively nonspecific areas of the brain such as the frontal lobes and the temporal lobes probably cause very subtle cognitive and emotional changes without necessarily producing specific neurological syndromes.Clinical relapses typically decrease in frequency with disease duration, and eventually most patients enter a phase of MS (SPMS) where progressive neurological deterioration occurs usually in the absence of clinical relapses. However, these patients continue to have a variable frequency of new lesion activity (Koopmans et al. 1989a).
14.5.2 Disability
Disability in MS can be transiently related to a clinical relapse or the result of incomplete recovery from a relapse, or be independent of relapses as a slow, relentless process. Disability has been traditionally measured on the ten-point Kurtzke expanded disability status scale (EDSS) (Kurtzke 1983).This scale can have significant interand intrarater variability, and tends to neglect cognitive dysfunction and fatigue. In most studies, there are significant but only modest correlations between EDSS and MRI active lesions and T2 BOD.
In contrast, cognitive abnormalities correlate well with the extent of involvement on the standard axial
MRI image (Pozzilli et al. 1992). The location of the lesions may also be important as seen in a study of 39 MS patients where subcortical white matter disease was more strongly associated with cognitive dysfunction than total lesion load or cerebral atrophy (Damian et al. 1994). Modest associations can also be seen with regional atrophy measures, such as corpus callosum thinning (Edwards et al. 2001).
The poor correlation between MRI and clinical status is limited by the poor sensitivity of the clinical measures and by the inherent lack of tissue specificity of T2W images. Chronic black holes are associated with greater tissue destruction and have the potential for improved correlations with disability scales. In small studies, the correlations between the T1W black holes and EDSS have been modest but higher than those seen with T2 BOD for the same population (Truyen et al.1996).However,a lack of a standardized approach to measuring and defining chronic black holes may limit future studies (Barkhof et al. 1998).
Brain and spinal cord atrophy are believed to be a common final pathway for the neurodegenerative aspects of MS that relate to irreversible disability. In general, correlations between global atrophy measures and disability have also only been modest (Miller et al. 2002). Regional atrophy of the spinal cord does tend to correlate better with disability. The cervical cord area measured using a technique with good reproducibility demonstrated a strong (r=−0.7) correlation between spinal cord area and disability measured by EDSS (Losseff et al. 1996b).At a mildly impaired EDSS of 3,the average cord area was reduced by 12% while at a severe level of disability (EDSS of 8) the average cord area was reduced by 35%. This may reflect the inherent bias of the EDSS for mobility that is reflected by spinal cord integrity.
Each MRI measure in isolation is only modestly correlated with clinical disability. This poor correlation between clinical and conventional MRI measures has,in part,fueled the need to develop additional MRI techniques such as magnetization transfer imaging and magnetic resonance spectroscopy.Efforts to combine multiple measures, including conventional and newer techniques, fail to fully explain the variance within a population’s disability scores (Traboulsee et al. 2003). On the one hand, this reflects the limited nature of the EDSS scale which does not precisely quantify all aspects of clinical dysfunction. On the other hand, many T2 lesions are clinically silent and do not directly contribute to the disability, while functional reorganization may minimize the impact new lesions have on clinical disability. However, each of the conventional MRI measures reveals important

220 |
A. Traboulsee et al. |
and complimentary information that reflects the pathology of MS.
14.5.3 Prognosis
MRI measures are rarely used for prognosis because of this poor correlation with clinical outcome factors. One exception is for those patients presenting with a CIS who are at high risk of developing MS. The presence of MRI lesions in these patients is a strong predictor of MS and the baseline number, volume of lesions and rate of increase of total lesion volume over five years does have some prognostic value for future disability (Brex et al. 2002). A normal early scan also appears to predict a more benign course, although the numbers are quite small. However, for patients with established MS, the predictive value of new MRI lesions for short-term clinical outcomes such as relapses and disability remains poor (Kappos et al. 1999). A meta-analysis of 281 MS patients by Filippi (Filippi et al. 1995) found a significant but weak correlation between the development of new or enlarging T2 lesions over 2 to 3 years and worsening EDSS. It is possible that different mechanisms for disability dominate during different stages of the disease. There are several important long-term follow-up studies underway of patients with RRMS, originally enrolled in the pivotal interferon beta-1b and beta-1a clinical trials, that will include a comparison of their baseline MRI, with one obtained 7 to 10 years after starting treatment. It may be possible to use the baseline MRI characteristics to determine patterns of abnormalities that predict response to therapy and long-term prognosis.
14.6
Monitoring Treatment
Over the past decade there has been an increasing number of pivotal phase III clinical trials evaluating new therapies in MS. Conventional MRI measures of disease activity (new T2 and T1 gadolinium-en- hancing lesions) and disease burden (T2 BOD and T1 hypointensities) have played an important role as a secondary outcome measures in the assessment and approval of these new treatments. The impact on new lesion activity varied from a suppression of less than 50% for new lesion formation or active scans compared to placebo for glatiramer acetate (Comi et
al. 2001b) and interferon beta-1a 30 µg once weekly (Jacobs et al. 1996) to greater than 80% suppression for the higher dose interferons beta-1a (Li and Paty 1999) and beta-1b (Paty and Li 1993). The higher dose and higher frequency interferons beta-1a and beta-1b also had the greatest impact on reducing the accumulation of T2 BOD, with up to 4 years of follow-up (Prisms Study Group 2001). This pattern of response was consistent for drugs within the same class (interferon beta-1a and beta-1b) and with drugs that work by different mechanisms of action (glatiramer acetate).
The MRI measures were objectively quantified, blinded, and could be standardized for multicenter studies using clinical MRI scanners that varied in field strength, manufacturer, software and local expertise. Gadolinium-enhancing lesions, new T2 lesions and enlarging T2 lesions all represent new inflammation. It might be considered redundant information to detect all three types of lesions. However, it is useful to see a consistency in response across these measures, and in our experience, one measure may be more sensitive to a dose difference that would have been missed had only gadolinium-enhancing lesions been used (Li and Paty 1999). More recently, Wolinsky et al. have proposed a composite index of four MRI outcomes (contrast-enhancing lesion volume, T2 BOD, T1 hypointensity volume and CSF volume) as a potential outcome measure (Wolinsky et al. 2000) which would need to be evaluated and validated.
New lesion activity as detected by MRI has been favored as the primary outcome measure for phase I and phase II clinical trials of promising new therapies in MS. This is because it allows fairly rapid assessment using fewer patient because of the relatively higher frequency of MRI activity compared to clinical relapses. However, this could bias against the development of agents that have a potentially greater impact on the neurodegenerative aspects of the disease rather than inflammation.
Applying these results obtained from group or population outcomes from clinical trials to making treatment decisions for the individual patient remains unproven. The poor correlation between clinical status and MRI measures, and the yet-to-be proven long-term prognostic value of MRI limits its use for monitoring treatment response. There is also tremendous individual variation in the response to treatment, with almost a similar spread in response between those who are on placebo and those who have been treated. On the other hand, most would agree that MRI is an in vivo measure of the pathology of MS: new MRI activity reflects active inflammation