

Книги по МРТ КТ на английском языке / MR Imaging in White Matter Diseases of the Brain and Spinal Cord - K Sartor Massimo Filippi Nicola De Stefano Vincent Dou
.pdfMR Spectroscopy
tal lobe cytosolic choline levels in minimal or mild AIDS dementia complex patients: a proton magnetic resonance spectroscopy study. Biol Psychiatry 41:500–502
Evans FE, Kaplan NO (1977) 31P nuclear magnetic resonance studies of HeLa cells. Proc Natl Acad Sci U S A 74:4909– 4913
Falini A, Calabrese G, Filippi M, et al (1998) Benign versus secondary-progressive multiple sclerosis: the potential role of proton MR spectroscopy in defining the nature of disability. Am J Neuroradiol 19:223–229
Ferguson B, Matyszak MK, Esiri MM, Perry VH (1997) Axonal damage in acute multiple sclerosis lesions. Brain 120:393– 399
Filippi M (2001) In-vivo tissue characterization of multiple sclerosis and other white matter diseases using magnetic resonance based techniques. J Neurol 248:1019–1029
Filippi M, Tortorella C, Bozzali M (1999) Normal-appearing white matter changes in multiple sclerosis: the contribution of magnetic resonance techniques. Mult Scler 5:273–282
Filippi M, Bozzali M, Rovaris M, et al (2003) Evidence for widespread axonal damage at the earliest clinical stage of multiple sclerosis. Brain 126:433–437
Font C, Garia-Campos M, Hansen AJ, Siemkowicz E, Gjedde A (1982) Simultaneous diffusion of inositol and mannitol in the rat brain (in Spanish). Rev Esp Fisiol 38:317–319
Frahm J, Bruhn H, Gyngell ML, Merboldt KD, Hanicke W, Sauter R (1989) Localized proton NMR spectroscopy in different regions of the human brain in vivo. Relaxation times and concentrations of cerebral metabolites. Magn Reson Med 11:47–63
Frahm J, Michaelis T, Merboldt KD, et al (1989) Localized NMR spectroscopy in vivo. Progress and problems. NMR Biomed 2:188–195
Gadian DG, Radda GK (1981) NMR studies of tissue metabolism. Annu Rev Biochem 50:69–83
Gonen O, AriasMendoza F, Goelman G (1997) 3D localized in vivo H-1 spectroscopy of human brain by using a hybrid of 1D-Hadamard with 2D chemical shift imaging. Magn Reson Med 37:644–650
Gonen O, Murdoch JB, Stoyanova R, Goelman G (1998) 3D multivoxel proton spectroscopy of human brain using a hybrid of 8th-order Hadamard encoding with 2D chemical shift imaging. Magn Reson Med 39:34–40
Gonen O, Catalaa I, Babb JS, et al (2000) Total brain N-acetylas- partate—a new measure of disease load in MS. Neurology 54:15–19
Gonen O, Moriarty DM, Li BSY, et al (2002) Relapsing-remit- ting multiple sclerosis and whole-brain N-acetylaspartate measurement: evidence for different clinical cohorts—ini- tial observations. Radiology 225:261–268
Hanefeld F, Holzbach U, Kruse B, Wilichowski E, Christen HJ, Frahm J (1993) Diffuse white matter disease in three children: an encephalopathy with unique features on magnetic resonance imaging and proton magnetic resonance spectroscopy. Neuropediatrics 24:244–248
Helms G (2000) A precise and user-independent quantification technique for regional comparison of single volume proton MR spectroscopy of the human brain. NMR Biomed 13:398–406
Helms G (2001) Volume correction for edema in single-volume proton MR spectroscopy of contrast-enhancing multiple sclerosis lesions. Magn Reson Med 46:256–263
Helms G, Stawiarz L, Kivisakk P, Link H (2000) Regression
125
analysis of metabolite concentrations estimated from localized proton MR spectra of active and chronic multiple sclerosis lesions. Magn Reson Med 43:102–110
Hennig J, Pfister H, Ernst T, Ott D (1992) Direct absolute quantification of metabolites in the human brain with in vivo localized proton spectroscopy. NMR Biomed 5:193–199
Horska A, Calhoun VD, Bradshaw DH, Barker PB (2002) Rapid method for correction of CSF partial volume in quantitative proton MR spectroscopic imaging. Magn Reson Med 48:555–558
Husted CA, Goodin DS, Hugg JW, et al (1994) Biochemical alterations in multiple-sclerosis lesions and normalappearing white matter detected by in vivo P-31 and H-1 spectroscopic imaging. Ann Neurol 36:157–165
Iles RA, Stevens AN, Griffiths JR (1982) NMR-studies of metabolites in living tissue. Prog Nucl Magn Reson Spectrosc 15:49
Iranzo A, Moreno A, Pujol J, et al (1999) Proton magnetic resonance spectroscopy pattern of progressive multifocal leukoencephalopathy in AIDS. J Neurol Neurosurg Psychiatry 66:520–523
Jarvik JG, Lenkinski RE, Grossman RI, Gomori JM, Schnall MD, Frank I (1993) Proton MR spectroscopy of HIV-infected patients: characterization of abnormalities with imaging and clinical correlation. Radiology 186:739–744
Jelicks LA,Gupta RK (1989) Multinuclear NMR studies of the Langendorff perfused rat heart. J Biol Chem 264:15230–15235 Knight-Scott J, Haley AP, Rossmiller SR, et al (2003) Molality as
a unit of measure for expressing H-1 MRS brain metabolite concentrations in vivo. Magn Reson Imaging 21:787–797
Kreis R, Ernst T, Ross BD (1993a) Absolute quantitation of water and metabolites in the human brain. 2. Metabolite concentrations. J Magn Reson B 102:9–19
Kreis R, Ernst T, Ross BD (1993b) Development of the human brain—in vivo quantification of metabolite and water content with proton magnetic resonance spectroscopy. Magn Reson Med 30:424–437
Kuchel PW (1981) Nuclear magnetic resonance of biological samples. Crit Rev Anal Chem 12:155–231
Laubenberger J, Haussinger D, Bayer S, et al (1996) HIV-related metabolic abnormalities in the brain: depiction with proton MR spectroscopy with short echo times. Radiology 199:805–810
Law M, Meltzer DE, Cha S (2002) Spectroscopic magnetic resonance imaging of a tumefactive demyelinating lesion. Neuroradiology 44:986–989
London RE (1988) C-13 labelling in studies of metabolic-regu- lation. Prog Nucl Magn Reson Spectrosc 20:337–383
Lopez-Villegas D, Lenkinski RE, Wehrli SL, Ho WZ, Douglas SD (1995) Lactate production by human monocytes/macrophages determined by proton MR spectroscopy. Magn Reson Med 34:32–38
Lopez-Villegas D, Lenkinski RE, Frank I (1997) Biochemical changes in the frontal lobe of HIV-infected individuals detected by magnetic resonance spectroscopy. Proc Natl Acad Sci U S A 94:9854–9859
Martin E, Capone A, Schneider J, Hennig J, Thiel T (2001a) Absence of N-Acetylaspartate in the human brain: impact on neurospectroscopy? Ann Neurol 49:518–521
Martin E, Thiel T, Capone A, Hennig J, Schneider J (2001b) N-Acetylaspartate: usefulness as an indicator of viable neuronal tissue – reply. Ann Neurol 50:824–825
Matthews PM, Francis G, Antel J, Arnold DL (1991) Proton

126
magnetic resonance spectroscopy for metabolic characterization of plaques in multiple sclerosis. Neurology 41:1251–1256
McGuire D, Marder K (2000) Pharmacological frontiers in the treatment of AIDS dementia. J Psychopharmacol 14:251–257 McLean MA, Woermann FG, Barker GJ, Duncan JS (2000) Quantitative analysis of short echo time H-1-MRSI of cere-
bral grey and white matter. Magn Reson Med 44:401–411 McLean MA, Woermann FG, Simister RJ, Barker GJ, Duncan
JS (2001) In vivo short echo time H-1-magnetic resonance spectroscopic imaging (MRSI) of the temporal lobes. Neuroimage 14:501–509
Meyerhoff DJ, MacKay S, Bachman L, et al (1993) Reduced brain N-acetylaspartate suggests neuronal loss in cognitively impaired human immunodeficiency virus-seroposi- tive individuals: in vivo 1H magnetic resonance spectroscopic imaging. Neurology 43:509–515
Meyerhoff DJ, MacKay S, Poole N, Dillon WP, Weiner MW, Fein G (1994) N-acetylaspartate reductions measured by 1H MRSI in cognitively impaired HIV-seropositive individuals. Magn Reson Imaging 12:653–659
Meyerhoff DJ, Bloomer C, Cardenas V, Norman D, Weiner MW, Fein G (1999) Elevated subcortical choline metabolites in cognitively and clinically asymptomatic HIV+ patients. Neurology 52:995–1003
Mierisova S, Ala-Korpela M (2001) MR spectroscopy quantitation: a review of frequency domain methods. NMR Biomed 14:247–259
Miller BL (1991) A review of chemical issues in H-1-NMR spectroscopy—N-acetyl-L-aspartate, creatine and choline. NMR Biomed 4:47–52
Miller DH,Austin SJ, Connelly A,Youl BD, Gadian DG, McDonald WI (1991) Proton magnetic resonance spectroscopy of an acute and chronic lesion in multiple sclerosis. Lancet 337:58–59
Moonen CT, von Kienlin M, van Zijl PC, et al (1989) Comparison of single-shot localization methods (STEAM and PRESS) for in vivo proton NMR spectroscopy. NMR Biomed 2:201–208
Narayana PA, DeLayre JL (1986) Localization methods in NMR. In: Partain CL, Price RR, Patton JA, Kulkarni MV, James AE (eds) Magnetic resonance imaging. WB Saunders, Philadelphia, pp 1609–1630
Narayana PA, Doyle TJ, Lai D, Wolinsky JS (1998) Serial proton magnetic resonance spectroscopic imaging, con- trast-enhanced magnetic resonance imaging, and quantitative lesion volumetry in multiple sclerosis. Ann Neurol 43:56–71
Navon G, Ogawa S, Shulman RG, Yamane T (1977a) High-reso- lution 31P nuclear magnetic resonance studies of metabolism in aerobic Escherichia coli cells. Proc Natl Acad Sci U S A 74:888–891
Navon G, Ogawa S, Shulman RG,Yamane T (1977b) 31P nuclear magnetic resonance studies of Ehrlich ascites tumor cells. Proc Natl Acad Sci U S A 74:87–91
Paley M, Wilkinson ID, Hall-Craggs MA, Chong WK, Chinn RJ, Harrison MJ (1995) Short echo time proton spectroscopy of the brain in HIV infection/AIDS. Magn Reson Imaging 13:871–875
Pauly J, Leroux P, Nishimura D, Macovski A (1991) Parameter relations for the Shinnar-Leroux selective excitation pulse design algorithm. IEEE Trans Med Imaging 10:53–65
Posse S, Decarli C, Lebihan D (1994) 3-Dimensional echo-
R. E. Lenkinski
planar MR spectroscopic imaging at short echo times in the human brain. Radiology 192:733–738
Posse S, Tedeschi G, Risinger R, Ogg R, Lebihan D (1995) High-speed H-1 spectroscopic imaging in human brain by echo-planar spatial-spectral encoding. Magn Reson Med 33:34–40
Provencher SW (2001) Automatic quantitation of localized in vivo H-1 spectra with LCModel. NMR Biomed 14:260–264 Pulliam L, Irwin I, Kusdra L, Rempel H, Flitter WD, Garland WA (2001) CPI-1189 attenuates effects of suspected neurotoxins associated with AIDS dementia: a possible role for
ERK activation. Brain Res 893:95–103
Radda GK, Taylor DJ (1985) Applications of nuclear magneticresonance spectroscopy in pathology. Int Rev Exp Pathol 27:1–58
Roberts JKM, Jardetzky O (1981) Monitoring of cellularmetabolism by NMR. Biochim Biophys Acta 639:53–76
Ross BD, Bluml S (1996) New aspects of brain physiology. NMR Biomed 9:279–296
Ross B, Bluml S (2001) Magnetic resonance spectroscopy of the human brain. Anat Rec 265:54–84
Rudkin TM, Arnold DL (2002) MR spectroscopy and the biochemical basis of neurological disease. In: Atals SW (ed) Magnetic , 2nd edn. Lippincott Williams and Wilkins, Philadelphia
Ruiz-Cabello J, Cohen JS (1993) NMR and the study of pathological state in cells and tissues. Int Rev Cytol 145:1–63 Saindane AM, Cha S, Law M, Xue X, Knopp EA, Zagzag D
(2002) Proton MR spectroscopy of tumefactive demyelinating lesions. Am J Neuroradiol 23:1378–1386
Salvan AM, Vion-Dury J, Confort-Gouny S, Nicoli F, Lamoureux S, Cozzone PJ (1997) Brain proton magnetic resonance spectroscopy in HIV-related encephalopathy: identification of evolving metabolic patterns in relation to dementia and therapy. AIDS Res Hum Retroviruses 13:1055–1066
Sarchielli P, Presciutti O, Tarducci R, et al (2002) Localized H-1 magnetic resonance spectroscopy in mainly cortical grey matter of patients with multiple sclerosis. J Neurol 249:902–910
Schuff N, Ezekiel F, Gamst AC, et al (2001) Region and tissue differences of metabolites in normally aged brain using multislice 1H magnetic resonance spectroscopic imaging. Magn Reson Med 45:899–907
Shinnar M (1994) Reduced power selective excitation radio frequency pulses. Magn Reson Med 32:658–660
Shinnar M, Leigh JS (1989) The application of spinors to pulse synthesis and analysis. Magn Reson Med 12:93–98
Shinnar M, Bolinger L, Leigh JS (1989a) The synthesis of soft pulses with a specified frequency response. Magn Reson Med 12:88–92
Shinnar M,Bolinger L,Leigh JS (1989b) The use of finite impulse response filters in pulse design. Magn Reson Med 12:81–87 Shinnar M, Eleff S, Subramanian H, Leigh JS (1989c) The synthesis of pulse sequences yielding arbitrary magnetization
vectors. Magn Reson Med 12:74–80
Simmons ML, Frondoza CG, Coyle JT (1991) Immunocytochemical localization of N-acetyl-aspartate with monoclonal antibodies. Neuroscience 45:37–45
Simone IL, Federico F, Tortorella C, et al (1998) Localised H- 1-MR spectroscopy for metabolic characterisation of diffuse and focal brain lesions in patients infected with HIV. J Neurol Neurosurg Psychiatry 64:516–523

MR Spectroscopy
Spielman D, Pauly J, Macovski A, Enzmann D (1991) Spectroscopic imaging with multidimensional pulses for excitation: SIMPLE. Magn Reson Med 19:67–84
Stankoff B, Tourbah A, Suarez S, et al (2001) Clinical and spectroscopic improvement in HIV-associated cognitive impairment. Neurology 56:112–115
Sullivan EV, Adalsteinsson E, Spielman DM, Hurd RE, Pfefferbaum A (2001) N-acetylaspartate—a marker of neuronal integrity. Ann Neurol 50:823
Tallan HH, Moore S, Stein WH (1956) N-acetyl-L-aspartic acid in brain. J Biol Chem 219:257–264
Tkac I, Rao R, Georgieff MK, Gruetter R (2003) Developmental and regional changes in the neurochemical profile of the rat brain determined by in vivo 1H NMR spectroscopy. Magn Reson Med 50:24–32
Tracey I, Carr CA, Guimaraes AR, Worth JL, Navia BA, Gonzalez RG (1996) Brain choline-containing compounds are elevated in HIV-positive patients before the onset of AIDS dementia complex: a proton magnetic resonance spectroscopic study. Neurology 46:783–788
Tran TKC,Vigneron DB, Sailasuta N, et al (2000) Very selective suppression pulses for clinical MRSI studies of brain and prostate cancer. Magn Reson Med 43:23–33
Trapp BD, Peterson J, Ransohoff RM, Rudick R, Mork S, Bo L (1998) Axonal transection in the lesions of multiple sclerosis. New Engl J Med 338:278–285
Ugurbil K, Adriany G, Andersen P, et al (2003) Ultrahigh field
127
magnetic resonance imaging and spectroscopy. Magn Reson Imaging 21:1263–1281
Valenzuela MJ, Sachdev P (2001) Magnetic resonance spectroscopy in AD. Neurology 56:592–598
Vanhamme L, Sundin T, Van Hecke P, Van Huffel S (2001) MR spectroscopy quantitation: a review of time-domain methods. NMR Biomed 14:233–246
Vion-Dury J, Nicoli F, Salvan AM, Confort-Gouny S, Dhiver C, Cozzone PJ (1995) Reversal of brain metabolic alterations with zidovudine detected by proton localised magnetic resonance spectroscopy (letter). Lancet 345:60–61
von Giesen HJ, Wittsack HJ, Wenserski F, Koller H, Hefter H, Arendt G (2001) Basal ganglia metabolite abnormalities in minor motor disorders associated with human immunodeficiency virus type 1. Arch Neurol 58:1281–1286
Wiedermann D, Schuff N, Matson GB, et al (2001) Short echo time multislice proton magnetic resonance spectroscopic imaging in human brain: metabolite distributions and reliability. Magn Reson Imaging 19:1073–1080
Yongbi NM, Payne GS, Collins DJ, Leach MO (1995) Quantification of signal selection efficiency, extra volume suppression and contamination for ISIS, STEAM and PRESS localized 1H NMR spectroscopy using an EEC localization test object. Phys Med Biol 40:1293–1303
Zandt H, van der Graaf M, Heerschap A (2001) Common processing of in vivo MR spectra. NMR Biomed 14:224– 232

Molecular Imaging and High-Field MRI in Multiple Sclerosis |
129 |
10Molecular Imaging and High-Field MRI in Multiple Sclerosis
Alayar Kangarlu
CONTENTS
10.1Molecular Imaging 129
10.1.1 Biomarkers 130
10.1.1.1Natural Biomarkers 131
10.1.1.2Passive Targeting 131
10.1.1.3Active Targeting 132
10.1.2 |
Technical Issues of MRI in MI 133 |
|
10.1.2.1 |
Animal Studies |
133 |
10.1.2.2 |
Human Studies |
133 |
10.1.3 |
State of the Art in MI of Animal Models in MS 135 |
|
10.2High-Field MRI 137
10.2.1 State of the Art in MR Research in MS 139
10.2.2High Field 139
10.2.3SNR 140
10.2.4Susceptibility 142
10.2.5RF Penetration 142
10.2.6 |
RF Coil Design 142 |
10.2.7 |
Gradients and Receivers 143 |
10.2.8Relaxation Effects 143
10.2.9Ultra-High-Resolution MRI 144
10.2.10 |
New Technologies in MS Imaging 144 |
10.2.11 |
HF MRI of MS 145 |
10.2.12 |
Other MRI Methods 145 |
10.3Conclusion 145 References 146
10.1
Molecular Imaging
Considering the early success of contrast-based imaging techniques it is essential to understand the basis for molecular imaging (MI). While all imaging modalities have distinct capabilities in visualizing inner structure and function of biological tissues, no single technique has all the desirable characteristics of specificity, sensitivity and resolution.As far as MRI is concerned, there is a fundamental barrier against directly accessing a small number of molecules at field strengths below 10 Tesla (T) at room tempera-
A. Kangarlu, PhD
Head of MRI Physics and Assistant Professor of Clinical Neuroscience, Columbia University College of Physicians and Surgeons and New York State Psychiatric Institute, 1051 Riverside Drive, Unit 74, New York, NY 10032, USA
ture. The physical basis of the obstacle against MRI access to individual molecular events is discussed in the following sections. The minute magnetic dipole of the individual hydrogen protons necessitates an observation of magnetization of a large ensemble or amplification to the MRI signal in order to detect a small group of molecules. Since magnetization is directly proportional to the magnetic field, i.e., magnetic flux density, there is a relationship between field strength and the signal to noise ratio (SNR) obtained from a specific voxel.Within a specific magnetic field, the image contrast to noise ratio (CNR) can be manipulated using paramagnetic contrast agents. These contrast agents usually have one or more unpaired electrons. This assigns a high magnetic susceptibility to these contrast agents which enables them to generate strong positive,i.e.,T1 shortening,or negative,i.e., T2 shortening, contrast generating attributes. This is not signal amplification but a contrast augmentation. This artificial contrast will greatly enhance the focusing power of MRI for small area observations. This technique is taken one step further by conjugating these agents with specialized macromolecules. These macromolecules possess biochemical properties that enable them to distinguish a particular biological process. Contrast agents can be designed to reach and build up at a specific pathological site by passive or active targeting mechanisms (Li and Bednarski 2002; Baddanov 2002). In passive targeting, the probe can be a radiolabeled ligand, substrate, antibody, or cytokine. In active MI, the probes are capable of being activated by a particular RF pulse and extracellular proteases, among others, for targeted delivery and interrogation of a desired site. In both cases, however, pathophysiologically guided contrast agents are made to accumulate at a specific site and enhance visualization.
In general, there are two mechanisms through which image contrast at molecular level can be achieved. One way is to probe endogenously expressed proteins using contrast agents. The second approach for contrast rendering at molecular level is by using reporter genes that could be transfected
130 |
A. Kangarlu |
to enable expression (Luker et al. 2002; Ray et al. 2004). MRI application in the visualization of endogenous expression has been very limited to date. Such a technique would be very powerful as it would enable diagnosis and staging for many neuropathologic conditions. In addition, the potential now exists for using imaging and therapeutic agents synergistically to mutually optimize their performance to enable monitoring and therapy by imaging. This could eventually lead into MI capable of identifying pre-disease conditions during which therapy could be more effective. In active MI, reporter genes interrogating specific intracellular events require that an exogenous contrast reagent is attached to them (Gillies 2002). These reagents will detect the presence of gene products and intracellular processes. The challenges include overcoming the blood–brain barrier (BBB) to get the imaging probes to their targets. For MRI, a challenge is to devise techniques to produce good SNR and CNR for target concentrations which are in the microto picomolar range.
10.1.1 Biomarkers
Pathological events involve molecules whose MR signals are too small to detect directly. The difficulty of enhancing the resolution of imaging to
visualize the molecular events is primarily due to the energy gap of the spin groups. Because of the minute energy difference between the spin dipole moments parallel to and opposing the main magnetic field, the excess protons that participate in the spin flipping dynamics as a result of RF excitation are a tiny fraction of molecular density. Approximately one part per million (1 ppm) of the total protons are magnetically accessible for each 1 T of magnetic field. As such, there are two possible ways of enhancing the MR signal to access molecular events, invasive and noninvasive. High magnetic field is a noninvasive method and targeted contrast agents are the invasive method for enhancing molecular signal. The ability of high field in enhancing the resolution of MR images (see Figs. 10.1 and 10.2) has been described in this article in the context of the performance of an 8-T whole body MR scanner. The existence of contrast agents or biomarkers can cause positive (T1 shortening groups such as Gd-DTPA) and negative (T2 shortening groups of ultra-small superparamagnetic iron oxide or USPIO macromolecules coated with dextran) signal modulation. In making them relevant to pathology studies they must be targeted to pathology sites. The biochemistry of biomarker design has been analyzed in many review articles (Li and Bednarski 2002; Allen et al. 2004; Floyd and McShane 2004). In short, their sensitivity must
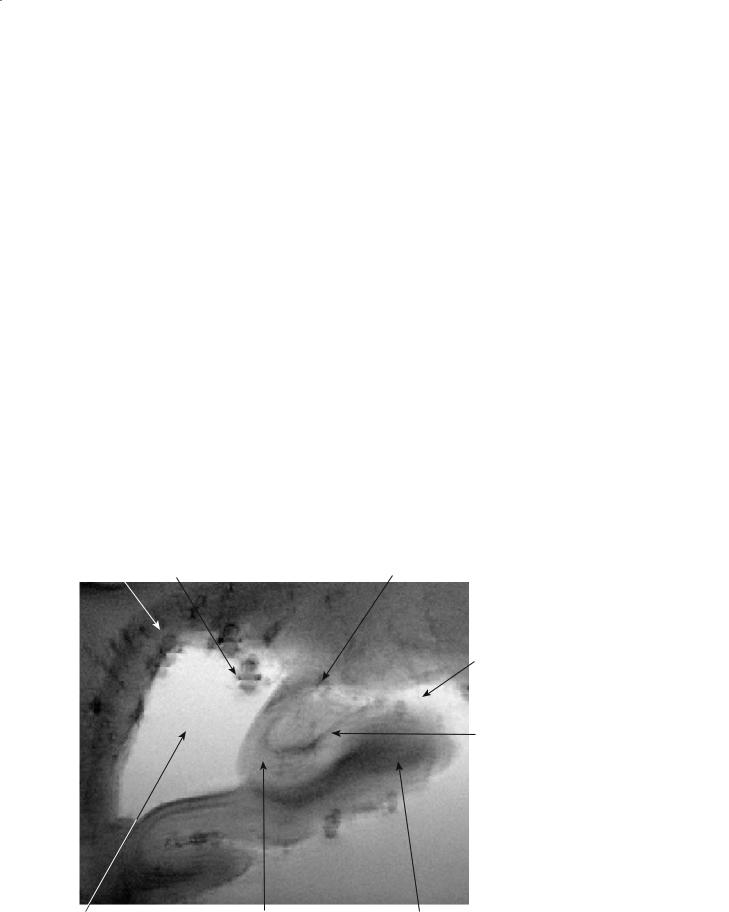
Medullary vein |
Vessel in temporal horn |
Choroid plexus |
|
|
Choroidal fi ssure
Gyrus dentatus
Temporal horn |
Hippocampus |
Parahippocampal gyrus |
Fig. 10.1. A 2D gradient echo image of a coronal hippocampal section of a human brain imaged ex vivo at 8 T. The image was acquired with TR/ TE of 500/30 ms, FOV=15 cm, 1024×1024, with 150-µm in-plane resolution and a slice thickness of 1 mm. The resolution of the T2* image is sufficient to visualize many hippocampal subfields, such as granule cell layer of gyrus dentatus, vestigial hippocampal sulcus, and some layers of the CA1
Molecular Imaging and High-Field MRI in Multiple Sclerosis |
131 |
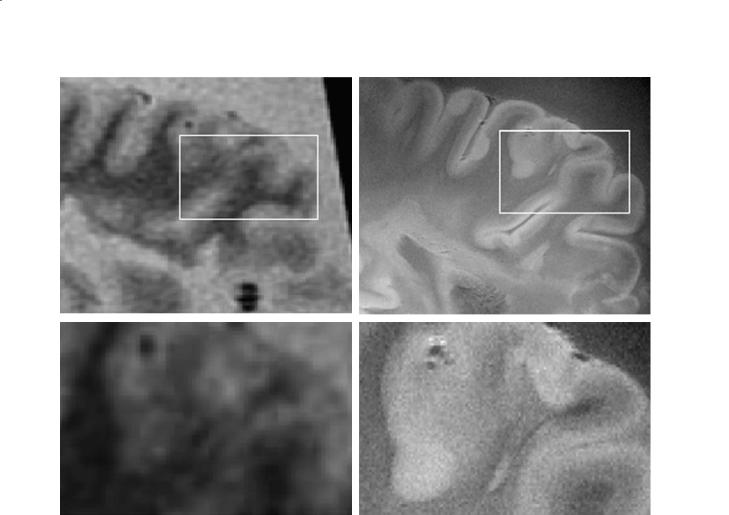
a |
b |
c |
d |
Fig. 10.2a–d. MR images of whole brain slices of an MS patient. a A 1.5-T FLAIR T2 acquired with a 256×256 matrix. b An 8- T GRE with a 1024×1024 matrix and 150-µm resolution. As is evident, the SNR in the 1.5-T case was not sufficient for larger matrix size. c Magnified view of the inset in (a). d Magnified view of the inset in b
be such that a tolerable amount could be delivered to the target site. As such, targeted contrast agents possessing the combined properties of pathology detection and signal amplification have found a vital role to play in imaging based diagnosis and therapy.
10.1.1.1
Natural Biomarkers
Present MR techniques used for MS studies and to assess disease burden include MR spectroscopy (MRS) measurements identifying decreased N-acetyl aspartate (NAA), choline/NAA ratio, and creatine/NAA ratio. Other techniques include comparative brainstem analysis and probes of plaque demyelination, thalamic neuronal loss on MR images, tissue characterization by fMRI, MRI morphometry, cortical thickness, etc. The use of these natural biomarkers in multiple sclerosis (MS) has
shown potential for the quantification of abnormal accumulation of metabolites (Pan et al. 1996). Proton MRS studies have shown enhancement of these metabolites which might enable early detection and assessment of therapy.
10.1.1.2
Passive Targeting
It is possible to use the body’s natural defense mechanisms for passively targeting pathology. Gdchelate, iron oxide particles and all other blood pool agents are of this type and are handled by phagocytic cells removing these foreign particles from the body. Macrophages are among the most important components of the immune defense system and play a major role in clearance of particulate contrast media such as USPIO. The use of USPIO in achieving cellular imaging at 1.5 T has been reported (Oweida et al. 2004).

132
10.1.1.3
Active Targeting
Contrast agents have shown great success in detecting the breakdown of BBB and visualization of blood vessels. This has raised the hope of them being used as guided carriers with molecular accuracy (Bulte et al. 2004). The success of T1 and T2 contrast agents encouraged researchers to work to overcome the limitation of their site inspecificity. In the absence of selective localization of contrast agents in a specific region of the body their application will be restricted to the detection of permeable blood vessels. Within the past 10 years a wide range of research has demonstrated the ability to achieve targeting of pathology and delivery of contrast agents to their sites (Pirko et al. 2004). Efforts towards this goal have taken two distinct paths. On the one hand gadolinium contrast agents are developed for targeted imaging (Allen and MacRenaris 2004; Shahbazi-Gahrouei et al. 2001). On another front, iron oxide-based contrast agents such as USPIOs are developed for various pathology and delivery mechanism (Anderson et al. 2004; Arbab et al. 2004; Zelivyanskaya et al. 2003; Wood et al. 2004; Stoll et al. 2004; Artemov et al. 2003; Beckmann et al. 2003; Bendszus and Stoll
2003). This is combined with advances in coating of iron oxide nanoparticles of various sizes and the technology to increase their blood half-lives. In particular, in MS and cancer, their potential (Anderson et al. 2004; Weissleder 2002; Ray et al. 2004) to play a significant role in their diagnosis has already been demonstrated. Iron-oxide complexes whose size is within 10–100 nm are usually referred to as USPIOs. The coatings of these nanoparticles are designed to provide them with colloidal properties. The origin of iron oxide complexes as contrast agents refers back to when monocrystalline iron oxide nanoparticles, or MIONs, were first developed for this purpose (Weissleder et al. 1990). Each particle comprises about 1000 atoms of iron in a crystalline form wrapped with dextrin. When the dextrin is crosslinked, the particles are called CLIONS (cross-linked iron oxide nanoparticles).
Access to the brain at the cellular level is difficult. However,sampling biological events in the brain at molecular level would greatly enhance understanding of the neurodegenerative diseases. These diseases could be characterized as genomic disorders. Considering the progress in MI, degenerative diseases could potentially be directly imaged. This possibility is due to the availability to tag proteins involved in MS, Alzheimer disease (AD) and Huntington disease (HD). The com-
A. Kangarlu
mon feature among these diseases is their sensitivity to their amino acid packing order within the structure of the protein. In the case of damage or replacement of an amino acid within the protein structure the stability of the protein structure will be lost. This is the hallmark of these neurological diseases. Protemonomics study of the amino acids and the implications of their replacement in protein structure provide the basis for the development of techniques for tracking the activity site of the protein.
Design of various MI contrast agents or biomarkers is based on the difference between structure and function of the amino acid responsible for disability of the protein. In this regard, animal models play a critical role in the study of various neurological diseases. For MS, the most widely used animal model, experimental autoimmune encephalomyelitis (EAE), has been used for the delivery and imaging of demyelination sites (Ahrens et al. 1998; Dousset et al. 1999). In targeted EAE imaging studies T-cell or macrophages are magnetically labeled by tagging activated lymphocytes, which are the disease-inducing agent in the mouse model. The spinal cord and the brain images are shown to be affected immediately on clinical manifestation of the disease (Anderson et al. 2004). The significance of these studies is the demonstration of the feasibility and imaging of the activated agent (T-cells). Considering that these agents (T-cells) are the cause of EAE, this technique will provide insight into the mechanism of the disease process. Furthermore, Anderson et al. (2004) have demonstrated that cells are immunologically comparable to unlabeled active lymphocytes and the labeling technique has achieved the important objective of supply a large enough population of iron oxide (SPIO)/transfection agent to enable their in vivo MR detection. The high resolution images acquired with this technique in the mouse is a significant step forward in tagging, site-specific delivery, and imaging a group of cells directly involved in etiology of EAE.
In cancer, in vivo staging of brain tumors is the goal of MI. Here, differences in the genomic profiles of various brain tumor subtypes are used as the basis for targeted imaging. This will eventually lead to the development of a specific and more effective therapy (Gutin 2002; Tropres et al. 2004).
Incorporation of this approach to imaging will allow in vivo study of the biology of these diseases, MS, AD, HD and cancer, with the ability to acquire information on the structure and function at the cellular and molecular level. Such tools will help develop significant advances in treatment.

Molecular Imaging and High-Field MRI in Multiple Sclerosis |
133 |
10.1.2
Technical Issues of MRI in MI
10.1.2.1 Animal Studies
As noted, EAE is an animal model inducing inflammatory and demyelinating disease of the central nervous system (CNS). It is the widely accepted model for MS (Alvord et al. 1984). Genetically susceptible animal species are injected with proteins derived from the CNS in order to induce the disease. These proteins include proteolipid protein (PLP), myelin basic protein (MBP), and synthetic peptides emulsified in Freund’s adjuvant (CFA).
Histologically, EAE is characterized by a mononuclear cell infiltrate affecting the white matter by inducing demyelination. The white matter lesions are inflicted by T-cells, B-cells, and macrophages infiltrates. In addition, compromised BBB and edema are the primary characteristics of EAE lesions. In mice, the spinal cord is more extensively affected than the brain. Progression of the disease is accompanied by demyelination and axonal loss. The form taken by the two subtypes of the disease, acute or relapsing-remit- ting, is dependent upon the specific mouse model. As with other inflammatory processes, direct visualization by MRI is performed using techniques that are sensitive to edema and changes in diffusion, and contrast agents may be used to identify regions of BBB breakdown.
The challenges in direct visualization of myelin abnormalities in acute EAE are due to their spread far outside the MR-visible inflammatory lesions. This microdemyelination within normal appearing white matter (NAWM) could amount to an extensive cumulative loss of myelin proteins. Studies in acute EAE have shown that MR-visible demyelinated regions only account for less than a third of the immunocytochemically detected decrease in myelin protein expression (Kawczak et al. 1998). Thus, along with visible areas of demyelination a majority of abnormalities will manifest in more diffuse micro-demy- elination. This is demonstrated by the decreased staining in normal appearing white matter. To probe these microscopic abnormalities one must resort to techniques with microscopic resolution. This is truer in small animal models due to small lesion sizes. As such, high resolution is necessary to delineate EAE lesions and techniques in this area have not been extensively developed in vivo. EAE lesions have been visualized in the spinal cord using T2*-weighted MR microscopy (MRM) and diffusion-weighted imaging
(DWI) (Ahrens et al.1998).Ex vivo MR studies in the rat spinal cord (Lanens et al. 1994) and mouse spinal cord (Ahrens et al. 1998) show hyperintensities in white matter and meninges with T2 or T2* weighting that correspond to demyelinated inflammatory lesions on histology. Demyelination, remyelination, inflammation and edema are not specifically distinguished, though decreased diffusion anisotropy has been demonstrated in lesions as well, indicating loss of structural order in the white matter. Loss of order may be due to edema, myelin loss and or axonal loss. The gray-white matter boundary is ill-defined in the presence of lesion in both the mouse and rat. Inflammatory lesions may progress to a wide area of the white matter in advanced disease.
There are few in vivo routine and high resolution MRI studies of EAE in the mouse (Floris et al. 2004). Contrast enhancement of lesions from the brain parenchyma has been seen in T1and T2-weighted images in diseased mice and rats (Rausch et al. 2003). Other reports have shown that USPIO-enhanced images have detected EAE lesions with high sensitivity (Dousset et al. 1999). In these studies T2-weighted images and gadolin- ium-enhanced T1-weighted images showed poor sensitivity. Confirmation of the USPIO findings by histologic examination showing macrophages at the same sites as found by USPIO-enhanced images has validated specificity of this technique. Different aspects of iron based contrast are the subject of other studies to enhance its ability to identify lesions in the EAE mouse brain (Xu et al. 1998). USPIO and MION examine issues such as prolongation of blood half-life. These particles must both have a high blood half-life and be able to cross the disrupted BBB areas in EAE lesions. MION enhanced lesion conspicuity at areas of BBB disruption and enabled lesion detection has not been possible without contrast. In MRI corresponding to inflammatory and demyelinating lesions on histology, hypointense and hyperintense (possible T1 shortening or phase shift) areas have been seen.
10.1.2.2 Human Studies
Recent MRI studies on MS patients have also revealed subtle abnormalities of the central nervous system in NAWM, which is difficult for routine imaging to detect. These abnormalities involve microdemyelination and widespread membrane turnover that could precede the formation of inflammatory

134
lesions (Pan et al. 1996). Furthermore, the inflammatory cells, T-cells, B-cells and macrophages penetrate the CNS via an elusive mechanism whose understanding is an important step in unraveling the basis of the onset and progression of demyelination and forging therapeutic methods. MRI studies of MS have been able to measure myelin loss, and efforts to correlate that with the clinical manifestation of the disease have scored mixed results. What routine MRI lacks is the ability to monitor directly the pathologic processes in order to find the one specific for demyelination. In this regard, it appears that routine MRI techniques have reached a level of maturity for clinical MS studies. A wide range of well-optimized sequences have been brought into the clinical care of patients with MS. While these techniques have improved the quality of images and have accelerated the acquisition, the main contrast mechanisms of MR appear to be unable to definitively detect lesion evolution and determine disease subtype. Also, within the past decade the limits of SNR have been reached by the ever-improving technology incorporated in the new MRI scanners. This has led to a search for external agents to sensitize pathology for MR visualization.Among all the existing contrast enhanced imaging techniques for molecular detection of diseases MRI has many unique attributes. It has a better penetration depth than optical imaging, non-ionizing radiation in contrast to nuclear medicine and superior resolution versus PET and SPECT. As such, enhancement of MRI capabilities will play an important role in making MRbased MI a reality for pathophysiology studies and study of function in the brain of patients with MS.
10.1.2.2.1 Imaging Time
Compared to optical imaging and PET, MR images take longer to acquire. This difficulty, however, will be alleviated through many fast imaging techniques. Parallel imaging is one such technique in which multiple surface coils are used as arrays and their independent images are used to construct the final image. It has been shown that acceleration factors of up to 10 could be achieved, which proportionally reduces the imaging time (Pruesseman et al. 1999; Sodickson and Manning 1997). In addition, ultrashort echo time sequences, fast imaging sequences with innovative k-space filling techniques, and faster switching gradients will help reduce the acquisition time for MR studies to within ranges of other imaging techniques.
A. Kangarlu
10.1.2.2.2 Contrast
The MR signal from biological tissues carries useful information. This is largely due to the sensitivity of the proton resonance to its environment and the massive number of excess 1H protons for generation of bulk magnetization per imaging voxel. The contrast in MRI is the difference in SNR between two adjacent tissues.As such, if adjacent biological tissues produce nearly the same SNR the contrast will be poor. This condition does exist in the case of certain diseases. For the diseases in which structural or functional modification of the tissues has little MR implication the technique will not detect the pathology very sensitively. Contrast agents are used in these situations to deliver artificial contrast to the affected areas. As T1 contrast agents, macromolecules with the lanthanide ion gadolinium incorporated in their molecular structure have found many applications in detecting breakdown of the BBB. The paramagnetic field of these ions due to their unpaired electrons creates a fluctuating local magnetic field which enhances the relaxation of water protons. The coupling of these dipole–dipole interactions in tissue magnetization causes a decrease in T1. The characteristic relaxivity of these agents is proportional to the sixth power of the inverse of the distance. The theoretical basis of relaxivity caused by paramagnetic contrast agents is formulated by Solomon-Bloembergen-Morgan equations. Paramagnetic enhancement of nuclear relaxation rates is a function of magnetic field. In general there are longitudinal and transverse relaxation rate enhancements caused by contact and dipolar elec- tron–nucleus interactions. The lanthanides need to be chelated for safety and to achieve maximum water proton relaxivity. This achieves optimization of the water exchange rate and rotational correlation time. Lanthanides and transition metal ions like iron are suitable for use as contrast agents due to their relatively large magnetic moments and unpaired electrons. They are, however, toxic for use with human subjects. As such, appropriate ligands or chelates are used to cloak the metal ions and screen their toxicity.
10.1.2.2.3
Limits of Detection
There are a number of ways in which MRI can characterize structure and function of biological tissues. Relaxation mechanisms and tissue density are the primary ways that tissues are probed structurally.

Molecular Imaging and High-Field MRI in Multiple Sclerosis |
135 |
Physiological information acquired in MRI can be divided into two categories. A class of functional investigations of the brain involves MRS which detects metabolite concentrations. Another class of physiological measurements relies on the paramagnetic properties of blood. Here, perfusion, blood volume, blood flow, and the permeability of capillaries are accessible to MR experiments. These quantities are indirect measures of physiological events of the vasculature. The first order events are the blood magnetic properties which are directly assessed by MRI. Natural variation in the paramagnetic state of blood or blood oxygenation level dependence (BOLD) acts as an inherent contrast mechanism for blood/functional measurements. This is proven to be insufficient for the study of biological events at cellular or molecular level. As such, external agents are used to manipulate the CNR. This does not amplify the signal beyond the limits set by the magnetic field strength. The augmentation of the image is due to the rapid recovery of transverse magnetization as a result of the presence of large magnetic dipole of paramagnetic or superparamagnetic molecules. Accordingly, a measure of maximum detectable MR signal for medical scanners must be found in order to evaluate the limitations of MRI for attaining molecular and cellular resolution.
In order to gain insight into how contrast agents will enhance visualization of pathology one needs to know the fundamental SNR of MR signal from biological tissues. The limit of detection of routine MRI is a function of the magnetic field strength. This subject is analyzed at length in the next section. But as far as SNR effect on the feasibility of MI is concerned the following argument aims at understanding the fundamental limits against attaining imaging with molecular/cellular scale resolution.
To this end, an account of the resolution necessary for endogenous-contrast-based imaging is needed. The resolution of typical images acquired at 1.5 T for medical diagnosis has 1×1 mm2 with 5-mm slice thickness. As such the voxels represented on medical images have a volume of 5 ml. It is conceivable that the highest-field magnets feasible for human studies will operate at a field of 10 T.This will reduce the voxel size to about 50 nl. Considering the typical volume of human cell of about 1 nl there is a 100-fold deficit in endogenous resolution to attain cellular sensitivity. It must be noted, however, that susceptibility effects are capable of projecting the dephasing and signal loss beyond cellular dimensions. This does not amount to the amplification of the signal beyond the limits set by the magnetic field strength. This limit is gov-
erned by the Boltzmann distribution of the magnetic dipoles parallel and antiparallel with the static field. Based on these principles, at a field of 10 T, which is presently the limit for human magnets, only 10 protons for every million protons will participate in MR signal formation. In the absence of a photonic technique a large number of spins are required to make up a signal large enough to be detected by human MR scanners. As such, endogenous-contrast-based whole body imaging is unable to achieve single molecule detection. Thus, a significant augmentation of MR signal is required to overcome the fundamental limits against realization of human imaging at molecular level. Among various approaches the signal enhancement offered by MI is the most realistic and feasible.
10.1.3
State of the Art in MI of Animal Models in MS
EAE in rodents has been the workhorse of technique development for MS imaging research. While a valuable model, it has not been fully explored due to the difficulties involved with the techniques. It is conceivable that removal of these obstacles will greatly enhance the contribution this valuable tool could make to technique development of demyelination imaging. MI is one such approach for dealing with the technical difficulties of imaging EAE, and researchers have began exploring targeted imaging by using labeled T-cells for imaging in EAE mice (de Laquintane et al. 2002; Corot et al. 2004; Anderson et al. 2004).
In recent studies on EAE mice it has been shown that the labeled lymphocytes in the new lesion enable lesion visualization in addition to their own detection (‘t Hart et al. 2004). This is based on the presence of cells bearing contrast that are specific to a lesion site. MR visualization of EAE lesions in the cord, both directly, and indirectly, has been reported in the live mouse (Anderson et al. 2004) (Fig. 10.3). Considering the inflammatory processes, MRI can directly visualize EAE lesions using methods that are particularly sensitive to edema and changes in diffusion. Due to the general difficulty of detecting microscopic changes, contrast agents with the ability to cross a damaged BBB have also been used. Active targeting is now becoming available, beginning with a detection scheme based on cellular imaging of labeled cells in the lesion (Fig. 10.4).
The contrast from SPIO in the lymphocytes produces both a stronger effect and a larger area of hypointensity than the actual area containing the labeled cells, known as the blooming effect, from the