

Книги по МРТ КТ на английском языке / MR Imaging in White Matter Diseases of the Brain and Spinal Cord - K Sartor Massimo Filippi Nicola De Stefano Vincent Dou
.pdf52 |
J. C. McGowan |
note as the number of higher field clinical scanners continues to rise. However, it is possible with current technology to acquire FSE data at high field with careful choice of scan parameters (Fig. 4.13).
Susceptibility artifact has been observed to be mitigated by FSE imaging as opposed to conventional spin-echo.This may be related to the information that is incorporated into the image from the short echo phase encodes, presumably less affected by suscepti- bility-induced dephasing. One application where this observation is important is in post-surgical spine imaging, where metallic fragments can cause difficulty
in interpretation of conventional images.An example demonstrating the susceptibility advantage in the knee is provided in Fig. 4.14.
4.6
Echo-Planar Imaging
We have seen that acquiring more than one line of k-space from a single excitation pulse allows spinecho to become “fast spin-echo”. In a completely
a |
b |
c |
1.5 T |
4 T |
4 T |
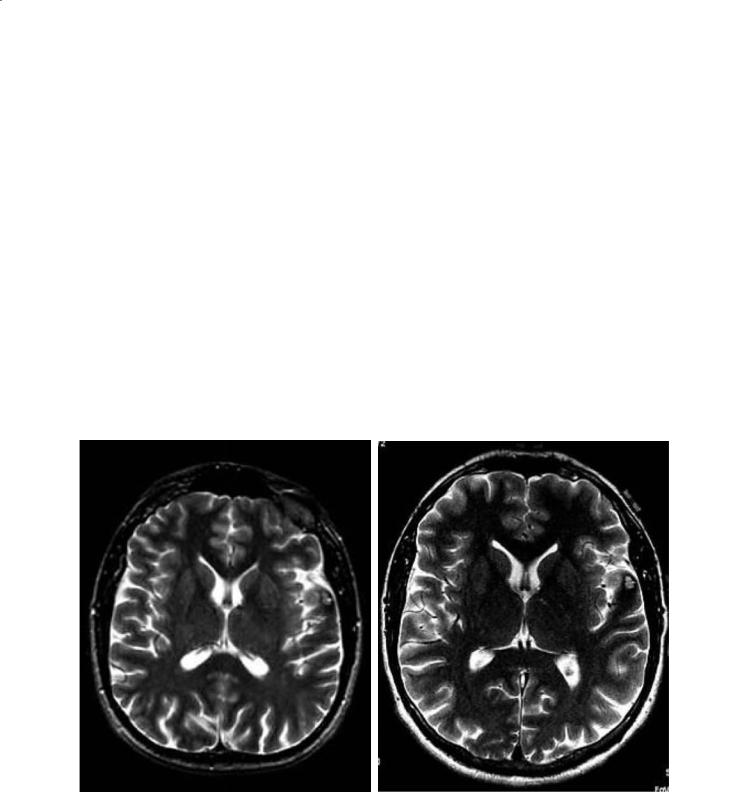
Fig. 4.13a–c. Imaging at high field in MS offers the potential for higher signal-to-noise ratio, better resolution and perhaps the detection of incipient MS lesions. A diagnostic scan at 1.5 T (a) is compared with a 4-T scan (b), also enlarged for clarity (c)
a |
b |
Fig. 4.134,b. Susceptibility artifact is mitigated by FSE (a) compared with conventional spin-echo imaging of the same knee. A surgical pin demonstrates a much more severe artifact in the conventional spin-echo image (b)

Fast Imaging with an Introduction to k-Space |
53 |
analogous manner, repeated gradient echoes can be refocused and obtained from a single excitation pulse resulting in so-called echo planar methods. As proposed in 1977 by Mansfield, the original echoplanar sequence was based upon a single excitation pulse (shot) and a zigzag trajectory through k-space brought about by the oscillation of one gradient (producing gradient-echoes) in the presence of a constant orthogonal gradient (Fig. 4.15).In current practice all similar techniques are referred to as EPI. A practical challenge with this technique is posed by the nonuniform coverage of k-space, but this is overcome by sophisticated reconstruction techniques. Other methods of covering k-space include the use of very rapid gradient switching (blipped gradients) to allow a k-space trajectory that is equivalent to spin-warp (at the cost of greater demands on system engineering). In yet another variation, spiral trajectories are achieved by oscillations of both x and y gradients at more reasonable speeds. This reduces the need for extremely rapid gradient switching at the cost of additional complexity in image reconstruction and sparser sampling of the higher k-space regions.
Echo-planar imaging (EPI) as originally implemented is the fastest of the fast techniques owing to its reliance on a single excitation and having no need for other rf pulses for refocusing. As a variation, the single excitation can be replaced by a spin-echo or by some other brief preparation of the magnetization. The EPI acquisition follows using all gradient-echoes and k-space is covered. Better quality can be obtained if necessary by performing two or more EPI acquisitions, with attendant linear increases in acquisition time.As with SSFSE,in single shot EPI the effective TR is infinitely long but the entire study is accomplished in just a few seconds. Contrast is characterized by T2* or by whatever magnetization preparation was employed. The most rapid echo-planar imaging is vulnerable to artifacts including significant blurring in the direction orthogonal to readout, as well as motion and susceptibility. These challenges may impose limitations on the brevity of the acquisition time.
4.7
Hybrid Techniques: GRASE
We have seen that all fast imaging techniques can be evaluated based upon the number of acquisitions and the number and type of refocusing rf pulses. In all cases it is possible to take more time to acquire the image in order to gain quality. In FSE one can incor-
RF
Gz
Gy
Gx
Fig. 4.15. Timing diagram example for echo planar imaging
porate more shots by acquiring less echoes per repetition period. The same is true in EPI. It is also possible to combine the techniques by, for example, incorporating a refocusing rf pulse into an EPI sequence in order to restore strength of signal. This is the basis of so-called GRASE (gradient-echo and spin-echo) and related techniques (Feinberg and Oshio 1991). All of the techniques can be viewed in light of their position on a 2D grid, with one axis assigned to the number of spin-echoes per shot (ranging from one to full k-space coverage) and the other axis assigned to the number of gradient-echoes per shot. Single shot techniques of FSE and EPI represent the maximum extent of the two axes, multi shot FSE and EPI occupy intermediate points on those axes, and hybrid techniques including GRASE can reside anywhere within the plane defined by the axes. It is reasonable to surmise that an optimal imaging protocol can be found on this grid for all possible constraints.
4.8
Burst Imaging
Burst imaging is another class of ultra-fast imaging methodology, based upon the generation of a series of spin (and stimulated) echoes. A single shot technique; it differs from those discussed above by the employment of a burst pulse originated as DANTE (delays alternating with nutations for tailored excitation). In this composite pulse a large number of evenly spaced, low flip-angle individual pulses are used. The basic pulse sequence is known as DUFIS (DANTE ultrafast imaging sequence) and employs the burst pulse given in the presence of a constant gradient (Hennig 1998). An inversion (180º) pulse follows to refocus (rephase) the transverse magnetization. Clearly, the train of excitation pulses creates a large number of echoes. However, as the spacing
54 |
J. C. McGowan |
of the pulses is constant, many of the echoes are superimposed upon one another. Reconstruction algorithms account for the phase imposed by the constant gradient and assign the data to the proper location in k-space. Burst imaging is among the most quiet of MR sequences as it does not require rapid gradient switching.
4.9
Parallel Imaging
There has been a great deal of recent development and interest in parallel imaging, achieved by simultaneously acquiring additional signals from coils arranged in an array around the tissue of interest (Sodickson and Manning 1997; Pruessman et al. 1999). Although parallel imaging is not based upon rapidity of acquisition, it deserves mention in this chapter because any increase in quality may be
“traded off” in an engineering sense to permit an increase in speed. Parallel imaging may be viewed as an evolution of the employment of phased array coils, such as those in common use to image long structures in the body (e.g.spinal cord).In pulse sequences that use these coils, each in turn acquires data from the area of the body in its vicinity. The reconstruction algorithm combines the data from coils to make a seamless image of the entire structure. Although there is overlap, it is generally true that each receive coil is “responsible” for a different part of the image. In contrast, parallel imaging uses multiple receive coils to provide simultaneous data on the same part of the anatomy, giving the benefit of a repeat study for averaging but taking effectively no more time. The reconstruction of this data into an image is challenging but has been accomplished using techniques known as SMASH and SENSE.An example of parallel imaging is given as Fig. 4.16 and was obtained using 12 signal processing channels and a purpose-built parallel imaging head coil with 12 coils.
a |
b |
Fig. 4.16a,b. Comparison of standard imaging (a) and parallel imaging (b)using a 12 channel head coil (courtesy E. Knopp, New York University)

Fast Imaging with an Introduction to k-Space |
55 |
4.10 |
References |
Conclusion |
|
Fast imaging is employed for much of the current clinical imaging in brain, offering the diagnostic power of long TE imaging, rapid acquisition times, and the ability to manipulate contrast as well as to tailor the study to the desired speed/quality compromise. An understanding of the essential parameters that define these techniques can enhance the ability of the physician to prescribe and interpret imaging studies. Novel scan sequences based upon FSE, EPI, and other techniques, coupled with continued advances in magnet and system technology, will continue to extend diagnostic capabilities.
Acknowledgments.
The author is grateful for magnetic resonance images provided by his clinical colleagues at the University of Pennsylvania, and in particular to Dr. Robert I. Grossman, friend and mentor.
Feinberg DA, Oshio K (1991) GRASE (gradientand spinecho) MR imaging: a new fast clinical imaging technique. Radiology 181:597–602
Hennig JHM (1998) Burst imaging. MAGMA 1:39-48
Hennig JNA, Friedburg H (1986) RARE imaging: a fast imaging method for clinical MR. Magn Reson Imag 3:823-833 Mansfield P (1977) Multi-planar image formation using NMR
spin echoes. J Phys C Solid State Phys 10:L55-L58 Pruessman KP, Weiger M, Sheidegger MB, Boesiger P (1999)
SENSE: sensitivity encoding for fast MRI. Magn Reson Med 42:952-962
Sodickson, DK, Manning WI (1997) Simultaneous acquisition of spatial harmonics (SMASH):fast imaging with radiofrequency coil arrays. Magn Reson Med 38:591-603

Magnetization Transfer |
57 |
5Magnetization Transfer
Joseph C. McGowan
CONTENTS
5.1Introduction 57
5.2Physical Basis 57
5.3 |
Magnetization Transfer Imaging 58 |
5.4 |
Analysis of Magnetization Transfer Images 59 |
5.5 |
The Inverse Problem 61 |
|
References 61 |
5.1 Introduction
One of several techniques that achieve contrast by preparing the magnetization in some way and then sampling the prepared magnetization via a conventional imaging sequence,magnetization transfer offers advantages that have proven valuable in the study of white matter disorders.In the most common implementation, the magnetization transfer preparation is integrated into a gradient echo pulse sequence, with a conventional gradient echo acquisition serving as a control study. The magnetization transfer (MT) effect can be expressed quantitatively and also evaluated using histogram measures.With the assumption of models for molecular behavior within tissue, fundamental relaxation parameters can theoretically be extracted by solving an inverse problem. Imaging sequences incorporating MT have proven to be relatively easy to implement and to interpret, and have become a common research tool for evaluation of brain disorders. This brief overview will lay out the fundamental assumptions regarding the MT model and will provide suggestions for implementation and analysis of MT studies.
5.2
Physical Basis
Conventional MRI techniques with relaxation-time weighting incorporate the implicit assumption that
J. C. McGowan, PhD
Associate Professor of Electrical Engineering, Department of Electrical Engineering, United States Naval Academy, Annapolis, MD 21405-5025, USA
a quantity of a particular tissue may be fully characterized by use of T1, T2, and proton density. For example, if a particular tissue appears hypointense relative to another on a T1-weighted image, the difference may be attributed to the former tissue having a longer T1. Since conventional MRI is not typically used (or designed) to provide quantitative measurements on an absolute scale,a region may be described as hypoor hyperintense without any conclusions being drawn about the magnitude of change in T1 that was responsible for the observation.
By comparison, the magnetization transfer (MT) model allows two (or more) components on the molecular level to each have their own relaxation parameters. This leads to the characterization of tissue with at least twice as many parameters as in the conventional MRI case. While in theory this represents an expansion in the ability to characterize tissue that is analogous to the advantage of MRI over X-ray, the full parameter space has yet to be exploited.What instead has arisen is a potentially novel contrast mechanism that can be used to make images reflecting in some way the exchange properties of magnetization between, in the limit, large and small molecules. Specifically, tissue is treated as a more complicated structure that includes not only protons in water molecules, but also bound-water protons associated with proteins and other large molecules. Since bound-water protons cannot be imaged directly via conventional means, the technique is constructed to sample them indirectly. In theory, advantage is taken of the wider frequency spectrum associated with short-T2 protons (bound water spins, macromolecular spins) that behave more solid-like when compared with protons of water. Thus, saturating radiofrequency energy is applied adjacent to, but not on, the resonance frequency of the free water protons. This tends to drive the short-T2 protons into saturation while leaving the free water protons untouched. A process of, most likely, cross relaxation, effectively “transfers” the magnetization of the saturated macromolecules to the free water protons. The effect of this transfer is seen as a reduction in available magnetization in the free water protons. Subsequent sampling of the free

58 |
J. C. McGowan |
water spin magnetization via any pulse sequence will elicit a relatively smaller signal. Translated into imaging terminology, regions where this mechanism are effective will be hypointense. A more rigorous treatment of this model and information on the foundation experiments of the technique may be found in the listed articles and reviews (McConnell 1958; Forsen and Hoffman 1963a,b, 1964; Edzes and Samulski 1977, 1978; McGowan 2001; Horská 1996).
The consequence of magnetization transfer in human MRI is that observed proton relaxation times may reflect not only the characteristics of free water protons,but also the characteristics of the macromolecular environment. MT analysis has been said to represent a window into the structure of tissue, and this idea has been borne out by studies relating MT observations to histopathology. The implementation of MT typically has included a control study, so that quantitative values can be obtained by comparing the two sets of images. MT analysis has been suggested to provide information complementary to T1, T2, and proton density.
5.3
Magnetization Transfer Imaging
Magnetic resonance imaging is based upon the supposition that rf excitation, applied off-resonance, exhibits a preferential saturation effect on the short-T2 macromolecules. The observed results of MT studies are consistent with this theory. The first reported study of MTI employed continuous rf excitation using a dedicated rf channel to saturate the macromolecular (bound) spins (Wolff and Balaban 1989), but subsequent experiments by Schnall and collaborators used the standard signal channel to excite the bound spins, as well as to perform the excitation required by the imaging pulse sequence (McGowan et al. 1994). Another approach was introduced and dubbed “on resonance” pulsed magnetization transfer (Hu et al. 1992). In this variant the effect of pulses applied at the proton resonance frequency is to leave the long T2 spins with magnetization intact while saturating the short T2 spins. This method can be shown to be equivalent via Fourier transform to the off-resonance approach,and can be shown to be equivalent to saturation at a certain off-resonance frequency (referred to as effective offset frequency). A theoretical treatment detailing off-resonance selective saturation has been provided (McGowan and Leigh 1994).
The above-listed experimental MT techniques all produce MT images where image intensity is reduced
in regions where the MT effect is significant.As noted, control images are also obtained so that a comparison may be made between the two. The ratio of intensities of these two images is a natural measurement, but the most common measure of the MT effect is actually that ratio subtracted from unity, known as the magnetization transfer ratio (MTR). This measure was introduced as a value that increased in magnitude with increasing MT effect (Dousset et al. 1992). Assuming that the saturation provided to the short T2 spins is perfectly selective, meaning that the equilibrium magnetization of the macromolecular spins is reduced to zero while the water spin magnetization is not directly affected, the water-spin magnetization will be maintained at a reduced value in the steady-state, during the pulse sequence. The decrease in magnetization will be larger in regions where the exchange of magnetization is more “efficient”, with efficiency potentially a function of one or more of the relaxation parameters that characterize either type of spin. In practice, selective saturation departs significantly from perfect selectivity in any pulsed experiments. However, rather than accept the additional complexity of adding a separate transmit channel to apply continuous wave rf energy, most researchers accept a smaller degree of saturation and rely upon an assumption that the behavior observed will be consistent with an equivalent continuous wave saturating power. Since the results of many experiments to date have been presented by comparison with controls, as relative differences between groups and individuals, this is a reasonable compromise.
It should be noted that contrast between areas exhibiting varying degrees of MT effect is developed and superimposed upon the intrinsic contrast of the baseline image. Thus the appearance of MT images is highly variable when the underlying images can be gradient echo, spin echo, or spin-echo with exogenous contrast. For quantitative study, many researchers have adopted gradient echo imaging as the control image, in order to superimpose the MT results on strictly proton density images. Magnetization transfer contrast is also used in a qualitative manner for applications including magnetic resonance angiography and as a means of enhancing contrast visibility when exogenous contrast agents are given. These techniques are successful because the MT effect is generally pronounced in relatively dense tissues and relatively ineffective in fluids. In MRA, tissue intensity is reduced while blood remains bright. In studies with exogenous contrast agents, incorporation of MT pulses into the imaging sequence can provide additional tissue suppression to allow the contrast-
Magnetization Transfer |
59 |
affected tissues to appear brighter. Appropriate control studies should be used in this case to ensure that the two independent effects are not confused. These applications of MT have been implemented on many commercial scanners and are used with both gradi- ent-echo and spin-echo pulse sequences.
As has been described here, the MT experiment nearly always includes its own control study. A difficulty may arise when trying to compare MTR numbers between different scanners, over time, or between sites. This arises in part because scanners have never been designed to produce “reproducible” absolute values of image intensity. Rather, they must be able to reproduce contrast differences in reference phantoms. Coil loading with varying filling factors with different size patients is just one of several variables that are compensated for by the automatic “prescan”functions of clinical scanners.When obtaining quantitative MT studies, it may be necessary to override some of the automatic adjustments in order to minimize the differences between acquisition of the MT and control images.
Scanner manufacturers have employed a variety of ways to effect the prescription of MT images with clinical software. Some use the concept of “flip angle” (although this may not have meaning in the context of the off-resonance excitation of macromolecular spins) as power. This flip angle is understood as related to the power that the scanner provides to the rf coil to produce, for example, a 90º flip angle in proton spins of water. This is meaningful as a relative measure of saturating power, but may be difficult to convert to conventional power units without detailed knowledge of the scanner software and hardware. Offset frequency is self-explan- atory when the pulse sequence incorporates pulsed offresonance MT excitation, less so when “on-resonance” pulses are used. To compare studies, the experimental parameters should match exactly, as any MTR is a strong function of the experimental parameters. The choice of effective offset frequency may be controver-
sial.The common wisdom is to avoid“direct saturation” of the water spins while still providing saturation to the macromolecular spins. In brief, this is unlikely to be achieved. There is no sharp line delineating the region of “direct saturation”. Rather, it is reasonable to assume that there is always some direct effect on the water spins and always some indirect effect on the macromolecular spins. Perhaps the best compromise in the prescription of the scanning protocol is to choose experimental parameters to maximize the contrast, or MTR difference, between tissues of interest.
Magnetization transfer images may be acquired with control images to obtain MTR values for each image location. Additional images may also be acquired in order to obtain additional data points for later application to the inverse problem of determining fundamental tissue relaxation and exchange parameters. The additional images will often be prescribed using a programmed variation of the effective offset frequency or the effective saturation power, or both. A series of images at constant power with variable offset frequency yields data that is often referred to as a Z-spectrum (Grad and Bryant 1990).
5.4
Analysis of Magnetization Transfer Images
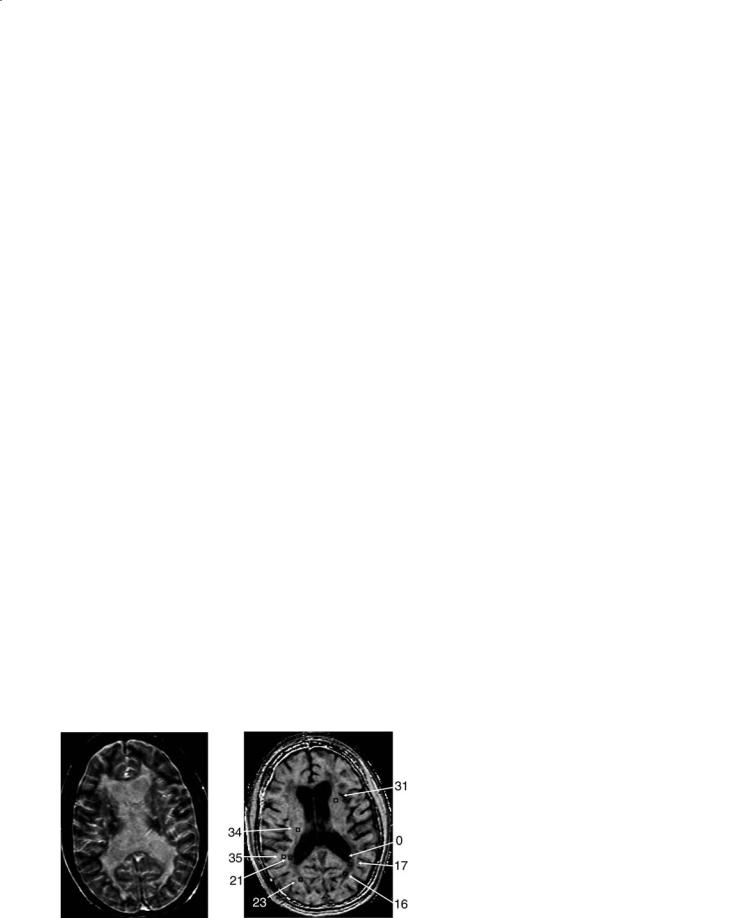
Images can be analyzed pixel-by-pixel or regions of interest (ROI) can be prescribed with the MTR calculated as an average of contained pixels. Most early MTR studies used ROI analysis as the calculation of individual pixel MTR values can be somewhat noisy. However, in some cases insight can be gained from MTR images constructed via pixel-by-pixel MTR calculation and if necessary ROI values can easily be obtained from those images. An example in MS demonstrating regions of interest is depicted in Fig. 5.1. Studies involving patients diagnosed with multiple
|
|
Fig. 5.1a,b. Magnetization transfer imaging in a |
|
|
patient with multiple sclerosis. a An image with |
|
|
MT contrast, where darker regions represent |
|
|
greater MT saturation effect. b The correspond- |
|
|
ing MT map, arrived at by normalizing the MT |
|
|
image using an image obtained without MT satu- |
|
|
ration, that is, by obtaining the MT ratio. Higher |
|
|
intensity corresponds to greater MTR on the MT |
|
|
map. Regions of interest are shown with regional |
a |
b |
average MT values depicted, demonstrating the |
range and variance of abnormal tissue in MS |
60 |
J. C. McGowan |
sclerosis (MS) have led to increased understanding of the disease and in particular of the nature of lesion evolution (Petrella et al. 1996; Hiehle et al. 1994).
In response to the recognition of the diffuse nature of MS, and the concept of diseased “normal appearing white matter”, McGowan and Grossman developed the MTR histogram which was applied by van Buchem et al in 1996 (van Buchem et al. 1996). This method of analysis was designed to be applicable to MS because it was responsive to the large scale variation of MTR in lesions as well as to the small scale variation in what was to be dubbed “normal appearing white matter.” A histogram is simply a graph depicting the number of pixels with a certain value of, in this case, MTR. The height of the histogram at any MTR value represents the frequency with which that value occurs in the underlying data.
The range of MTR values is divided into “bins” and the choice of bin size is important to the character of the histogram. Specifically, too-large bins tend to overly smooth the data and too-small bins provide a noisy appearance that masks the features within that are being sought. The optimum size is a function of the quality (signal-to-noise ratio) of the raw data. Figure 5.2 is the first comparison of MTR histograms, obtained from human subjects. Figure 5.3 shows a series of MTR histograms obtained in a rat spinal cord injury model and serves to identify some of the histogram parameters that may be studied and compared. MTR values have also been presented using a contour map technique (Fig. 5.4) and this showed promise for identification of patterns of abnormality that were consistent with pathology studies yet inapparent on conventional MRI (McGowan et al. 1999).
Voxels
a
10
8
6
4
2
0
0 |
10 |
20 |
30 |
40 |
50 |
|
|
|
MTR |
|
b |
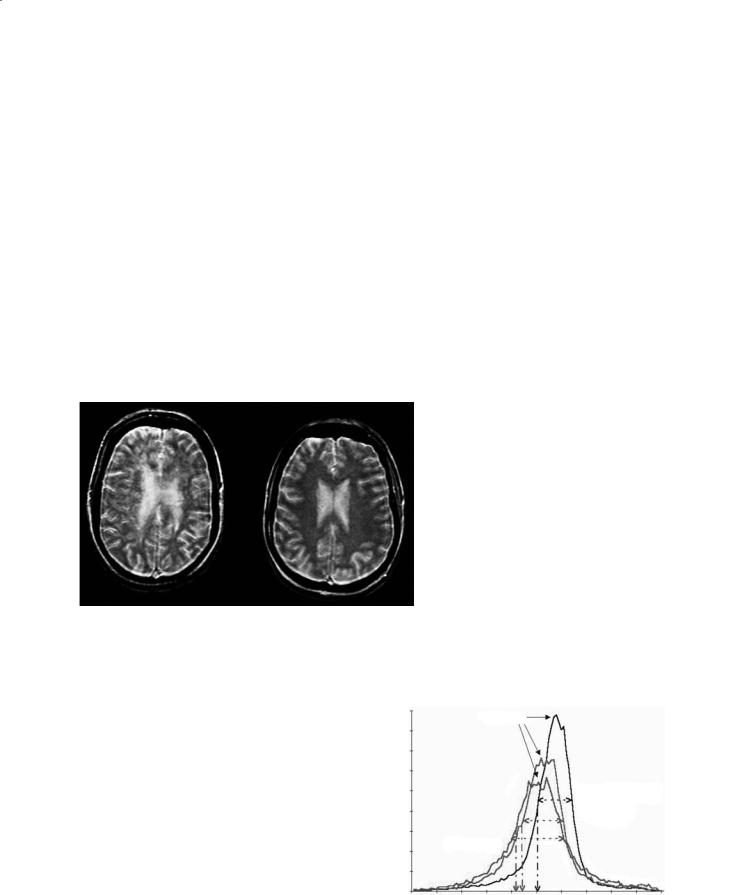
Fig. 5.2. a MT images obtained in a patient with MS (left) and a normal volunteer. b MT histogram corresponding to the images. A decrease and shift of the characteristic peak associated with white matter is seen
Fig. 5.3. MTR histograms in a rat spinal cord injury model, including an average control histogram and average histograms corresponding to weight-drop injuries with 2.5 and 15 cm drop-heights
Number of Pixels
1800
1600
1400
1200
1000
800
600
400
200
0
0
Peak Height
Width at half-height
25th Percentile
10 |
20 |
30 |
40 |
50 |
60 |
70 |
80 |
90 |
100 |
MTR (Percent)
Magnetization Transfer
a 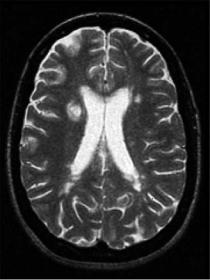
b 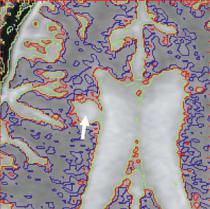
61
c
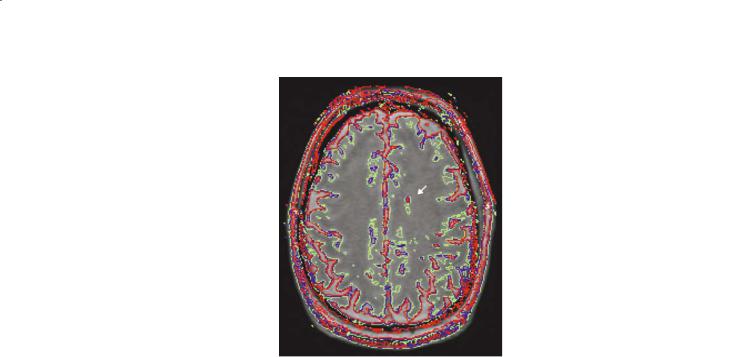
Fig. 5.4. a An example MTI image in multiple sclerosis with focal lesions in the periventricular white matter. b An MT contour plot demonstrates the gradation of MTR values from the low-MTR center of the large focal lesion (thick arrow) to the normal-appearing white matter. The contours are drawn at 2, 4, and 6 standard deviations (SD) below normal values as obtained from age-matched control subjects. A smaller lesion on the contralateral side is shown to be asymmetric with regard to MTR. c In another patient, a small focal MS lesion (red contours, 6 SD below normal MTR, arrow) is shown to be extended into normal-appearing tissue by MT contours at 2 SD below normal
5.5
The Inverse Problem
Some researchers have investigated models of increased complexity compared to the simple binary spin bath model discussed above. Impressive results have been obtained by treating the macromolecular fraction as characterized by other than Bloch equation (i.e., T1 and T2) behavior (Morrison et al. 1997; Li et al. 1997; Henkelman et al. 1993). Implementation of this assumption was achieved by substituting a Gaussian or superlorentzian line shape to describe the behavior of the macromolecular magnetization, where the Bloch equations would predict a lorentzian line shape. To pursue these models, additional data points must be gathered and the resulting Z- spectra fitted to appropriate line shapes. The results of fitting are model parameters including relaxation times associated with the macromolecular component and characteristic exchange (transfer) rates. The
time cost of these experiments is high, even though a single control study can be used for many values of effective offset frequency. When the studies are completed, however, results include images based upon one parameter of the MT model. Such images are being investigated in light of the potential clinical value of an additional MRI contrast parameter. Current studies also attempt to optimize the number of data points gathered with the aim of a reasonable study time for application to human subjects.
References
Dousset V, Grossman RI, Ramer KN et al (1992) Experimental allergic encephalomyelitis and multiple sclerosis: lesion characterization with magnetization transfer imaging (published erratum appears in Radiology 1992, 183:878). Radiology 182:483-491
Edzes HT, Samulski ET (1977) Cross relaxation and spin dif-

62
fusion in the proton NMR of hydrated collagen. Nature 265:521-523
Edzes HT, Samulski ET (1978) The measurement of crossrelaxation effects in the proton NMR spin-lattice relaxation of water in biological systems: hydrated collagen and muscle. J Magn Res 31:207-229
Forsen S, Hoffman R (1963a) A new method for the study of moderately rapid chemical exchange rates employing nuclear magnetic double resonance. Acta Chem Scand 17:1787-1788
Forsen S, Hoffman R (1963b) Study of moderately rapid chemical exchange reactions by means of nuclear magnetic double resonance. J Chem Phys 39:2892-2901
Forsen S,Hoffman R (1964) Exchange rates by nuclear magnetic multiple resonance. III. Exchange reactions in systems with several nonequivalent sites. J Chem Phys 40:1189-1196
Grad J, Bryant RG (1990) Nuclear magnetic cross-relaxation spectroscopy. J Magn Res 90:1-8
Henkelman RM, Huang X, Xiang Q, Stanisz GJ, Swanson S, Bronskill MJ (1993) Quantitative interpretation of magnetization transfer. Magn Reson Med 29:759-766
Hiehle JFJ, Lenkinski RE, Grossman RI et al (1994) Correlation of spectroscopy and magnetization transfer imaging in the evaluation of demyelinating lesions and normal appearing white matter in multiple sclerosis. Magn Reson Med 32:285-293
Horská A (1996) SRGS. Measurement of spin-lattice relaxation times and kinetic rate constants in rat muscle using progressive partial saturation and steady-state saturation transfer. Magn Reson Med 36:232-240
Hu BS, Conolly SM, Wright GA, Nishimura DG, Macovski A (1992) Pulsed saturation transfer contrast. Magn Reson Med 26:231-240
Li JG, Graham SJ, Henkelman RM (1997) A flexible magnetiza-
J. C. McGowan
tion transfer line shape derived from tissue experimental data. Magn Reson Med 37:866-871
McConnell HM (1958) Reaction rates by nuclear magnetic resonance. J Chem Phys 28:430-431
McGowan JC, Leigh JS Jr (1994) Selective saturation in magnetization transfer experiments. Magn Reson Med 32:517522
McGowan JC, Schnall MD, Leigh JS (1994) Magnetization transfer imaging with pulsed off-resonance saturation: contrast variation with saturation duty cycle. J Magn Res 4:79-82
McGowan JC, McCormack TM, Grossman R et al (1999) Diffuse axonal pathology detected with magnetization transfer imaging following brain injury in the pig. Magn Reson Med 41:727-733
McGowan JC (2001) Magnetic resonance imaging and magnetization transfer. Academic, New York (Advances in imaging and electron physics, vol 118)
Morrison C, Stanisz G, Henkelman RM (1995) Modeling magnetization transfer for biological-like systems using a semisolid pool with a super-Lorentzian lineshape and dipolar reservoir. J Magn Reson Ser B 108:103-113
Petrella JR, Grossman RI, McGowan JC, Campbell G, Cohen JA (1996) Multiple sclerosis lesions: relationship between MR enhancement pattern and magnetization transfer effect. AJNR Am J Neuroradiol 17:1041-1049
Van Buchem MA, McGowan JC, Kolson DL, Polansky M, Grossman RI (1996) Quantitative volumetric magnetization transfer analysis in multiple sclerosis: estimation of macroscopic and microscopic disease burden. Magn Reson Med 36:632-636
Wolff SD, Balaban RS (1989) Magnetization transfer contrast (MTC) and tissue water proton relaxation in vivo. Magn Reson Med 10:135-144