

Schluesseltech_39 (1)
.pdf2.8 |
|
|
|
|
J. Voigt |
|
Reaction |
Energy (GeV) |
Neutron yield |
Deposited heat (MeV) |
|
|
|
per event |
per event |
per neutron |
|
|
(T,d) fusion |
|
1 |
3 |
|
|
235U fission |
|
1 |
180 |
|
|
Pb spallation |
1 |
20 |
23 |
|
|
238U spallation |
1 |
40 |
50 |
|
Table 2.1: Comparison of neutron producing reactions
2.3How do we make free neutrons useful?
The neutrons as the are released from the nucleus have energies in the MeV range corresponding to a wavelength according to eq. (2.10) λ ≈ 10−5 A˚ . The energies we are interested in solid state physics, chemistry or biology rather range from the μeV range for relaxation phenomena to the eV range for the bonding of the valence electrons in molecules. One my also compare the energy scale to the corresponding temperatures via
Etherm = kBT. |
(2.11) |
From here we see that 1 meV is equivalent to a temperature of 11.6 K or vice versa 300 K are equivalent to 25.6 meV.
The distances we want to resolve in a neutron scattering experiment are on a atomic or molecular length scale and range from 1 A˚ to 1μm and therefore the neutrons should have comparable wavelength to have an appropriate resolution. If we use again the expression for the de Broglie wavelength eq. (2.10), we find that a neutron with an energy E = 25.6 meV has a wavelength λ = 1.8 A,˚ fulfilling both requirements simultaneously. This is also the reason, why neutron scattering is so versatile for studies of the dynamics of crystalline materials, because all atoms in a crystal show coherent motions due to their arrangement and bonding.
How can the neutrons now slowed down to the energies we are interested in? The best way is, if they collide elastically with other partners of much lower energy and spread this energy in a large volume ( don’t forget, that 1 MeV= 1.6 × 10⁻¹³ J). The energy loss per collision depends on the mass of the colliding partners: The highest energy transfer is achieved, if the mass of both partners is equal. Therefore 1H or 2H are the best partners, making water an ideal choice for the moderator. Since protons like to react with neutrons, the moderator often contains heavy water, i.e. D2O, which has a smaller absorption cross section. For the FRM II the reactor core is surrounded by the heavy water tank. The outer area of the water tank is filled with light water, hence the flux of neutrons hitting the biological shielding outside the tank is already reduced.
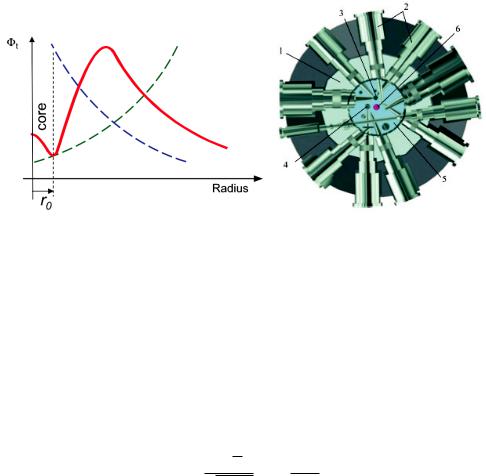
Typically it takes several μs to moderate the neutron to the temperature of the surrounding water. This process is therefore called thermalization. Within this time the neutron travel away from the reactor core, where they are produced. On the other hand, there is a finite probability for the absorption of a neutron, if the flight path inside the water is too long. The maximum of the thermal neutron flux density is displaced from the reactor core with the fuel element by 10 to 15 cm, as shown in Fig. 2.5 a).
For an experiment it is now of main interest to collect as many useful neutrons from the reactor, but not to get the fast neutrons or the Γ radiation that are created in the nuclear reactions into the
Neutron Sources |
2.9 |
a) |
b) |
Fig. 2.5: a) Radial distribution of the thermal neutron flux density in the reactor vessel. The green line indicates the distribution, where the full thermalization is reached, the blue line indicates that the absorption decreases the neutron flux. b) Schematic of the reactor vessel of the FRM II showing the reactor core and the beam tubes extracting the neutrons to the experiments. The reactor tank with internal diameter approx. 5m is filled with light water (1). In the centre of the arrangement the reactor core is situated. The experimental installations as horizontal beam tubes (2), a cold (3) and a hot (4) neutron source are arranged in the heavy water tank (5) around the fuel element (6).
experimental area. Therefore the beam tubes, as indicated in Fig. 2.5 b) don’t face the reactor core , but tangentially look onto the maximum of the thermal flux distribution.
In the end of the thermalization process the neutrons are in thermal equilibrium with the surrounding medium. The energy distribution takes the form of the Maxwellian distribution:
√
Φ(E) = √2 E (2.12)
πk3TM
The neutrons are commonly classified for certain energy and wavelength ranges according to the position of the maximum of the Maxwell distribution for a given moderator temperature
TM :
|
Energy range(meV) |
|
˚ |
|
Wavelength range (A) |
||
Ultra cold |
E < 0.0005 |
|
λ > 400 |
Very cold |
0.0005 < E < 0.005 |
40 |
< λ < 400 |
Cold |
0.05 < E < 5 |
4 |
< λ < 40 |
Thermal |
5 < E < 100 |
0.9 < λ < 4 |
|
Hot |
100 < E < 1000 |
0.3 < λ < 0.9 |
|
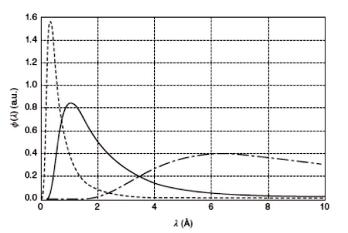
To access the respective energy range the moderator should again effectively moderate the neutrons but also be transparent for the neutrons. A liquid hydrogen vessel fulfills the requirements for cold neutrons. A more effective but also more difficult technique employs solid methan as a moderator. A carbon block heated to a temperature above 1000 K is used in reactors to provide an intense source of hot neutrons. In Fig. 2.6 the spectra for the different moderator temperatures show clearly, that the maximum is shifted towards shorter wavelength, when
2.10 |
J. Voigt |
Fig. 2.6: Neutron wavelength distribution for different moderator temperatures.Cold spectrum, T = 50 K, dot dashed line, thermal spectrum, T = 300 K, solid line, hot spectrum, T = 1000 K, dashed line.
the temperature is increased. In a spallation source usually a different route is used to yield an intense beam of hot neutrons: The moderator is made thin enough to not fully moderate the neutrons. Therefore epithermal neutrons still exist in the energy distribution of the source. The time structure of the source might then be used to discriminate the eventually increased background.
2.4How do we bring the neutrons to the experiment?
The angular distribution of the thermal flux distribution at the end of the thermalization process is fully isotropic. To calculate the flux at the exit of a beam tube approximately one has to divide the thermal flux at the maximum by the surface area of the sphere with the respective radius, in the case of the FRM II 2.5 m, see Fig. 2.5 b). Already at this distance the flux is reduced already by 6 orders of magnitude. If the distance required to build an actual instrument is added, the flux is lowered by 8 orders of magnitude.
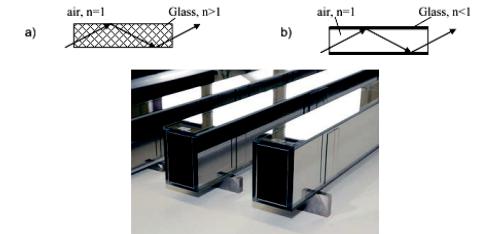
To overcome this problem, neutron guides are used. These consist of 4 neutron mirrors, enclosing the flight path of a neutron. The principle of the neutron guide is similar to light wave guides: External total reflections prevents the neutrons from leaving the guide and they are transported to the end of the guide. In the case of the light wave guide, the fibre has a larger index of refraction than the surrounding air, giving rise to typical critical angles θC ≈ 45◦. For the neutron guide, the vacuum inside has a larger index of refraction and the critical angle is given by
θC = λ |
|
|
|
(2.13) |
2 |
π c |
|||
|
|
|
ρb |
|
with the particle density ρ and the coherent scattering length bc. The element with the largest critical angle is Nickel and for the element the critical angle can simply be approximated θC = 0.1◦A˚ −1. If we install such a neutron guide behind a beam tube, all neutrons, that impinge on the Ni surface under a shallower angle than the critical angle, will be guided to the instrument. If we calculate for λ = 5 A˚ neutrons we loose only 4 orders of magnitude independent of
Neutron Sources |
2.11 |
c)
Fig. 2.7: a) Schematic of a light wave guide. External total reflection occurs, because the fibre is optically denser than the air. b) Schematic of a neutron guide. Total reflection occurs, because the index of refraction of the mirror coating is smaller than 1. c) Picture of a super mirror neutron guide, taken from www.swissneutronics.ch.
the distance from the reactor core. Hence such a neutron guide can be used to provide more space for instruments by going further away from the reactor. Nowadays so called supermirrors consisting of thin layers of e.g. Ni and Ti increase the critical angle of Ni by a factor up to 7. In that case it becomes possible to build neutron guides not only for cold neutrons but also for thermal neutrons. Furthermore complex focusing optics can be realized by neutron guides to increase the number of useful neutrons at the spectrometer and simultaneously keep the background low
At least as important as gaining space is the fact, that the direct sight from the instrument onto the reactor core can be omitted. Fast neutrons and Γ radiation is leaving through the holes for the neutron beamlines. They go mainly in a straight line from where they have been created, because their scattering cross section is very small. These particles contribute mainly to the radiation background around the instruments. They can of course also contribute to the background in your detector. The particles are kept away from users and detectors by massive shielding, containing a lot of concrete (for fast neutrons) or lead (for Γ radiation). If such a neutron guide is bend with a large radius, the direct line of sight hits the wall of the neutron guide and the background of the instrument can be further suppressed. Of course your shielding must then be strongest in the direct line of sight.
2.5 How do we detect neutrons?
On of the strongest advantages of the neutrons is their neutrality. It allows to probe deeply into matter. On the other hand, this makes the detection of the neutrons difficult, as it penetrates large volumes of matter without interaction. Luckily there exists a hand full of isotopes that have a large absorption cross section for thermal or cold neutrons, such as 3He 10B, Gd or 235U.
2.12 |
J. Voigt |
The nuclear reactions create charged particles, which can be analyzed by interaction with the electric fields. Since the absorption cross section in the thermal to cold energy range increases more or less linearly with the wavelength, the detection of cold neutrons is more effective than the absorption of thermal neutrons
One type of detector is the gas proportional counter filled either with 3He gas or gaseous 10BF3. The absorption process releases a certain number of photons, which create secondary electrons by Compton scattering or the photo effect, or high energetic charged particles. The particles are accelerated onto the cathode or anode according to their charge and the resulting current can be related to the neutron absorption event. A refinement of the apparatus allows also the localization of the absorption event yielding a position sensitive detector. Features of the gas proportional counter are a high detection probability, which can be tuned by the filling pressure, and a low sensitivity to Γ radiation. Disadvantages are a limited count rate before the detector saturates and a position sensitivity > 1 cm.
A szintillation detector provides a much higher spatial resolution. Here the neutron absorption at a neutron absorber embedded in the solid szintillation material yields Γ photons that are detected by the photo electric effect. This detectors provides a higher spatial and timing resolution but has also a larger Γ sensitivity.
2.6The take home messages
Today, intense neutron beams are available a nuclear research reactors and spallation sources. Reactors deliver a very stable continuous beam, while spallation sources provide a very high peak flux that can be effectively used by time-of-flight methods.
Neutrons are extremely useful for condensed matter research, if the wavelength and kinetic energy match the length scale and energy scale of e.g. magnetic compounds, polymers or biological samples. These is realized by moderating the fast neutrons released in the nuclear reaction in a volume containing a lot light elements, e.g. water for thermal neutrons, liquid hydrogen or solid methan for cold neutrons or heated graphite for hot neutrons.
Neutron guides are used to transport neutrons with only small losses quite far away from the actual neutron source. This gives more space for instruments, improves the background conditions and may even be used to tailor the neutron beam properties using complex optics similar to light optics.
Further reading
1.G.R. Bauer (1993) Neutron sources. In: A.Furrer (ed.) Neutron Scattering, pp. 331–357. PSI-Proceedings No. 93-01, ISSN 1019-6447, Paul Scherrer Institute, Villigen.
2.J.M. Carpenter and W.B. Yelon (1986) Neutron sources. In: K. Skold¨ and D.L. Price (eds.) Methods of Experimental Physics, vol. 23A, pp. 99196. London: Academic Press.
3.K. Clausen (2001) Neutron sources. Office for Official Publications of the European Communities, Luxembourg, ISBN 92-894-0037-4.
Neutron Sources |
2.13 |
4.Utsuro, Masahiko and Ignatovich, Vladimir, Handbook of Neutron Optics. ISBN-13: 978-3-527-40885-6 - Wiley-VCH, Berlin.
2.14 |
J. Voigt |
Exercises
E2.1 How are neutrons characterized?*
Write down the kinetic energy of a free neutron as a function of its momentum!
What is the velocity in ms−1 and energy in meV of neutrons with a wavelength λ = 1, 1.8, 5 A,˚ respectively?
mn = 1.675 × 10⁻²⁷kg h = 6.626 × 10⁻³⁴Js e = 1.602 × 10⁻¹⁹As
E2.2 How many neutrons are produced?**
Calculate the neutron flux density of a 20 MW reactor, assuming that the flux maximum is displaced 10 cm from a point-like reactor core! What would be the flux density of a hypothetical spallation source with the same thermal power?
E2.3 How do the neutrons come to your experiment?
Why is the neutron flux reduced, when you build the diffractometer/spectrometer at larger distance without a neutron transport system? When is it advantageous to have the instrument close to the neutron source? What reasons can you imagine to separate the instrument from the neutron source?
3Symmetry of Crystals
G. Heger
RWTH Aachen
Contents |
|
|
3.1 |
Introduction.............................................................................................. |
2 |
3.2 |
Crystal lattices .......................................................................................... |
2 |
3.3 |
Crystallographic coordinate systems ..................................................... |
4 |
3.4 |
Crystallographic symmetry operations and symmetry elements....... |
7 |
3.5 |
Crystallographic point groups and space groups ............................... |
10 |
3.6Example of the crystal structure description of YBa2Cu3O7-4 using
the ITA .................................................................................................... |
14 |
Exercises............................................................................................................ |
19 |
________________________
Lecture Notes of the JCNS Laboratory Course Neutron Scattering (Forschungszentrum Jülich, 2011, all rights reserved)
3.2 |
G. Heger |
3.1 Introduction
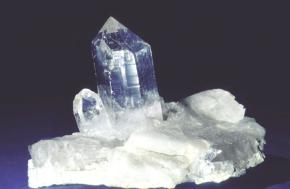
The term “crystal” comes from the Greek 565which was first used as description of ice and later on - more general - of transparent minerals with regular morphology (regular crystal faces and edges).
Fig. 3.1: Example: rock crystal – quartz (SiO2), mineral from the Gotthard-Massif.
Matter is usually classified into three states: gaseous – liquid – solid. Crystals are representatives of the solid state. Crystalline solids are thermodynamically stable in contrast to glasses and are characterised by a regular three-dimensional periodic arrangement of atoms (ions, molecules) in space.
3.2 Crystal lattices
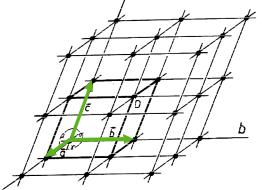
The three-dimensional periodicity of crystals can be represented by the so-called crystal lattice. The repeat unit in form of a parallelepiped - known as the unit cell – is defined by 3 non-linear basis vectors a1, a2, and a3, whose directions form the reference axes X, Y, and Z of the corresponding right-handed crystallographic coordination system. The 6 lattice parameters are given as the lengths of the basis vectors a = !a1!, b = !a2!, c = !a3! and the angles between the basis vectors: angle (a1,a2) = 7, angle (a2,a3) = 8, angle (a3,a1) = . The faces of the unit cell are named as face (a1,a2) = C, face (a2,a3) = A, face (a3,a1) = B.
If the vertices of all repeat units (unit cells) are replaced by points, there results the crystal lattice in the form of a point lattice. Each lattice point is given by a vector a = ua1+va2+wa3, with u, v, w being integers. As a symmetry operation of parallel displacement, a – also known as translation vector – maps the atomic arrangement of the crystal (crystal structure) onto itself.
Symmetry of Crystals |
3.3 |
||||||
|
|
|
|
|
|
|
|
|
|
|
|
|
|
|
|
|
|
|
|
|
|
|
|
|
|
|
|
|
|
|
|
|
|
|
|
|
|
|
|
|
|
|
|
|
|
|
|
|
|
|
|
|
|
|
|
|
|
|
|
|
|
|
|
Fig. 3.2: Notation for a unit cell and a point lattice.
A lattice point is named “uvw”, according to the coefficients (integers) of the translation vector a = ua1+va2+wa3 from the origin to the lattice point. A lattice direction - given by the symbol [uvw] - is defined by the direction of the corresponding translation vector.
A plane passing through three lattice points is known as a lattice plane. Since all lattice points are equivalent (by translation symmetry) there will be infinitely many parallel planes passing through all the other points of the lattice. Such a set of equally spaced planes is known as a set of lattice planes. If the first plane from the origin of a set of lattice planes makes intercepts a/h, b/k, c/l on the X, Y, Z axes, respectively, where h, k, l are integers, then the Miller indices of this set of lattice planes are (hkl), the three factors h, k, l being enclosed in parentheses.
The equation of lattice planes can be written in intercept form as
(hx/a) + (ky/b) + (lz/c) = n, |
(3.1) |
where n is an integer. If n = 0 the lattice plane passes through the origin; if n = 1 the plane makes intercepts a/h, b/k, c/l on the X, Y, Z axes respectively; if n = 2 the intercepts are 2a/h, 2b/k, 2c/l; and so on.
The line of intersection of any two non-parallel lattice planes is a row of lattice-points common to both planes. This lattice point row defines a lattice direction [uvw] which is known as zone axis. All lattice planes intersecting in a common lattice-point row are said to lie in the same zone. The condition for lattice planes to be parallel to a lattice vector a = ua1+va2+wa3 is the zone equation
uh + vk + wl = 0 |
(3.2) |
The zone axis symbol [uvw] for the zone containing the two planes (h1k1l1) and (h2k2l2) is obtained by solving the simultaneous equations uh1 + vk1 + wl1 = 0 and uh2 + vk2 + wl2 = 0,
[uvw] = [k1l2-k2l1, l1h2-l2h1, h1k2-h2k1] |
(3.3) |