This has an influence on the index of refraction, on the total reflection angle, and of course on the reflectivity, which is a function of the change of the index of refraction at a certain interface. Fig. 10.5 shows schematically the splitting of the total reflection angle.
In case that the magnetization is not fully aligned with the field, the component along the field direction influences the scattering length density for NSF. The in-plane magnetization component perpendicular to the field induces a spin-flip (SF) interaction that is equally strong for both spin-flip channels +– and –+, as is described in the last term of eq. (10.5) or (10.4), respectively.
Specular reflectivity of polarized neutrons is not sensitive to any magnetization component perpendicular to the layer plane. This is in agreement with the statement in lecture 7 (eq. (7.17) ff.) that only the magnetization component M perpendicular to Q contributes to the magnetic interaction with the neutron’s spin.
As en example, I would like to show the polarized neutron reflectivity of a [Co / Cu] multilayer. The respective nuclear and magnetic scattering length densities are
Co: N = 2.30 ·10-6 |
Å-2 |
M = 4.24 ·10-6 Å-2 |
Cu: N = 6.53 ·10-6 Å-2 |
M = 0. |
Obviously, the sum of the magnetic and the nuclear scattering length density of Co is almost equal to the scattering length density of Cu. In the case of magnetic saturation, spin + neutrons will not feel any contrast at the Co / Cu interfaces because they see the sum of nuclear and magnetic scattering length density in the Co layer. The multilayer structure is invisible for spin + neutrons. In contrast, spin – neutrons experience the difference of nuclear and magnetic scattering length density (which is in fact negative), so that the contrast is huge.
Fig. 10.6 makes the contrast situation visible by using colours representing the different scattering length densities.
•••
Co
Cu
Co
Cu
Co
•••
nuclear scattering length density
|
M |
|
|
M |
|
|
|
|
|
|
|
|
|
|
|
|
|
|
|
|
|
|
M |
|
|
|
M |
|
|
|
|
|
|
|
|
|
|
|
••• |
|
••• |
nuclear + magnetic. |
nuclear – magnetic |
sc. length. density |
sc. length density |
Fig. 10.6: The contrast between Co and Cu depends on the magnetization state. It almost vanishes for spin up neutrons, but is strong for spin down.
Magnetic Nanostructures |
10.9 |
|
10000 |
|
|
|
|
|
|
R++ |
|
|
|
|
|
|
|
|
|
|
|
|
|
|
|
|
|
|
R - - |
|
|
1000 |
|
|
|
|
|
|
|
|
in 52 s |
100 |
|
|
|
|
|
|
|
|
Intensity |
10 |
|
|
|
|
|
|
|
|
|
|
|
|
|
|
|
|
|
|
1 |
|
|
|
|
|
|
|
|
|
0 |
1 |
2 |
3 |
4 |
5 |
6 |
7 |
8 |
|
|
|
|
|
2 [°] |
|
|
|
|
Fig. 10.7: Specular reflectivity of polarized neutrons from a [Co/Cu] multilayer with 20 periods at magnetic saturation
Fig. 10.7 shows the measured polarized neutron reflectivity of such a multilayer. The total reflection edge is identical for both spin channels, because the biggest scattering length density in the layered structure is the one of Cu, which is not magnetic. But the multilayer Bragg peaks at 2 = 3° and 2 = 6° are strongly spin split. For spin – neutrons, the Bragg peak is about 30 times stronger than for spin + neutrons. Here, one can see that the contrast is responsible for the reflectivity, not the strength of the scattering potential, as the scattering length density (which describes the scattering potential) is higher for spin +, but the contrast between the layers is much stronger for spin –.
10.4 Layer-by-layer magnetometry
One important application of polarized neutron reflectometry with polarization analysis is layer-by-layer magnetometry. As an example, I present the magnetization evolution in exchange bias multilayers of the type [IrMn / CoFe]N with the number of periods [7]. The exchange bias effect is the coupling between a ferromagnetic layer and a neighbouring antiferromagnetic layer. If the antiferromagnet has been cooled below its Néel temperature with the ferromagnet being saturated, it conserves the interface magnetization without being sensitive to the applied magnetic field. This induces an additional unidirectional anisotropy on the ferromagnetic layer, i.e. the original magnetization direction is preferred over all others. The hysteresis loop is shifted away from H = 0.
0.003 |
Hex~860 Oe |
|
|
|
|
0.002 |
|
|
|
|
|
|
|
|
|
|
0.001 |
|
|
|
|
|
|
0.000 |
|
|
|
|
N=10 |
|
-0.001 |
|
|
|
|
|
|
|
|
|
|
|
-0.002 |
|
|
|
|
|
|
-0.003 |
|
|
|
|
|
|
0.0012-0.3 |
-0.2 |
-0.1 |
0.0 |
0.1 |
0.2 |
0.3 |
0.0008 |
|
|
|
|
|
|
0.0000 |
|
|
|
|
|
|
-0.0004 |
|
|
|
|
N=3 |
|
-0.0008 |
|
|
|
|
|
|
-0.0012 |
|
|
|
|
|
|
-0.3 |
-0.2 |
-0.1 |
0.0 |
0.1 |
0.2 |
0.3 |
0.0008 |
|
|
|
|
|
|
0.0004 |
|
|
|
|
|
|
Hex~330 Oe
0.0000

 N=1
N=1
-0.0004
-0.0008
-0.3 -0.2 -0.1 0.0 0.1 0.2 0.3
Field (Tesla)
Fig. 10.8: SQUID magnetization measurements (at room temperature, left) and AFM micrographs of the surface (right) of polycrystalline multilayers of the type SiO2 / 10 nm NiFe / [5 nm IrMn / 3 nm CoFe]N with N = 1, 3, or 10, resp.
The green curve in Fig. 10.8 shows the exchange biased magnetization curve of a IrMn / CoFe double layer shifted left together with the magnetization loop of the NiFe buffer layer, which is not affected by exchange bias and therefore symmetric around H = 0 field. The CoFe layer shows a nice square hysteresis loop, indicating spontaneous magnetization flip at the coercive field.
Strangely, the shape of the magnetization loop of the exchange biased CoFe layers changes, when the number of [IrMn / CoFe]N bilayers is increased. In addition, the strength of the exchange bias is increased. An AFM study of the surfaces shows that the grain size of the polycrystalline layers is reduced from layer to layer during the preparation procedure, but no information could be found that justifies the slope of the magnetization curves and that could eventually explain the origin of a magnetization rotation process responsible for the gradual evolution of the magnetization as a function of the applied field.
Therefore, a polarized neutron reflectivity study was performed, to investigate the individual behaviour of the ferromagnetic layers in the multilayer structure. As an example, Fig. 10.9 shows the specular polarized neutron reflectivity at one of the coercive fields (i.e. the net magnetization vanishes) together with the fit.
Magnetic Nanostructures |
10.11 |
Fig. 10.9: Polarized neutron reflectivity of the sample with N=10 at 0H = -0.1 mT after positive saturation
The polarized neutron measurement shows no spin flip signal at all, immediately excluding the idea of a magnetization rotation process. Furthermore, the fit of the measured data shows that the magnetization of the upper 5 CoFe layers is aligned antiparallel to the field while the magnetization of the lower 5 CoFe layers is still aligned along to the field. I.e., the exchange bias on the upper layers (with smaller grains) still can hold the magnetization in the preferred direction, while the magnetization of the lower layers already has followed the field.
Together with measurements at several other magnetic field values on both branches of the hysteresis loop it turned out that every single layer has a square magnetization loop, but the strength of the exchange bias effect (i.e. the shift of the centre of the loop away from H = 0) increases with reduced grain size. The overlaying of the differently shifted square loops then results in the inclined net magnetization loop measured with magnetometry.
10.5 Vector magnetometry
The second important application of polarized neutron reflectometry with polarization analysis is vector magnetometry in layered structures. The ability to distinguish between SF and NSF channels offers an independent access to the in-plane magnetization components perpendicular and parallel to the field direction. As a magnetization direction perpendicular to the sample surface is rare (due to the shape anisotropy) one can determine the full magnetization vector in most cases.
...
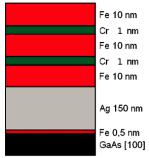
Fig. 10.10: Layer sequence of an epitaxially grown and antiferromagnetically coupled [Fe / Cr]N multilayer
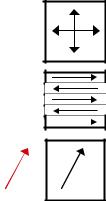
I would like to explain the power of vector magnetometry using the example of an epitaxially grown and antiferromagnetically (AF) coupled [Fe / Cr]N multilayer with an odd number of Fe layers [8]. Fig. 10.10 shows the layer sequence of such a sample grown on a GaAs single crystal with a Ag buffer layer to improve the surface quality. The magnetic behaviour is determined by the competition between 3 different interactions (see.
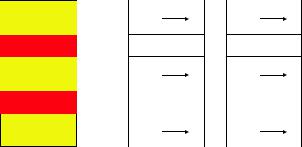
Fig. 10.11): The crystalline anisotropy in the single crystalline Fe layers tries to align the magnetization in every Fe layer along one of the in-plane [100] directions. This results in 4 equivalent easy axes. The antiferromagnetic coupling (mediated by the Cr interlayer) has the tendency to align the magnetization of two neighbouring Fe layers antiparallel to each other. The Zeeman term tries to align the magnetization of every ferromagnetic layer along the applied field.
Magnetic Nanostructures |
10.13 |
Fe single crystal layers: 4 easy axes
AF coupling through Cr interlayer
Applied field: Zeeman energy
H
Fig. 10.11: The magnetic behaviour in an applied magnetic field is governed by 3 competing interactions
As the multilayer under investigation has an odd number of Fe layers, the antiparallel orientation of the magnetization in remanence (where the Zeeman term is weak) will leave the magnetization of one layer uncompensated, so that the Zeeman energy does not vanish even at very small fields. This effect is supposed to align the remanent magnetization of all layers along or antiparallel to the field direction.
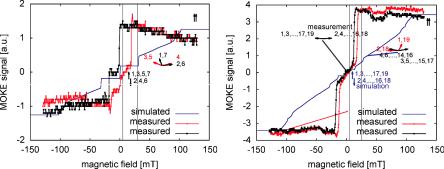
Fig. 10.12 shows MOKE measurements of such samples with N = 7 or N = 19 Fe layers in the multilayer sequence. The MOKE signal is a function of the magnetization, but not proportional to it, because it is a superposition of the longitudinal Kerr effect (proportional to the magnetization along the field) and the transverse Kerr effect (proportional to the magnetization perpendicular to the field). Furthermore, the weight of the layers close to the surface is much higher than the weight of lower lying layers due to the limited penetration depth of the light. Therefore, one should not worry about the MOKE curve not being monotonous. Nevertheless, a jump in the MOKE curve always indicates a spontaneous change of the magnetization state.
In addition, Fig. 10.12 shows a simulation of the integral magnetization component along the field based on a numerical minimization of the three energy terms mentioned above. This kind of simulation cannot reproduce effects of activation barriers leading to hysteresis.
In the case of the multilayer with N = 7 Fe layers, the simulation and the MOKE measurement have a good qualitative agreement. In saturation, the magnetic moment of every layer is aligned with the field. In the intermediate field range, the magnetization is alternatingly pointing left or right from the field direction, so that the magnetization component along the field is almost equal for every layer and the magnetization components perpendicular to the field fulfil as much as possible the AF coupling.
At remanence, the magnetization of all layers is turned by 90°, so that 4 layers have the magnetization along the field and 3 layers antiparallel to the field. This configuration
fulfils as well the AF coupling condition as the alignment of the net magnetization along the applied field.
Fig. 10.12: MOKE measurement of [Fe / Cr]N multilayers with N = 7 Fe layers (left) and N = 19 Fe layers (right). The simulation of the magnetization curve is based on minimization of the total energy.
In contrast to that, the MOKE measurement of the multilayer with N = 19 Fe layers shows a smooth transition through H = 0 while the simulation proposes a step comparable to the case described previously. This behaviour is known from AF coupled multilayers with an even number of ferromagnetic layers, because there the net magnetization vanishes, so that there is no Zeeman energy that causes the rotation of the entire magnetic configuration at remanence. This contradiction cannot be resolved by magnetometry measurements only.
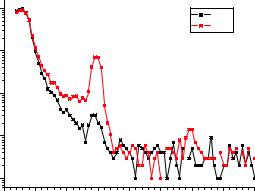
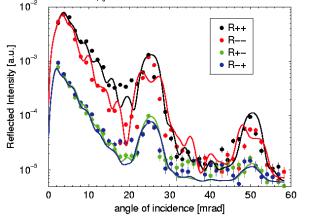
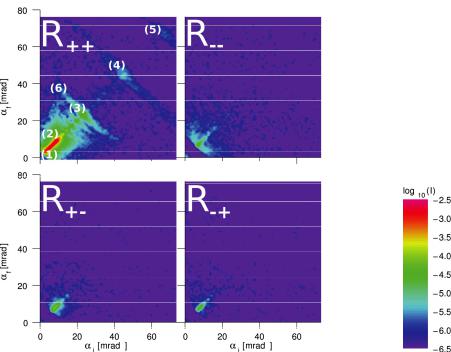
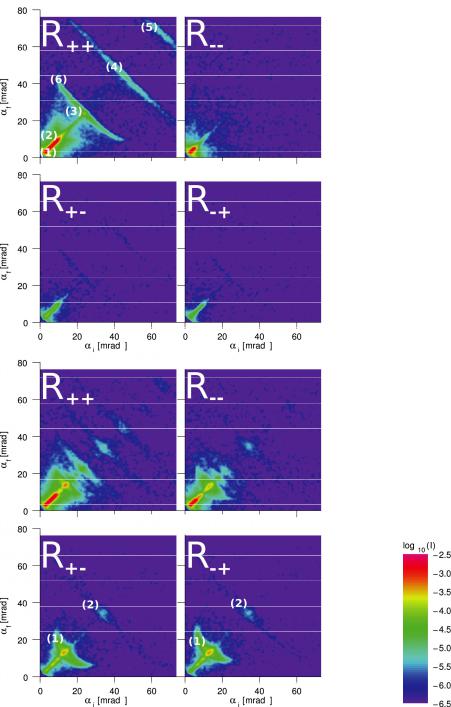
Fig. 10.13 shows the polarized neutron reflectivity together with the offspecular scattering for the two samples at saturation field. One can see a structured signal with total reflection and several Bragg peaks according to the periodicity in the multilayer structure only in the R++ channel. For spin – neutrons the contrast between fully magnetized Fe and Cr vanishes, so the R– – shows only the total reflection (with a reduced critical angle compared to R++), but no Bragg peaks. As no magnetization component perpendicular to the field direction exists, there is no real spin flip signal. What you see in R+– and R –+ is a parasitic signal due to the limited efficiency of the polarizing equipment of the instrument. The Bragg sheets crossing the specular Bragg peaks are due to vertically correlated roughness of the Fe / Cr interfaces.
No qualitative difference between the two samples can be observed except the fact that the Bragg peaks and Bragg sheets are sharper and more intense for the [Fe / Cr]19 sample because of the bigger number of periods.
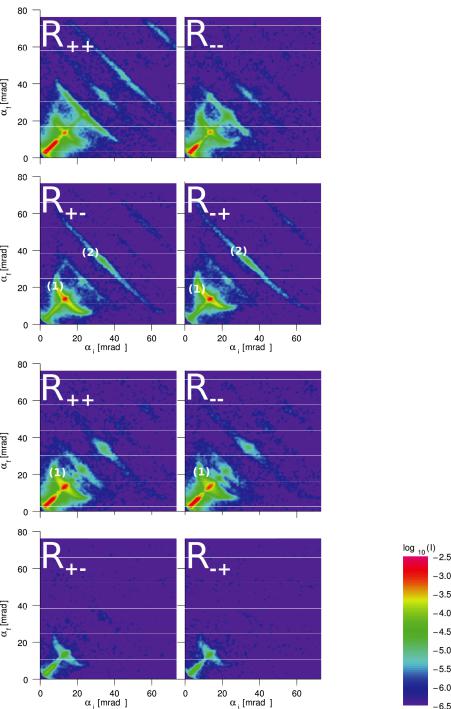
Fig. 10.14 shows the same in the intermediate field range. Additional Bragg peaks of half order appear, which are stronger in SF compared to NSF. This is the indication of the alternation of the magnetization directions due to the antiferromagnetic coupling. Mainly the magnetization component perpendicular to the field oscillates while the component remaining along the field is modulated less. As the sample is no more saturated, the magnetization component in field direction is reduced, so that the contrast
Magnetic Nanostructures |
10.15 |
for spin – neutrons does not vanish any more. Therefore, the full order Bragg peaks also come up in R– –. They are now mainly induced by the nuclear structure while the magnetic contribution is collected in the half order signal. The strong off-specular signal around the half order Bragg peaks in the SF channels is a signature of magnetic domains. Again, no distinct qualitative difference between the two samples is observed.
This is very different at remanence, as shown in Fig. 10.15. The [Fe / Cr]7 sample has all half order peaks in the NSF channels while the [Fe / Cr]19 sample has all half order peaks in SF. The small contribution in the other channels can be explained due to the limited polarization of the neutron beam. This shows that the magnetization of all layers of the [Fe / Cr]7 sample is aligned alternatingly parallel and antiparallel to the field direction, as has been proposed by the simulation for the MOKE measurement.
In the case of the [Fe / Cr]19 sample, all magnetization is now concentrated perpendicular to the field, no more difference between R++ and R– – can be observed. The measurement clearly shows that the Zeeman energy contribution equivalent to the magnetization of a single Fe layer is not sufficient to turn the entire magnetization of all 19 layers by 90° across the crystalline anisotropy barrier.
In addition to the qualitative description presented here, a quantitative analysis of the measurements allows to determine the angle of the magnetization vector of every layer independently. This analysis is presented in Ref. [8].
Fig. 10.13: Polarized neutron reflectivity and offspecular scattering for two AF-coupled
[Fe / Cr]N multilayers with N = 7 (top) and N = 19 (bottom) in saturation field of
300 mT. Indicated are the primary beam blocked by the beamstop (1), the plateau of total reflection (2), the first (3), second
(4) and third order (5) Bragg peak (giving information about the layer structure) and the Bragg sheets (6) (giving information about correlated roughness).
Magnetic Nanostructures |
10.17 |
Fig. 10.14: Polarized neutron reflectivity and offspecular scattering for two AF-coupled
[Fe / Cr]N multilayers with N = 7 (top) in intermediate field of 30 mT and N = 19 (bottom) in intermediate
field of 25 mT. Indicated are the AF superstructure Bragg peaks of the order ½ (1) and 1½ (2).