

Schluesseltech_39 (1)
.pdf8.6 |
|
|
|
|
|
|
|
|
|
|
|
|
|
|
|
|
|
|
|
|
|
|
|
|
|
|
|
G. Roth |
|
|
|
|
|
|
|
|
|
|
|
|
|
|
|
|
|
|
|
|
|
|
|
|
|
|
|
|
|
|
|
|
|
|
|
|
|
|
|
|
|
|
|
|
|
|
|
|
|
|
|
|
|
|
|
|
|
|
|
|
|
|
|
|
|
|
|
|
|
|
|
|
|
|
|
|
|
|
|
|
|
|
|
|
|
|
|
|
|
|
|
|
|
|
|
|
|
|
|
|
|
|
|
|
|
|
|
|
|
|
|
|
|
|
|
|
model: dynamic H-disorder according to a double-well potential
Fig. 8.4: Difference-Fourier-plot of the negative proton density in the hydrogen bond of paraelectric RDP indicated by broken contour line [3]. The double-well potential model used to describe this density is inscribed in green.
The two very close hydrogen positions with 50% occupation probability are, of course, an artefact of the time-space averaging that is inherent to diffraction. In this case, the hydrogen disorder is assumed to be a dynamic hopping process between the two energetically degenerate sites.
At Tc = 147 K, RDP transforms to a ferroelectric phase of orthorhombic symmetry (space group: Fdd2) in which the protons order in short asymmetric O-H···O bonds (Fig. 8.5). The PO4-tetrahedra show a characteristic deformation with two shorter and two longer P-O distances due to a transfer of electron density to the covalent O–H bonds. The electrical dipole moments are oriented ||z which give rise to a polarisation along the c-direction.
Fig. 8.5: Ferroelectric, hydrogen-ordered structure of RDP close to the phase transition at TC – 1 K (major changes indicated by arrows, presentation as in Figure 8.3) [3].
Structural Analysis |
8.7 |
The phase transition temperatures of KDP-type compounds change drastically when H is substituted by D. For K(H,D)2PO4, for instance, the parato ferroelectric TC changes from 122 K in the protonated to 229 K in the deuterated compound. This huge H/D- isotope effect proves that hydrogen-ordering and -dynamics is the major factor controlling this phase transition. Another type of H/D-isotope effect was found for Tl(H,D)2PO4 (TDP/DTDP) and Rb(H,D)2PO4 (RDP/DRDP), where a different polymorphism between the protonated and deuterated phases exists.
Clearly, the use of neutron diffraction is detrimental to a better understanding of these compounds and their interesting physical properties.
8.4 Atomic coordinates and displacement parameters
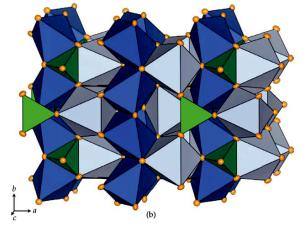
As discussed above, neutron diffraction is very useful for obtaining precise atomic coordinates and displacement parameters. The improved accuracy (compared to x-rays) stems mainly from the absence of the form-factor fall-off. We will use measurements on Cobalt-olivine, Co2SiO4, (crystal size 3 x 2 x 2 mm) taken at the four-circle diffractometer HEiDi at the hot-neutron source of the FRM II reactor (B = 0.552 Å) for demonstrating this advantage for the thermal displacements:
Fig. 8.6: |
Structure of Co2SiO4 olivine at room |
|
temperature, projected along c. Green: SiO4-tetrahedra, Dark blue: |
|
Co(1)O6-octahedra, light blue: Co(2)O6-octahedra. Displacement ellipsoids |
|
are plotted at the 95% probability level (from [4]). |
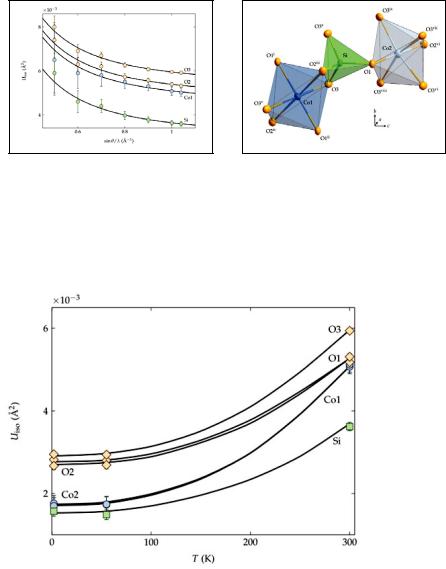
The olivine structure (fig. 8.6) consists of chains of two types of edge-sharing CoO6- octahedra connected by SiO4-tetrahedra. A large data set with 1624 independent reflections up to sin / = 1.05 Å-1 had been measured. The data were then successively cut off in shells of sin / and the resulting partial data sets were used to analyse the displacement parameters. Figure 8.7 shows two interesting observations: First of all, the precision improves significantly with increasing (sin / )max, as is evident from the decreasing size of the error bars. In the x-ray case, high angle reflections are usually very weak and their measurement does often not lead to improved precision. Secondly,
8.8 |
G. Roth |
there is a systematic change of the displacement values themselves, resulting from systematic errors that vary with (sin / )max.
Fig. 8.7: |
Left: Statistical (error bars) and systematic |
|
errors of isotropic displacements parameters in Co2SiO4 as a function of |
|
measured sin / range from single-crystal neutron diffraction data at room |
|
temperature [4]. Right: Clinographic view of the CoO6 and SiO4 polyhedra |
|
in Co2SiO4 at room temperature [4]. |
High dhkl-value resolution data from neutron diffraction is also useful to derive precise temperature dependent displacement parameters (fig. 8.8):
Fig. 8.8: |
Temperature dependence of the isotropic |
|
displacement parameters of Co2SiO4 [4]. |
Just as in the case of high quality single crystal x-ray diffraction data, anisotropic displacement parameters can be determined as well. In addition to that, the quality of single crystal neutron data also often allows refining anharmonic displacement parameters. Anharmonic oscillations of atoms in crystals occur if the atoms are vibrating in a non-parabolic potential well. In such cases, the harmonic approximation,
Structural Analysis |
8.9 |
which is the basis of the description of thermal displacements by the Debye-Waller factor, fails. Analysis of the anharmonic displacements allows to reconstruct the nonparabolic potential at the site of the vibrating atom.
8.5 Magnetic structures from neutron diffraction
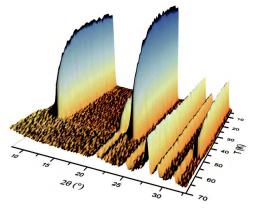
Cobalt-Olivine, Co2SiO4, orders magnetically below about 50 K. The magnetic moments of the Co2+-ions turn from a paramagnetic phase with no long range order of the magnetic moments into an antiferromagnetically ordered arrangement. We use Co2SiO4 again to briefly demonstrate the application of neutron diffraction to the structural analysis of magnetic structures. This time, a powder neutron diffraction experiment has been performed at the diffractometer D20 (ILL, France) in its highresolution mode, at temperatures between 70K and 5K, with a neutron wavelength of B = 1.87 Å and approximately 2 g of powdered Co2SiO4 [4].
Fig. 8.9: Thermal evolution of the neutron powder diffraction pattern (low angle part) of Co2SiO4 [4].
At about 50 K, new magnetic reflections (001), (100), (110), (300) etc. appear (fig. 8.9). The nuclear reflections don’t change much at the magnetic phase transition. The new reflections can be indexed with the same unit cell as the nuclear reflections, but they were forbidden in the paramagnetic phase with space group P n m a. Obviously, the symmetry has changed at the magnetic ordering transition. The task is then - just as in ‘ordinary’ structure determination - to find a structural model (that is: magnetic moments and their orientation on the magnetic ions, here Co2+) that fits the observed positions and intensities of the magnetic Bragg peaks. Magnetic structure determination is outside the scope of this chapter, but assumed such a model has been constructed, it can be refined - in the case of powder data by the Rietveld method (fig. 8.10).
8.10 |
G. Roth |
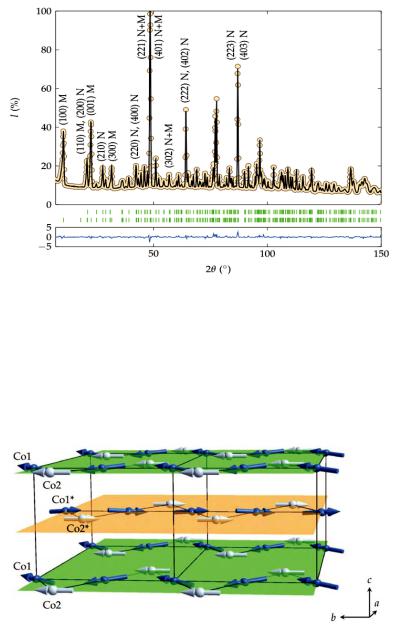
Fig. 8.10: Neutron powder diffraction pattern (dots), Rietveld t (black line) and allowed Bragg re ections (green marks) at 5 K of Co2SiO4 [4].
The lower trace (blue) is the difference Iobs - Icalc on the same scale. The upper row of the green marks shows Bragg re ections corresponding to the nuclear phase and the lower row represents the allowed positions of the magnetic peaks. Some of the Bragg peaks are indexed. ‘N’ and ‘M’ denote the nuclear and magnetic contributions, respectively [4]. Note that the magnetic Bragg peaks are only visible at low diffraction angles.
Fig. 8.11: Graphical representation of the magnetic structure of Co2SiO4 below 50 K. The non-magnetic atoms (Si and O) are excluded for simplicity. The gure shows the zigzag chains of Co(1) and Co(2) in layers perpendicular to the c axis [4].
Structural Analysis |
8.11 |
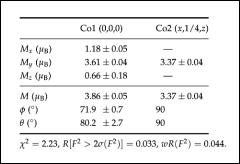
From the Rietveld refinements, one can derive the exact spin orientation (fig. 8.11) as well as parameters describing quantitatively the magnetic moments on the two symmetrically non-equivalent Co2+-sites (see table below). However, magnetic neutron diffraction from single crystals often gives additional and more accurate information:
The table shows cartesian (Mx, My and Mz) and spherical (M, and ) components of the Co1 and Co2 magnetic moments according to the single-crystal neutron diffraction data at 2.5 K. The directions of the magnetic moments for other cobalt ions in the unit cell can be obtained by applying the symmetry operations of the magnetic space group (Schubnikov group) Pnma.
8.6 Electron densities from x-rays and neutrons
Another advanced application of neutron diffraction in structural analysis is the determination of 3-dimensional high resolution maps of the electron density in the unit cell to study, for instance, details of the chemical bonding. The most involved method of electron density studies (called x-N-synthesis) uses a combination of high quality single crystal neutron and x-ray diffraction experiments. In the present case, a single crystal of Co2SiO4 with dimensions 3 x 2 x 2 mm, was measured on the four-circle diffractometer HEiDi at the hot-neutron source of the FRM II reactor (Garching) at B = 0.552 Å, the single crystal x-ray (synchrotron) experiment was performed on Diffractometer D3 at the synchrotron facility HASYLAB/DESY (Hamburg) with a Co2SiO4-sphere, diameter 150 m as the sample and an x-ray wavelength of B = 0.5 Å. The next step is to take the x-ray-data, do a Fourier-transform (Fourier-synthesis) to obtain the electron density map:
(r) = 1/V · F(;) · exp[2 i(;·r)], with F(;) = |F(;)|·exp[i9(;)].
;
The phases 9(;) are calculated from the atomic model (structure factor equation, see ch. 4), the moduli |F(;)| are taken from the measured x-ray intensities. The result is a 3- dimensional map of the total electron density (r) within the unit cell:
8.12 |
G. Roth |
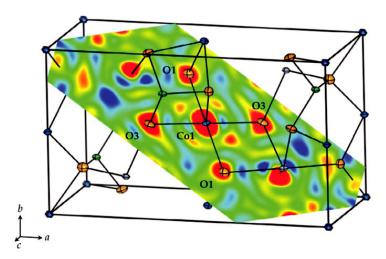
Fig. 8.12: Electron density distribution (r) of Co2SiO4 at 12 K from Fourier synthesis of x-ray data. Contours range from 8 e/Å3 (blue) to 10 e/Å3 (red). A plane which intersects the Co1O6 octahedron and contains the Co1, O1 and O3 atoms is shown together with a sketch of the crystal structure [4].
In favourable cases, such a map already shows interesting features of the (anisotropic) bonding electron density, however, the information content of the map can be very significantly improved by taking the coordinates and displacement parameters from the more accurate neutron diffraction experiment (see above for the reasons) and calculate, in a second step, the so called deformation density. This is done by subtracting from the
total electron density (r) the density (r)spherical corresponding to a superposition of spherical atoms at the nuclear positions. More specifically: atomic positions xj, yj, zj and thermal displacements Tj of atoms j derived from the neutron experiment, ‘decorated’ with the calculated spherical single atom electron densities.
(r)deform = (r) (r)spherical, where the sum runs over all atoms in the unit cell.
(r)spherical corresponds to the expectation value of the electron density within the unit cell without any effects which are due to chemical bonding. The deformation density then represents the deformation of the charge distribution as a result of the formation of chemical bonds. Figure 8.13 shows such a deformation density map for Co2SiO4. In favourable cases, the electron density in the hybridized bonding orbitals (in this case of Co3dand O2p character) can be directly observed.
Structural Analysis |
8.13 |
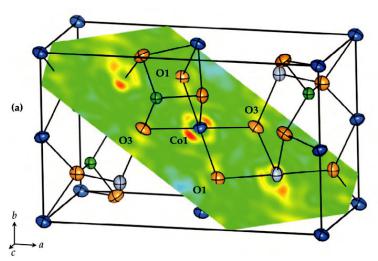
Fig. 8.13: Deformation density from the x-N-difference Fourier map of Co2SiO4 at 300 K: Section through the O1–Co1–O3 plane The difference density varies from 1.25 e/Å3 (blue) to 1.15 e/Å3 (red) [4].
8.7 Magnetization densities from neutron diffraction
As a final example for the application of neutron diffraction in structural analysis, we briefly sketch how a 3-dimensional map of the magnetization density, that is: the density of magnetic moments (spinas well as orbital-moments) within the unit cell can be determined. These maps are sometimes lucidly called ‘spin density maps’, but in systems with non-vanishing orbital moments, the term magnetization density is really the correct one.
The experiment is performed by polarized neutron diffraction on a single crystal using the ipping ratio method For details on the experimental method see the chapter on magnetic scattering. The flipping ratio method allows to separate nuclear and magnetic contributions to the diffracted intensities. It is performed above the magnetic phase transition in the paramagnetic state (in the case of Co2SiO4 above TN=50K) and the sample is in a strong external magnetic field (here: 7 T). 207 Bragg re ection ipping ratios were measured at diffractometer 5C1 of the ORPHÉE reactor (Laboratory Léon Brillouin, CEA Saclay, France) for Co2SiO4 at 70K up to sin / 0.62 Å 1 at a neutron wavelength of = 0.845 Å. Given the flipping ratios and the nuclear structure factors, the magnetic structure factors can be calculated which are then Fourier transformed to give the spatially resolved magnetization density shown in figure 8.14 in a section through the unit cell of Co2SiO4.
8.14 |
G. Roth |
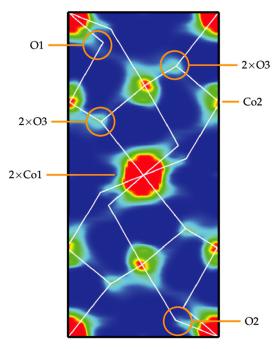
Fig. 8.14: Reconstruction of the density (projected along the b axis) corresponding to the observed magnetization distribution of Co2SiO4 at 70 K with contours ranging from 0 B/Å3 (blue) to 2 B/Å3 (red) [4].
Among the interesting features of this map is the observation of magnetization density on the, nominally non-magnetic, oxygen atoms coordinating the Co2+-ions. These ‘transferred moments’ are direct experimental evidence for the hybridization of the oxygen 2pwith Co-3d-orbitals which is not only responsible for covalent bonding but also for the magnetic exchange interaction along the Co-O-Co-bond network.
References
[1]W. Reimers, E. Hellner, W. Treutmann and G. Heger,
J.Phys. C: Solid State Phys. 15, 3597 (1982).
[2]R. J. Nelmes, W. F. Kuhs, C. J. Howard, J. E. Tibballs and T. W. Ryan,
J.Phys. C: Solid State Phys. 18, L711 (1985).
[3]S. Mattauch, G. Heger, and K. H. Michel, Cryst. Res. Technol. 39, 1027 (2004)
[4]A. Sazonov, Ph.D.-thesis, RWTH Aachen (2009) A. Sazonov et al., Acta Cryst. B65, 664-675 (2009).
Structural Analysis |
8.15 |
Exercises
E8.1 Rietveld refinement
A.What is the basic problem in refining crystal structures from powder diffraction data?
B.Sketch the fundamental idea to solve this problem.
C.What kind of data can be obtained from a Rietveld refinement?
(collect a list and sort into categories: Structural parameters, instrumental parameters, others)
D. Can powder diffraction data be used for structure determination? (yes or no plus arguments)
E8.2 Thermal displacement Parameters
A.Write down the (isotropic) displacement factor ("Debye-Waller-factor”) that enters the structure factor formula (for x-rays)
B.Discuss the physical origin of this factor.
C.Describe the overall effect of this displacement factor on the diffracted intensities.
D.Do you expect the formal description to be fundamentally different for neutron diffraction as compared to x-ray diffraction?
E.It is generally said, that neutron diffraction yields much more precise displacement parameters than x-ray diffraction. Correct? If so: Why?
F.What are anisotropic displacement parameters and how can they be visualized?
G.Is it correct, that all atoms in cubic crystals have to vibrate isotropically?
H.Discuss the symmetry restrictions (shape and orientation of the ellipsoid) following from the point symmetry at the atomic sites for the following cases: -1, 2/m, 4/m -3 2/m
E8.3 Displacements at low temperatures
A.Discuss the reduction of the displacement parameters with decreasing temperature (fig.8.8): Is this effect real or an artefact? Arguments?
B.Discuss the non-zero values of the displacements factors for T => 0 K in the same figure and the different values for different atom types.