


Advanced MR Methods in Differential
Diagnosis of Brain Tumors
Elke Hattingen, Ulrike Nöth, and Ulrich Pilatus
Contents |
|
|
|
|
|
|
Conventional MRI may considerably improve the differen- |
||||||
1\ |
MR Relaxometry Techniques............................................... |
\ |
111 |
tial diagnosis of space-occupying brain lesions. However, |
|||||||||
2\ Transverse |
Relaxation Time T2 |
\ |
113 |
the |
specificity for |
providing a definite diagnosis |
remains |
||||||
limited. Given the fact that final diagnosis should be based |
|||||||||||||
3\ Effective |
Transverse Relaxation Time T2* |
|
|
||||||||||
\ |
114 |
on |
histopathology |
and immunohistochemistry, |
imaging |
||||||||
|
and Susceptibility-Weighted Imaging (SWI)...................... |
diagnosis seems to be of minor significance. However, some |
|||||||||||
|
|
|
|
|
|
|
|
|
|||||
4\ Longitudinal |
Relaxation Time T1........................................ |
\ |
115 |
decisions must be met prior to surgical tissue sampling, e.g., |
|||||||||
5\ Chemical |
Exchange Saturation Transfer (CEST).............. |
\ |
115 |
the avoidance of steroids if CNS lymphoma is suspected or |
|||||||||
6 |
Cest Method |
\ |
116 |
the definition of the target area for biopsy in inhomogeneous |
|||||||||
gliomas (see Chap. MR Imaging of Brain Tumors). |
|
||||||||||||
7\ CEST |
Imaging in Brain Tumors |
\ |
117 |
|
|||||||||
Therefore, improving differential diagnosis of brain |
|||||||||||||
|
|
|
|
|
|
|
|
|
|||||
References..................................................................................... |
|
|
|
|
\ |
118 |
tumors may have decisive influence on further therapy and |
||||||
|
|
|
|
|
|
|
|
|
on surgical strategy. |
|
|||
Advanced MR imaging methods are more specific compared to conventional MRI and may thus provide additional information on tumor biology and tumor morphology. Methods mainly exploring tumor biology, as e.g., tumor vasculature and metabolism, are described elsewhere (see Chaps. MR Spectroscopic Imaging and MR Perfusion Imaging). While standard MRI is optimized for showing tumor morphology, more advanced MR methods can help with tissue characterization. The best known technique in this respect is diffusion-weighted imaging and its further developments (see Chap. Diffusion-Weighted Methods). Further techniques for the characterization of tumor tissue are the MR relaxometry and the susceptibility-weighted imaging, both detailed in this chapter.
We also describe experimental methods based on chemical exchange, which have high potential to uncover tumor biology but are yet to be evaluated in large patient cohorts.
1\ MR Relaxometry Techniques
Standard MRI sequences provide images that may display different weightings, such as T2 (transverse relaxation time) weighted images, T1 (longitudinal relaxation time) weighted images, images with a combination of both weightings (as in fluid-attenuated inversion recovery, FLAIR), or images
111
112 |
E. Hattingen et al. |
|
|
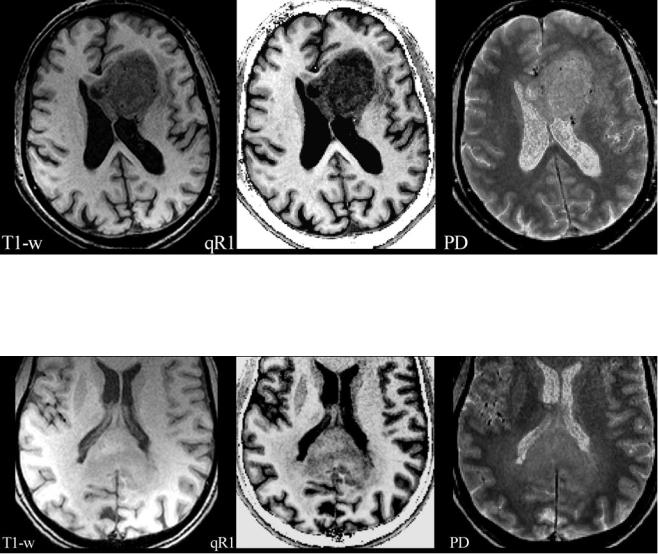
Fig. 1 A left frontal glioblastoma is shown in a conventional T1-w axial image (T1-w) without a contrast agent, in a map of quantitative R1 relaxation rate (qR1) with R1=1/T1, and in a map of proton density (PD). The qR1 map is gray scaled, showing the increasing T1 relaxation time from white to black; the PD map shows increasing PD values from black
Fig. 2 A glioblastoma of the splenium of the corpus callosum with adjacent subtle white matter changes which extended into both hemispheres and were suspicious for gliomatosis. Images from standard MRI (T1-w) and quantitative maps (qR1 and PD) are shown as in Fig. 1. T1 relaxation times of this infiltrative tumor are shorter compared to the glioblastoma in Fig. 1, resulting in a less hypointense appearance in qR1, while the PD is comparable. Thus, the tumor is hardly seen on
to white. The tumor is hypointense compared to white matter in the T1-w image due to the longer T1 relaxation time of tumor tissue (dark gray in qR1). However, the PD is increased in the tumor, increasing the signal in all weighted images of the standard MRI including T1-w images. This may attenuate the hypointense signal in T1-w images
standard T1-w images. Also note the bright signal in T1-w of the dorsal brain which is due to RF coil inhomogeneities. Quantitative mapping of theT1 relaxation time or its inverse, the R1 relaxation rate, eliminates the RF coil inhomogeneities and the PD contrast, thus showing the tumor much clearer in qR1. Even subtle changes of the adjacent white matter may be depicted
where both weightings are suppressed (proton density (PD) weighted). In fact, signal intensities and image contrast provided by standard MR sequences are influenced to some degree by all parameters (T2, T1, PD) described so far. In addition, inhomogeneities of the static magnetic field and MR hardware-related effects have an influence on image quality too. The relaxation times (T2, T1) and proton density vary between different tissues and fluids, and their influence on image contrast is difficult to estimate in standard MRI. Different parameters (T1, PD) exhibit opposite signal behavior (Fig. 1), resulting in a partial masking of their respective weightings. This effect may reduce the detectability of pathological structures (Fig. 2).
These ambiguous contrast phenomena can be avoided by acquiring a series of MR images with different T1 or T2 weighting which allows calculating the respective relaxation time. The resulting parameter maps provide quantitative values of the relaxation times (T1, T2) and thus offer more unequivocal information on tissue characteristics Schad et al. 1993. The following sections deal with the diagnostic value of these parameters.
However, the systematic approach to obtain these parameter maps is challenging. Current advances in MR imaging, hardware and post-processing techniques prepare the way to resolve these problems. The description of these quantitative methods is beyond the scope of this book and reference is

Advanced MR Methods in Differential Diagnosis of Brain Tumors |
113 |
|
|
made to some reviews (Cheng et al. 2012; Tofts 2003). Apart from their diagnostic value, these quantitative parameter maps are free from magnetic field inhomogeneities, RF coil characteristics and the specific choice of imaging parameters (e.g., TR, TE), thus allowing the quantification of pathological tissue changes. The diagnostic advantages of quantitative and semiquantitative MR parameter evaluation have been shown in MS patients (Cheng et al. 2012; Hasan et al. 2012; Tofts).
Unfortunately, most quantitative MR studies on brain tumors date from decades ago, i.e., the early stages of methodical development restricted by less developed hardware and low computational power. Damadian was the first to report prolonged T2and T1-relaxation times in neoplastic tissue (Damadian 1971). Although the benefit of quantitative MR methods in differential diagnosis of brain tumors has yet to be shown, it should be considered as one of the most challenging responsibilities for radiologists to establish standardization and reliable MR parameter quantification in tumor imaging, especially in the context of tumor monitoring.
2\ Transverse Relaxation Time T2
The spin-spin or transverse relaxation time T2 describes the exponential decay of the component of the tilted magnetization, which is perpendicular to the static magnetic field. Local inhomogeneities of the static magnetic field (e.g., due to magnetic susceptibility differences or chemical shifts) lead to an acceleration of this decay, which is described by the effective transverse relaxation time T2*.
The transverse relaxation rate (R2) experienced by a spin, which is the inverse of T2, depends on the energy transfer between two spins, yielding fluctuations of their respective Larmor frequencies. The T2 relaxation time is long in tissues with freely moving water molecules, such as those in pure water and aqueous solutions. Macromolecules (e.g., myelin, proteins) interacting with the water molecules influence the T2 relaxation time, which decreases as the concentration of macromolecules increases. Most brain pathologies (e.g., tumor infiltration, edema, gliosis) result in an accumulation of abnormal fluids and/or in a decrease of macromolecules within the brain tissue. Therefore, T2-weighted MR images (T2-weighted sequences in the strict sense and also FLAIR which displays a T1 contrast in addition to the T2 weighting) are used to detect brain pathologies as most of them appear bright against the darker normal tissue. Mapping of the relaxation time T2 in the brain quantifies changes of the normal and pathological tissue in an objective and reproducible manner.
Experimental animal studies as well as human studies demonstrated that glioma tissue has significantly longer T2 relaxation times compared to normal brain tissue (Englund et al. 1986; Hoehn-Berlage et al. 1992; Oh et al. 2005) and even compared to non-glial tumors (Englund et al. 1986; Oh et al. 2005). Positive correlation of T2 with ADC values in
brain tumors implies that T2 values are related to the water content of the tumor. Therefore, higher T2 values indicate more necrotic tumors with lower tumor cell density, whereas a high cell density or a high amount of interstitial reticulin deposition lowers the T2 values of tumor tissue (Englund et al. 1986; Berghoff et al. 2012; Oh et al. 2005). Furthermore, a higher T2 relaxation time was observed in peritumoral edema as compared to normal tissue. It is well known from stereotactic surgery that the so-called peritumoral edema of gliomas is a mixture of vasogenic edema and tumor cell infiltration. The T2 value of the edema adjacent to the enhancing tumor (i.e., the tumor signal enhances in a T1-weighted image after application of a contrast agent) may help to differentiate metastases from gliomas: T2 values in the pure vasogenic edema of metastases and meningiomas were longer than those in the immediate peritumoral edema of gliomas (Oh et al. 2005). Despite these promising results, it should be emphasized that the characterization of neoplastic tissue changes such as necrosis, tumor cell accumulations, edema, and vasculature may not be determined by quantitative MRI alone, but also requires visual scrutiny of structural patterns.
This approach also helps to monitor tissue changes such as increasing tumor infiltration over time by using subtraction maps. For this purpose, consecutive follow-up maps of the relaxation time T2 of an individual patient are co- registered and subtracted voxel-wise from a reference map of the same patient. This allows the detection even of subtle tumor infiltration which might not be detectable by visual inspection (Hattingen et al. 2013).
Apart from tumor infiltration, acute therapeutic reactions like radiation necrosis may also increase the T2 relaxation time (Larocque et al. 2009). However, T2 values can also decrease under radiation, possibly due to the presence of paramagnetic substances such as blood products. Our own experience from T2 mapping of glioblastomas is that differences in T2 relaxation times are highest between edema and normal brain tissue, whereas the tumor tissue demonstrates a wider range of T2 values sometimes even similar to normal brain tissue. In particular, antiangiogenic therapy of patients with progressive glioblastomas resulted in a significant decrease of the T2 value in tumor tissue approaching T2 values similar to normal brain tissue (Hattingen et al. 2013). Tumor tissue with a low T2 relaxation time exhibits a reduced signal on T2-weighted images, reducing the perceptibility of these “darker” tumors which might thus be visually missed. This could explain why progression-free survival – but not the overall survival – is longer under antiangiogenic therapy compared to other treatment modalities: real progression of non-enhancing tumors may be visually missed under antiangiogenic therapy. The lower T2 values seem to reflect a normalization of the blood-brain barrier (BBB) under antiangiogenic therapy, which reduces edema and therefore tumor water content.
114 |
E. Hattingen et al. |
|
|
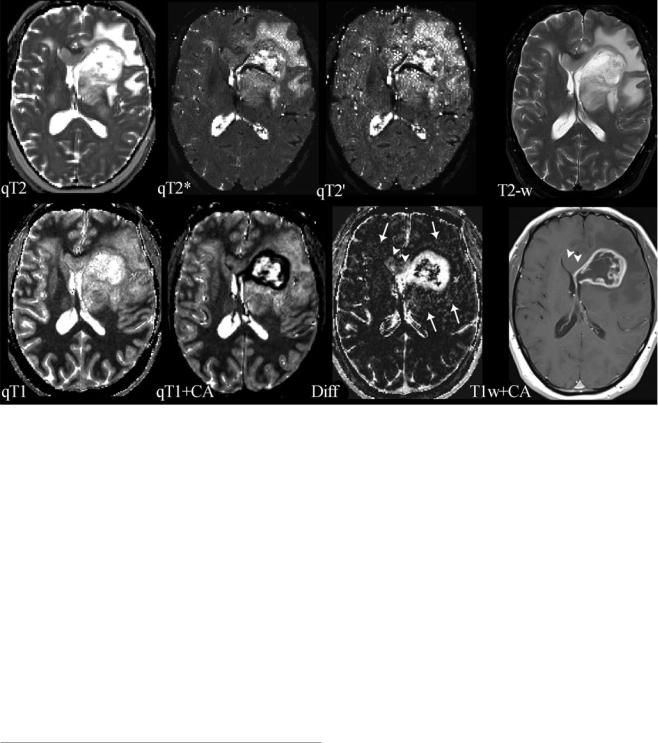
Fig. 3 Compilation of different parameter maps from quantitative MRI in a patient with left frontal glioblastoma: the upper row shows maps of the transverse relaxation times T2, T2*, and T2′ (qT2, qT2*, and qT2′) and a conventional T2-weighted image (T2-w); the lower row shows maps of the longitudinal relaxation time before (qT1) and after application of a contrast agent (qT1+CA), the difference map (Diff) resulting from voxel-wise subtraction of (qT1+CA) from qT1, and a conventional T1-weighted image after application of a contrast agent (T1w+CA). The standard MR images (T2-w and T1w+CA) show the tumor’s central necrosis, which is surrounded by solid tumor tissue enhancing after CA application, and a large edema. The images also show that the non-enhancing part of the tumor infiltrates the corpus callosum and the basal ganglia and that there is a small area of edema in the contralateral frontal lobe. However, the maps of the different relax-
ation times reveal further biological information: The T2′ map (which is T2* without T2 effects) reveals some dark areas which might represent hypoxia and/or tumor bleedings (white stars). The qT1 map depicts the whole tumor extension and its relation to the anatomical structures showing high gray-white matter contrast (please note the inverse contrast compared to the qR1 map in Figs. 1 and 2; in qT1 the T1 relaxation time increases from black to white). The CA shortens the T1 relaxation time (dark areas in qT1+CA). However, voxel-wise subtraction of qT1+CA from qT1 yields a T1 difference map (Diff) additionally depicting tumor enhancement in the corpus callosum and basal ganglia which is missed on T1-weigthed images after application of a CA (T1w+CA) (white arrow heads). Additional slight enhancement is also seen in the “edema” region (white arrows), suggesting angiogenetic reactions from invisible tumor infiltrations
In summary, T2 relaxation time mapping of brain tumors seems to be sensitive to the detection of tumor-related tissue changes and might be an excellent tool for longitudinal tumor monitoring (T2 difference maps), whereas the specificity of the changes is limited.
3\ Effective Transverse Relaxation Time
T2* and Susceptibility-Weighted
Imaging (SWI)
The effective transverse relaxation time T2* reflects the dephasing of the transverse magnetization in gradient echo sequences which is due to the spin-spin relaxation and local field inhomogeneities. Therefore, T2* is influenced by local microscopic and macroscopic magnetic field inhomogeneities due to susceptibility differences between tissue types
and chemical shifts. Macroscopic field inhomogeneities (B0) are found near the skull base and may also be induced by metallic devices. Microscopic field inhomogeneities result from physiological iron depositions in the deep nuclei of the brain and deoxyhemoglobin (deoxyHb) in blood. The relation of diamagnetic oxyHb to paramagnetic deoxyHb mainly influences the T2* relaxation time in brain tissue, which is also known as “blood oxygenation level-dependent” (BOLD) effect. In summary, T2* is influenced both by spinspin relaxation (which is described by T2) and susceptibility effects (which are described by the relaxation time T2′). The mathematical correlation of these three relaxation times is 1/ T2′ =1/T2*−1/T2 or alternatively when using the relaxivities R′ =R2*−R2. Measuring T2* and T2 relaxation times, B0 field inhomogeneities and blood volume fraction yield reliable information on the oxygenation of brain tumors (Fig. 3), so that T2′ mapping in combination with an MR