


MR Perfusion Imaging |
|
|
83 |
|
|
|
|
||
Table 1 Overview of MR perfusion imaging methods |
|
|
||
Method |
Indicators |
Imaging |
Advantages |
Disadvantages |
DSC |
(r)CBV |
Time series of T2*w images (usually |
Implemented on commercial MR |
Compromised by contrast |
|
(r)CBF |
EPI) during CA bolus application |
systems |
agent leakage |
|
(r)MTT |
Acquisition time ≈1–2 min |
Relatively easy to perform |
Not easily quantifiable |
|
AT |
|
Robust estimates of relative CBV |
|
|
TTP |
|
|
|
DCE |
Ktrans |
Time series of T1w images during CA |
Straightforward characterization |
No established standard |
|
CBV |
bolus application |
of vessel permeability |
method |
|
CBF |
Acquisition time: several min |
|
Not widely implemented on |
|
|
|
|
commercial MR systems |
|
|
|
|
Low SNR |
ASL |
CBF |
Pairs of label/control images |
No contrast application necessary |
Low SNR |
|
|
(usually EPI) |
Robust estimate of relative CBF |
|
|
|
Acquisition time: several min |
|
|
other difficulties which complicate absolute quantification of CBF via ASL like inhomogeneities of the receiver coil (Wang et al. 2005), T2* relaxation (St Lawrence and Wang 2005), and labeled water within arteries (Petersen et al. 2006a, b). CBF quantification using ASL is an area of active research steadily yielding innovations, e.g., a time efficient strategy for sampling at multiple TI using the Look–Locker approach was proposed by Gunther et al. (2001). However, many refinements with regard to accuracy go along with decreased SNR and reduced stability. Thus, in clinical practice, where measurement time is heavily restricted, qualitative ASL or PASL methods aiming at CBF quantification with a single inversion (Wong et al. 1998; Luh et al. 1999) are most frequently applied.
The Perfusion Study Group of the International Society for Magnetic Resonance in Medicine (ISMRM) (Perfusion Study Group ISMRM 2013) is currently compiling a consensus paper on MR perfusion imaging, which is supposed to contain recommendations for scan protocols as well as evaluation procedures for a number of applications. This consensus paper is expected to be a huge step toward more standardized MR perfusion imaging methods (Table 1).
3\ Clinical Application
3.1\ General Aspects
Perfusion imaging in brain tumors is—as of today—not yet part of the imaging modalities included in the response assessment in neuro-oncology (RANO) criteria, where response to treatment in patients with malignant gliomas is determined by post-therapeutic changes in conventional T2 and contrast-enhanced T1 imaging along with clinical parameters (Wen et al. 2010). The omission of the novel functional MRI methods is explained by a lack of standardization and thus impaired comparability of multicenter data; however, further application for individual patient evaluation is strongly recommended, since perfusion
imaging is accepted as a standard tool of neuro-oncological diagnostics today.
The technical aspects of perfusion imaging are discussed in detail in the first section of this chapter. In everyday clinical practice, the DSC method is most commonly available, providing perfusion data in under a minute’s measurement time. ASL and DCE methods are less widespread due to technical limitations. A combination of the methods, if available, may provide additional information. However, the patient’s well-being must always be put first: long examinations may be less tolerated by critically ill patients—and motion artifacts due to unease impair data independent of the perfusion imaging method used. A special advantage of ASL methods is the lack of external contrast agent; therefore, they can be applied in patients with contraindications to contrast agent administration, i.e., impaired renal function or severe gadolinium allergy.
Most MRI systems provide an online calculation of DSC- based perfusion maps, with manual masking, smoothing, AIF definition, and ROI placement. While these maps can quickly be inspected and readily transmitted into local PACS systems, they have the drawbacks of being operator dependent and not quantitative. Several approaches for quantitative assessment, e.g., histogram and kurtosis analysis, are available and widely used for scientific evaluation; however, these are mostly in-house developments and only allow offline evaluations.
Perfusion characteristics of brain tumors are most frequently compared with those of normal appearing brain tissue in the same patient, relying on a relative value, e.g., rCBV. A high rate of perfusion is typically defined as higher than normal appearing gray matter. Perfusion heterogeneity is a common feature in brain tumors and the localization of “hot spots,” i.e., focally highest values, is of special interest. While (semi)quantification is feasible, the definition of a threshold value valid across patients is nearly impossible, also due to diverging physiological parameters such as heart rate. Special attention must be paid to “artificially” high perfusion values in vascular structures. A cor-
84 |
C. Preibisch et al. |
|
|
relation with conventional imaging—where vessels appear as flow voids and tubular enhancements—is therefore indispensable.
A controversial topic in perfusion MRI of brain tumors is the correction for contrast agent leakage in the presence of a disrupted blood–brain barrier (BBB). The development of a leaky BBB is an important step in the malignant transformation of a tumor and BBB changes may also be a relevant effect of tumor therapy. Therefore, the effect of a disrupted BBB and consequent contrast agent leakage on perfusion data must be accounted for when attempting tumor grading or assessing therapy response. In order to achieve comparability of perfusion measurements at different clinical sites, the measurements and post-processing steps must be standardized. While simple techniques to minimize leakage effects, e.g., the preinjection of contrast agent to “saturate” the extracellular space, are easy to perform (for further description of such techniques, see Methods), the standardization of more sophisticated postprocessing algorithms might be favorable (Boxerman et al. 2012; Heiland et al. 2010). Separate information on cerebrovascular parameters (CBV, CBF) and on BBB permeability may be acquired; several possibilities for this are discussed in the “Methods” section of this chapter.
The vast majority of clinical studies have investigated the parameter rCBV—measured by the most robust DSC method—in correlation with other descriptive tumor characteristics and with outcome. Other perfusion parameters like rCBF and permeability have also been introduced to clinical practice with the use of ASL and DCE (Warmuth et al. 2003). First clinical studies using these parameters have largely reproduced previous (rCBV) results in most clinical questions.
Perfusion imaging, when performed and interpreted with care, can play a significant role in major clinical decisions regarding diagnosis, therapy, and follow-up.
3.2\ Pathophysiological Background:
Neovascularization in Brain Tumors
Neovascularization, i.e., the development of new vessels, is a vital process in the embryonic differentiation processes as well as in later stages of life where wound repair and inflammation, etc. require additional vascular supply. A marking step in the research of tumor pathophysiology was the detection of neovascularization of tumors as part of their malignant transformation (Brem 1976). Once the angiogenic phenotype is switched on in a tumor, its malignancy is definite and its growth exponential. The development of tumor vessels is especially intriguing in brain tumors, as they represent a direct correlate of tumor grade, are largely responsible for symptomatic tumor edema and
bleeding, and represent an obstacle to drug delivery. While low-grade tumors grow along preexisting vessels (vascular co-option), higher-grade tumors start to generate own tumor vessels in the process of growing, which are different from normal vessels in appearance and structure. Glioblastoma vessels mainly originate from local endothelial cells (angiogenesis)—after destruction of preexisting vessels—or sometimes from bone marrow-derived endothelial precursor cells (vasculogenesis); further mechanisms include vascular mimicry and the transdifferentiation of GBM cells into endothelial cells (Hardee and Zagzag
2012). Genetic and epigenetic factors include an alteration of oncogenes with upregulation of hypoxia-inducible factor HIF-1α and members of the family of vascular endothelial growth factor (VEGFs); these factors promote the destruction of pericytes and of the extracellular matrix with matrix metalloproteinases; they recruit endothelial cells and promote vascular remodeling and sprouting. The resulting tumor vessels are tortuous, wide, and dense, while their borders are blurred due to incomplete endothelial and pericyte coverage resulting in a breakdown of the blood–brain barrier and increased permeability (Soda et al. 2013).
In neuropathology, description of tumor vascularity is an important criterion for tumor grading with higher vascularity representing a higher grade of malignancy. WHO °II tumors mainly incorporate preexisting vessels, while highgrade gliomas develop new, heterogeneous, and tortuous vessels with higher density (Fig. 6). Higher microvascular density is a prognostic factor for shorter postoperative survival in astroglial brain tumors (Leon et al. 1996; Folkerth 2004).
In histopathological studies combined with previous MR perfusion imaging, tumor regions with high rCBV were found to correlate with a high microvascular density in mouse models as well as in human brain tumor specimens (Cha et al. 2003). Contrast enhancement and permeability measures in MRI reliably characterized the blood–brain barrier and its permeability as seen in histopathology. These findings confirm the theoretical assumption that perfusion imaging represents the variations and changes in tumor microvasculature (Cha 2004).
3.3\ Differential Diagnosis of Tumors
The differential diagnosis of the three major groups of malignant intracranial intra-axial tumors—glioma, lymphoma, and metastases—is often difficult in conventional (T2w, T1w) MR imaging. Their features in conventional imaging —typical localization, the presence or absence of hemorrhage, necrosis, and T2 signal intensities—may help differential diagnosis but are not always conclusive. While
MR Perfusion Imaging |
85 |
|
|
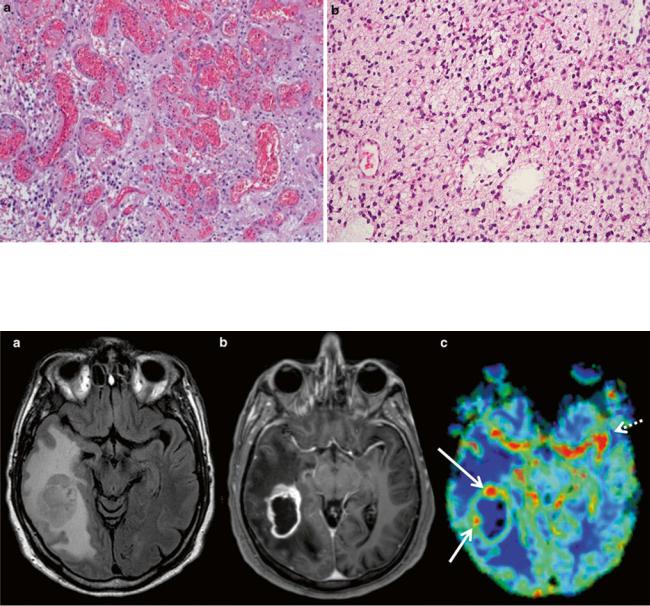
Fig. 6 (a) Histopathological view of pathological tumor vessels in a WHO °II glioma exhibits no pathological tumor vessels (Image glioblastoma specimen. Note the densely packed tortuous vessels with
Fig. 7 Imaging of a glioblastoma: (a) axial FLAIR, (b) post-Gd T1w, and (c) DSC rCBV map of a selected slice. The contrast-enhancing lesion shows high rCBV values as compared to WM, with focal peaks in the rostral and lateral parts of the tumor (red dots marked with
courtesy of Claire Delbridge MD, Department of Neuropathology, incomplete endothelial coating. (b) In contrast, the biopsy specimen of a Klinikum Rechts der Isar, TU Munich)
arrows) corresponding to tumor hot spots. High rCBV values are also seen lateral to the contrast-enhancing lesion, corresponding to the tumor infiltration zone (lower arrow). Note the high signal corresponding to the carotid and middle cerebral arteries (dotted arrow)
periventricular localization is typical for lymphomas and metastases are more often cortex associated, each of these entities may appear in another localization—therefore, periventricular or cortical localization is not a distinctive feature. Contrast enhancement and focal necrosis are common in all high-grade brain tumors irrespective of their origin. Therefore, in most cases, conventional imaging does not allow a definite diagnostic statement. However, the intrinsically different histology and vascularization pattern of these entities makes perfusion imaging a useful tool in their differentiation.
High-grade gliomas are characterized by high cellular density and pleomorphism, mitoses, palisading necrosis, and vascularization. The latter results in very high tumor perfusion, i.e., high rCBV values throughout the tumor (as compared with healthy contralateral tissue), with focal peaks probably representing the most malign tumor foci, the so- called tumor hot spots (Fig. 7). Glial tumors show an extremely infiltrative growth pattern beyond the contrast- enhancing lesion into the peritumoral edema. Consequently, rCBV values are typically elevated beyond the contrast- enhancing lesion in peritumoral regions as well.
86 |
C. Preibisch et al. |
|
|
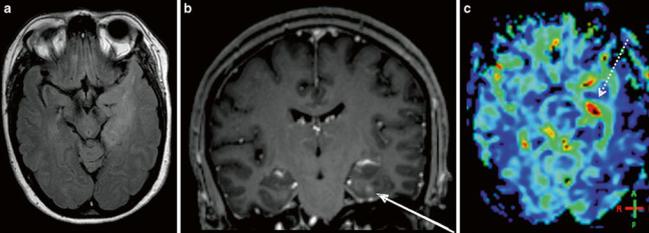
Fig. 8 Primary CNS lymphoma: (a) axial FLAIR, (b) post-Gd T1w; (c) DWI, and (d) DSC rCBV map of a selected slice. Despite strong diffuse contrast enhancement, only moderate local rCBV elevation is seen. Diffusion restriction pleads for a tumor with high cellular density.
In the histopathological view (e: Image courtesy of Claire Delbridge, MD, Department of Neuropathology, Klinikum Rechts der Isar, TU Munich), note the high cell density and the growth pattern around preexisting vessels
Primary CNS lymphoma also shows high cellular density and diffuse infiltration; however, they typically exhibit an angiocentric growth pattern around preexisting vessels. Therefore, this entity generally has lower rCBV than glioblastoma, yet somewhat higher values than healthy brain tissue, mainly due to a limited but existing neoangiogenesis (Fig. 8). In single cases, it can still be very difficult to differentiate between lymphoma and glioblastoma even with perfusion imaging. A specific characteristic of lymphoma perfusion may be the signal change in the time–intensity curve from the DSC perfusion: lymphomas, unlike glioblastomas, may show a characteristic pattern, where the signal recovery exceeds the baseline level after the first pass, which was described in Blasel et al. (2013) and Liao et al. (2009).
Cerebral metastases spread via hematogenous routes and can therefore be well vascularized, depending on the origin of the tumor. However, metastases are well delineated, without a diffuse infiltration zone but a typically large peritumoral edema. While rCBV in the enhancing tumor regions in metastases is just as high as in glioblastomas, the peritumoral region shows significantly lower perfusion in metastases (Law et al. 2002) (Fig. 9).
3.4\ Tumor Grading and Prognosis
Perfusion imaging—as an indirect measure of tumor vascu- larization—was shown to correlate with the histological grade of gliomas in several studies and with different
MR Perfusion Imaging |
87 |
|
|
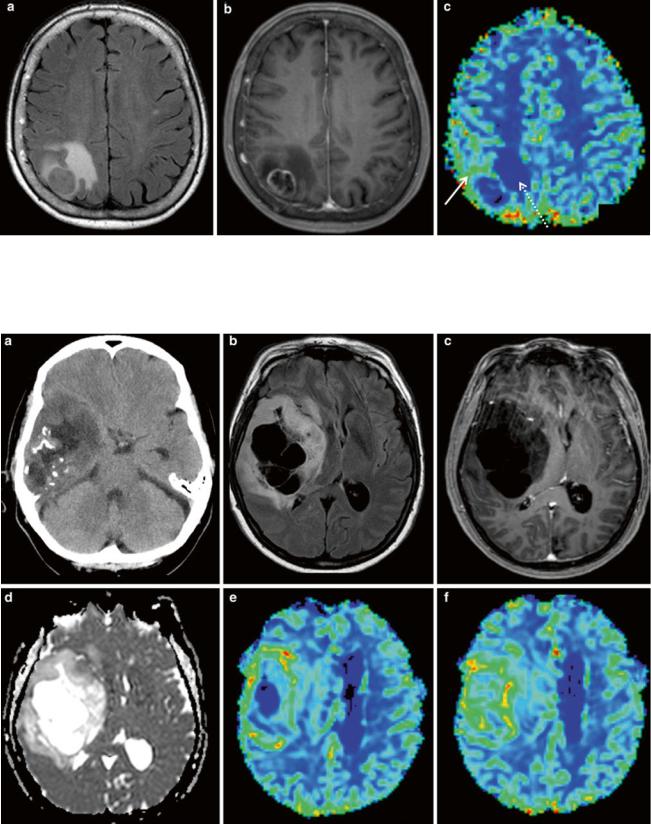
Fig. 9 Metastasis of a bronchial carcinoma (NSCLC): (a) axial FLAIR, (b) post-Gd T1w, and (c) DSC rCBV map of a selected slice. Elevated rCBV values are seen in the rostral part of the contrast-enhancing lesion (arrow) but not in the perifocal edema (dotted arrow)
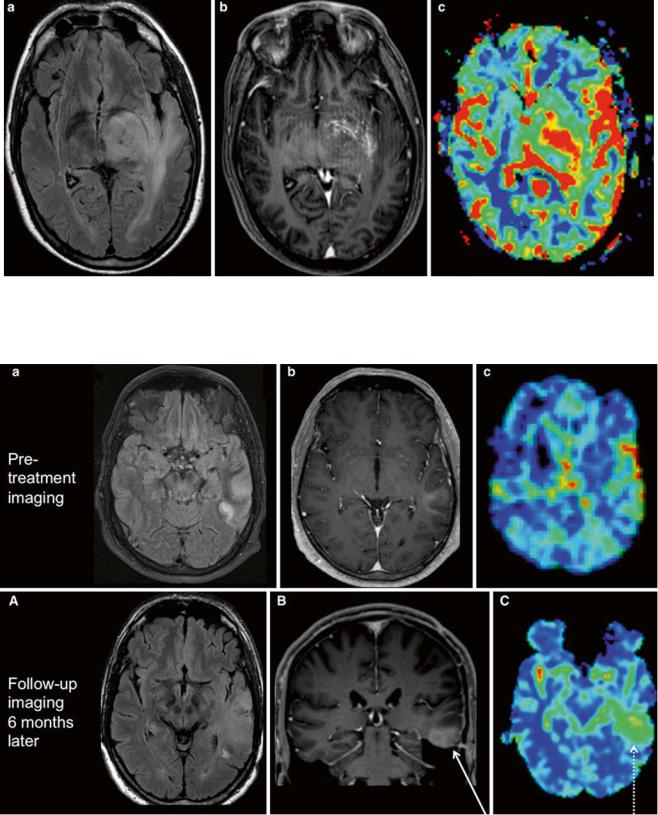
Fig. 10 Oligodendroglioma, an example for an atypical low-grade glioma: upper row (a) axial nonenhanced CT, (b) FLAIR, and (c) post-Gd T1w image; lower row (d) ADC map, (e, f) DSC rCBV map in a right
temporofrontal space-occupying lesion. Calcifications, multiple cysts, and a cortical localization are characteristic features. Despite the lack of contrast enhancement, high rCBV values are seen throughout the solid tumor
88 |
C. Preibisch et al. |
|
|
Fig. 11 Imaging of a diffusely infiltrating, moderately space-occupy- ing lesion in the left temporal lobe with only a punctual contrast enhancement (arrow): (a) axial FLAIR, (b) coronal post-Gd T1w image, and (c) DSC rCBV map of a selected slice. The lesion is
diffusely hyperperfused with elevated rCBV values throughout the tumor and focal hot spots (dotted arrow) indicating malignity. Histological diagnosis: anaplastic oligoastrocytoma WHO °III
imaging methods (Aronen et al. 1994; Donahue et al. 2000; Hakyemez et al. 2005; Schmainda et al. 2004; Jarnum et al. 2010). The underlying pathophysiology could also be proven histopathologically: The WHO grade of gliomas partly depends on vascularity, and a higher microvascular density was found in tumor specimens with higher rCBV (Cha et al. 2003). rCBV was identified as a particularly important imaging parameter among 161 different tumor characteristics in a pattern classification study (Zacharaki et al. 2009). The correlation of rCBV and glioma grade is independent of the evaluation method: operator-indepen- dent histogram analysis (where a big ROI is drawn around the whole tumor) was just as effective as operator-depen- dent rCBVmax-ROI analysis (Law et al. 2007).
Among the different perfusion parameters, rCBV correlates best with glioma grade whereas permeability showed a somewhat weaker correlation (Law et al. 2004). However, the two parameters demonstrate different tumor characteris- tics—and with respect to drug delivery, permeability imaging gains more and more importance (Levy 2005). Recently, a combined approach—rCBV together with CBF and Ktrans—was proven to be a better predictor of glioma grade (Law et al. 2004, 2006; Shin et al. 2002; Roy et al. 2013;
Zhang et al. 2012).
Contrast agent leakage is a particularly important factor in perfusion imaging of brain tumors. This also applies to tumor grade prediction. The most widely applied DSC method may underestimate rCBV in the presence of contrast leakage, which might result in an undergrading of a lesion. Therefore, leakage correction—at least a pre-bolus or preferably a postprocessing leakage correction algorithm— is essential in neuro-oncological studies (Boxerman et al. 2006).
Low-grade brain tumors—like astrocytomas (WHO II) and oligodendrogliomas—are not necrotic and their enhancement pattern is variable. While typical nonenhancing tumor regions usually show normal rCBV values (in the range of healthy tissue), there is an exception to the rule: low-grade oligodendrogliomas (Cha et al. 2005)—with or without contrast enhancement—may show higher rCBV due to an increased vessel density even without further hints of malignization (Cha et al. 2005; Lev et al. 2004) (Fig. 10).
Increased perfusion is seen in the enhancing tumor areas in WHO °III gliomas (Figs. 11 and 12) and even more so in glioblastomas; even the nonenhancing tumor infiltration region is hyperperfused in these tumors (Lupo et al. 2005).
Functional imaging including perfusion data may provide additional information about tumor vitality beyond the characteristics used for histopathological grading. The density of tumor vasculature correlates with overall survival in astrocytic tumors: high vascularity was linked to shorter time to progression and with reduced overall survival (Law et al. 2008; Sanz-Requena et al. 2013). Correspondingly, rCBV was shown to be equally or more important for prognosis and overall survival than histological grade, even in low-grade gliomas (Majchrzak et al. 2012). DSC perfusion imaging can be used to predict median time to progression in patients with gliomas, independent of pathological findings: baseline rCBV values above a threshold—either in high-grade or in low-grade gliomas—detect progressive disease and predict tumor recurrence and time to progression (Law et al. 2008; Caseiras et al. 2010; Bisdas et al. 2009). It is important to note that these findings could not be reproduced for tumors with oligodendroglial components where dense vascularization occurs in
MR Perfusion Imaging |
89 |
|
|
Fig. 12 Imaging of a diffusely infiltrating lesion in the left thalamus: (a) axial FLAIR, (b) axial post-Gd T1w MPRAGE, (c) DSC rCBV map of a selected slice. There is little space-occupying effect and moderate,
diffuse enhancement without necrosis. rCBV values, however, are elevated throughout the lesion and in its surroundings. Histological diagnosis stated an anaplastic astrocytoma WHO °III
Fig. 13 Astrocytoma progression. (Upper row) First imaging of a patient with an epileptic seizure; (a) axial FLAIR, (b) axial T1w postGd, and (c) DSC rCBV map of a selected slice. Peripheral diffuse T2 lesion of the temporal lobe with slight enhancement and minimally elevated rCBV values. Note the linear red signal cortical, corresponding to a large cortical vein in the T1w post-Gd. Histological report
stated an astrocytoma WHO °II. (Lower row) Follow-up of the same patient 6 months later; (A) axial FLAIR, (B) coronal T1w post-Gd, and (C) DSC rCBV map. Progression of the T2 lesion, now rather space occupying, and of the contrast enhancement (arrow). rCBV values are highly elevated throughout the lesion (dotted arrow). Histology revealed malignization to an astrocytoma WHO °III