

MR Imaging of Brain Tumors |
27 |
|
|
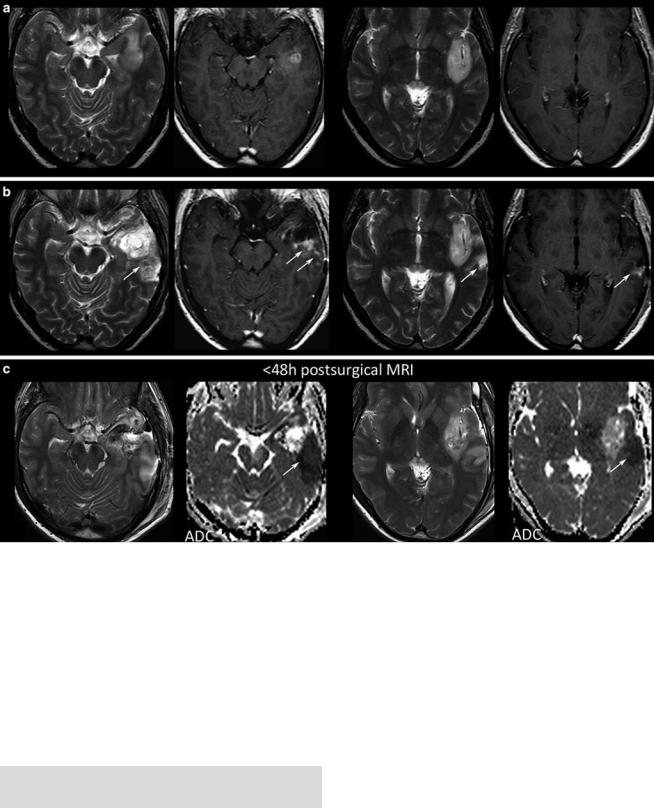
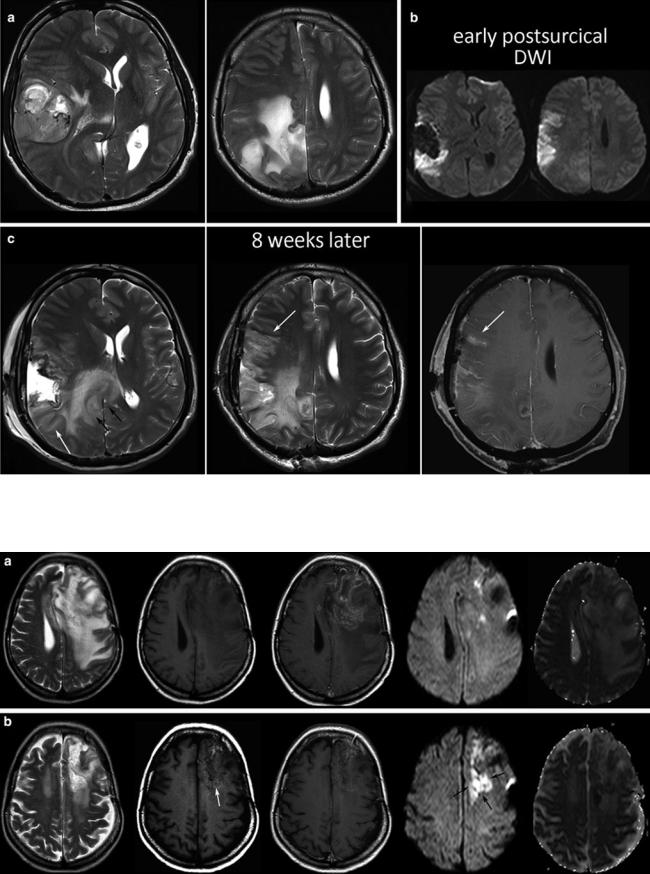
Fig. 20 Postsurgical monitoring of a patient with a high-grade glioma: The contrast-enhancing part of the tumor in the temporal white mater (a) was removed, while the insular part was left in place. The MRI control after 3 months showed T2-signal alterations and contrast enhancement in the dorsal margin of the tumor and also in the temporal
cortex (arrows). These areas were suspicious for tumor recurrence. However, in retrospection to the early postsurgical MRI, (c) clearly reveals that these areas match with postsurgical infarction (arrows) and thus might not be misinterpreted as tumor progression or possible pseudoprogression
Further, each monitoring begins with an early postsurgical MRI in order to detect the residual tumor which has to be monitored thereafter. Postsurgical control should always include DWI to detect infarcts, which may show confounding enhancement in the follow-up (Fig. 20).
Tumor Monitoring
Detect enhancing and nonenhancing tumor in 2 different orientations (e.g., axial, coronal).
Perform follow-up with identical imaging protocol. Include DWI and PWI.
2.5Imaging Protocol
Early MRI <72 h after surgery with identical noncontrast/ contrast T1WI, DWI, and T2* compared to the presurgical MRI.
2D sequences should be acquired with a slice thickness of <5 mm and max. 0.5 mm gap.
The imaging protocol should (1) characterize the tumor tissue, (2) localize the tumor, (3) show the extent of the tumor, and (4) appreciate the malignancy of a brain tumor.
MRI is the method of choice to characterize soft tissue.
28 |
E. Hattingen and M. Warmuth-Metz |
|
|
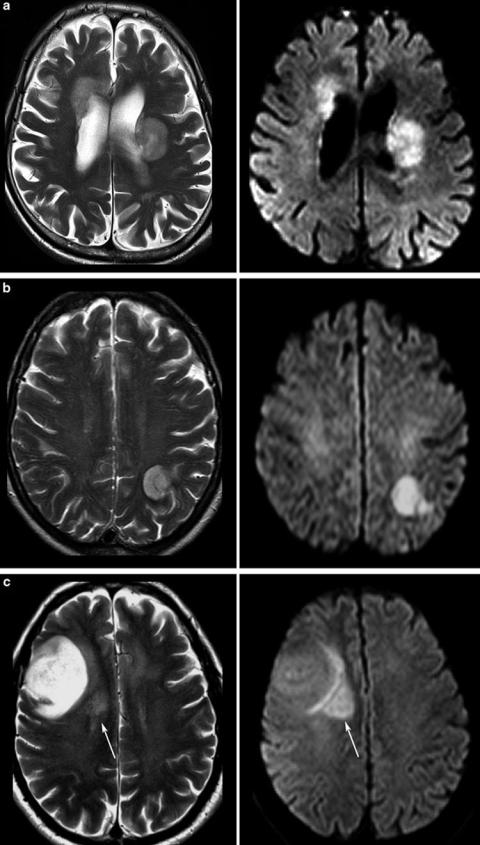
Fig. 21 Tumors with different signals on T2WI: In (a) the same patient with PCNSL is shown as in Fig. 6. The tumor is only slightly hyperintense to gray matter and DWI shows high signal due to the compact small cell matrix. High-grade gliomas may also show T2 and DWI signals which are similar to PCNSL if obvious necrosis is lacking (b). The astrocytoma WHO grade III in c has a large hyperintense area near the brain surface, while the adjacent brain tissue is infiltrated presumably with more densely packed tumor cells (not proven, because this area was not removed at surgery)
MR Imaging of Brain Tumors |
29 |
|
|
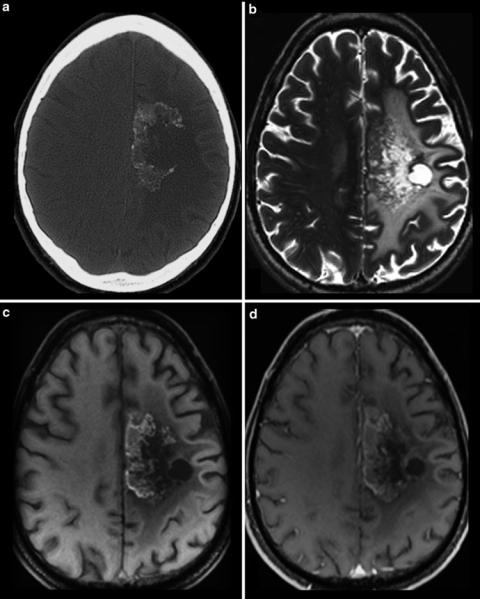
Fig. 22 CCT (a) and MRI (b–d) of a patient treated with antiangiogenic drug. CT yields calcifications in the tumor area which are also hyperintense in the precontrast MRI (c). Therefore, precontrast T1WI should be always considered because otherwise these hyperintense areas may be misinterpreted as enhancing areas (see also Fig. 17)
T2-weighted images (T2WI) reflect cell density of a tumor, because tumors with compact small cell matrix are rather isointense to gray matter. Typical tumors with dense cell structures are CNS lymphomas and the solid part of high-grade gliomas or medulloblastomas, respectively (Fig. 21). In contrast, tumors with loose cell structures are hyperintense even referred to the white matter. CSF-like signals might be necrosis, epidermoid, choroid plexus xanthogranulomas, cyst, or pus. In these cases, DWI is the method of choice to narrow differential diagnosis, showing hyperintense signals in abscesses, epidermoids, and in choroid plexus xanthogranulomas.
Tl-weighted images (T1WI) should be applied before and after application of contrast agent, actually as sequences
with identical parameters. In the noncontrast T1WI images, hyperintense structures are often seen in oligodendrogliomas and in malignant brain tumors especially in those treated with bevacizumab (Fig. 22). These T1-hyperintense lesions mainly correspond to regressive calcifications (Bähr et al. 2011). Noncontrast T1WI is mandatory for the postsurgical imaging to recognize T1-hyperintense methemoglobin and effects of hemostatic material which additionally shorten T1 relaxation time (Spiller et al. 2001). T1WI might be acquired as 2D or 3D sequences, while 2D as SE or gradient echo. 2D SE sequences have several advantages over 2D or 3D GE: Tumors of the skull base and orbit as important portals of entry are best depicted in noncontrast T1SE by the loss of hyperintense fat signal. In contrast, GE sequences miss this
30 |
E. Hattingen and M. Warmuth-Metz |
|
|
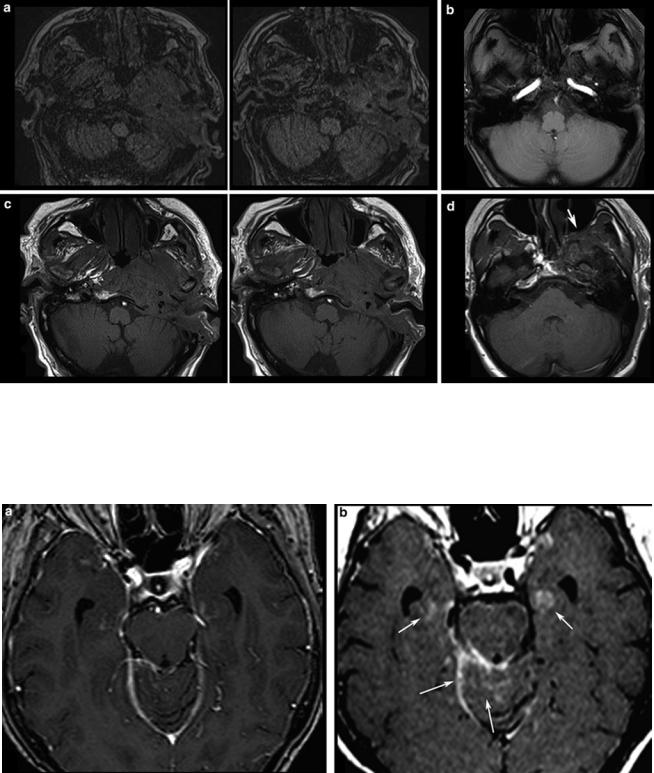
Fig. 23 Different T1-weighted sequences without contrast agent at the skull base: In (a) axial slices of a 3D magnetization-prepared rapid gradient echo (MPRAGE) sequence of a patient with malignant otitis externa infiltrating the skull base and in (b) an axial 2D FLASH sequence of a patient with a meningiomas are shown. The corresponding
T1-spin echo sequences (c, d) depict much clearer the infiltration of soft tissue and bony structures by the effacement of fat signal which cannot be seen on gradient echo sequences (a, b) due to the lack of hyperintense fat signal. Also note the effaced fat signal in the pterygopalatine fossa (arrow)
Fig. 24 3D MPRAGE or other 3D sequences incorporating an inversion pulse may be less appropriate to detect contrast enhancement. First, high signal of pial vessels and meninges may be confounding, and second, the signal of the brain tissue is not suppressed, and thus it is
more difficult to appreciate the enhancing lesions (a). On 2D T1W spin echo sequence, (b) intracerebral lesions as well as leptomeningeal enhancement in the cerebellar sulci and the tentorial edge are clearly seen (arrows)
MR Imaging of Brain Tumors |
31 |
|
|
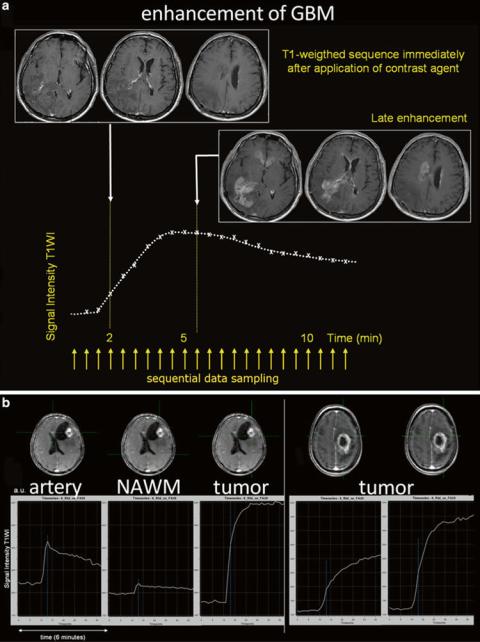
Fig. 25 The recurrent glioblastoma a was scanned immediately after the application of contrast agent and, 6 min later, showed impressive late enhancement of the tumor area. The signal intensity curve shows protracted enhancement of the tumor. In b different signal intensity curves are shown in two different GBMs depicting the rapid signal increase in the GBM on the left due to highly vascular tissue with impaired BBB, whereas in the GBM on the right had tumor areas with different enhancing dynamics
hyperintense fat signal, and air-bone-tissue interfaces cause signal losses and distortions (Fig. 23).
T1WI after intravenous application of contrast agent (CA): 3D MPRAGE may be less appropriate to detect contrast-enhancing lesions (Fig. 24), and 3D is more prone to motion artifacts compared to 2D sequences. Thus, other 3D sequences should be preferred if the contrast enhancement instead of the gray-white matter contract is of interest (Wetzel et al. 2002). Apart from the amount and pharmacokinetics of different contrast agents, contrast enhancement is a function of vessel permeability and of the delay time
between application of the contrast agent and sequence acquisition (Fig. 25).
Diffusion-weighted images (DWI) depict infarction after surgery which may be misinterpreted as recurrent tumor when endothelial barrier disruption brings contrast enhancement in the follow-up (Figs. 20 and 26). The DWI signal and the corresponding apparent diffusion coefficient (ADC) also reflect the microstructure of a tumor (diffusion-weighted methods). Further, antiangiogenic therapy with bevacizumab brings new DWI pattern with stroke-like hyperintensities which are still not understood (Rieger et al. 2010) (Fig. 27).
32 |
E. Hattingen and M. Warmuth-Metz |
|
|
Fig. 26 Presurgical scan of a huge GBM before resection of the lateral and parietal tumor parts (a), postsurgical DWI (b), and the MRI control 2 months thereafter (c). There is a clear tumor progression thickening
the splenium and adjacent white matter (black arrows), whereas the new cortical signal changes and the corresponding enhancement represent the ischemic tissue shown in (b)
Fig. 27 A recurrent GBM before (a) and 8 weeks after starting antiangiogenic treatment, showing hyperintense areas on the precontrast T1WI (white arrow) and also bright spots on DWI with corresponding low ADC values (black arrows)