

MR Imaging of Brain Tumors |
43 |
|
|
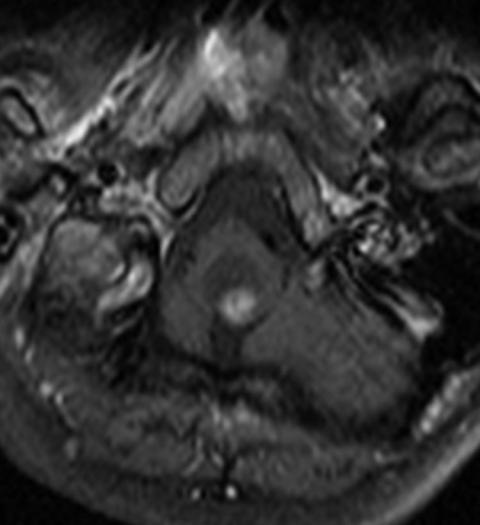
Fig. 38 Hemangioblastoma of the medulla oblongata showing the characteristic lack of cyst wall enhancement
at the borders of an ependymoma can be of diagnostic significance for this histology (Fig. 51) (Huisman 2009; Baleriaux 1999) kindly provide part label caption.
3.3Early Postoperative Imaging
A residual tumor after resection can only be identified within the first 3 days after resection because after this time period surgical trauma may induce reactive changes of the brain which may enhance the contrast agent. These changes are virtually indistinguishable from residual tumor (Forsting et al. 1993). Unfortunately, enhancement may also occur during and very early after surgical resection—especially by using electrocoagulation—causing problems to identify possible residual tumor as well (Knauth et al. 1999). Therefore, we do not advice to perform postoperative MR scans directly from the operating theater, which seems very attractive in terms of logistics. The first and second days after surgery are ideal for the early postoperative MRI. However, if this time period is
missed in a contrast-enhancing tumor, then the correct identification of a residual tumor might not be possible for a long time or even forever. Nonenhancing tumors can only be identified on the basis of their features on T2/FLAIR or PD sequences. Therefore, the comparability of MRI to the preoperative time point is of utmost importance. In addition, a change of magnetic field strength is problematic and should be avoided for the preand postoperative comparison and also for further follow-up.
3.4Meningeal Dissemination
The examination of the entire dural space intracranially and in the spinal canal is necessary for a correct tumor staging. MRI is the only noninvasive method for the evaluation of a leptomeningeal dissemination of tumors or a primary medullary tumor.
Enhancement can affect the leptomeninx and the pachymeninx. Pachymeningeal enhancement is frequently a
44 |
E. Hattingen and M. Warmuth-Metz |
|
|
Fig. 39 Hyperintense T2 signal (a) in the solid parts of a pilocytic astrocytoma in the right cerebellar hemisphere representing the low cell density of these tumors. On the ADC map (b) the low cell density of the
same pilocytic astrocytoma as shown in Fig. 3a leads to high values (seen as bright signal)
Fig. 40 Contrary to the Figs. 3a, b, the increased cellularity in case of a medulloblastoma leads to a hypointense T2 signal (a) and low ADC values (b)
MR Imaging of Brain Tumors |
45 |
|
|
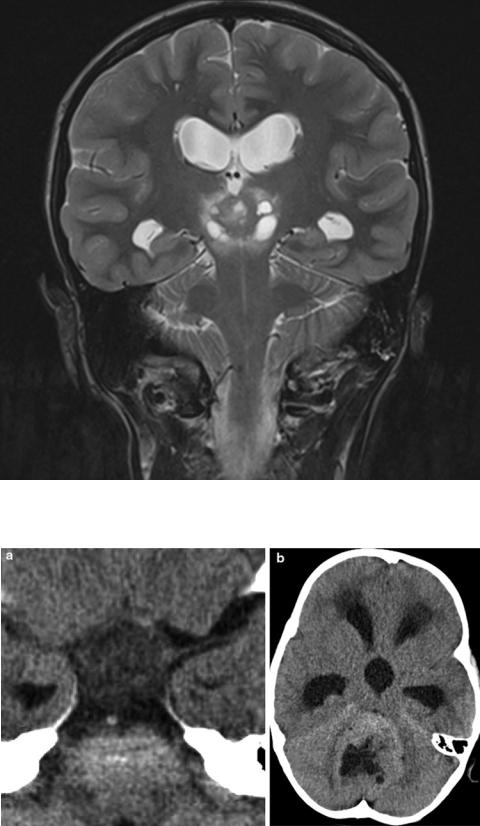
Fig. 41 In a germinoma of the pineal region, the T2 signal is hypointense as expected in a tumor with higher cell density. Small cysts are possible but large cysts are very unusual in germinomas
Fig. 42 On CT the cell density of tumors is reflected even more reliably than on MRI by highor low-density values. Low density is a characteristic feature of pilocytic astrocytoma of the chiasm (a), and an increased density compared to gray matter is typical for a medulloblastoma (b). If density is equal to gray matter, both entities are possible. If calcifications exist, this discrimination might fail
46 |
E. Hattingen and M. Warmuth-Metz |
|
|
Fig. 43 PNETs typically do not show a perifocal edema. More frequently enhancement is missing or only subtle (not shown)
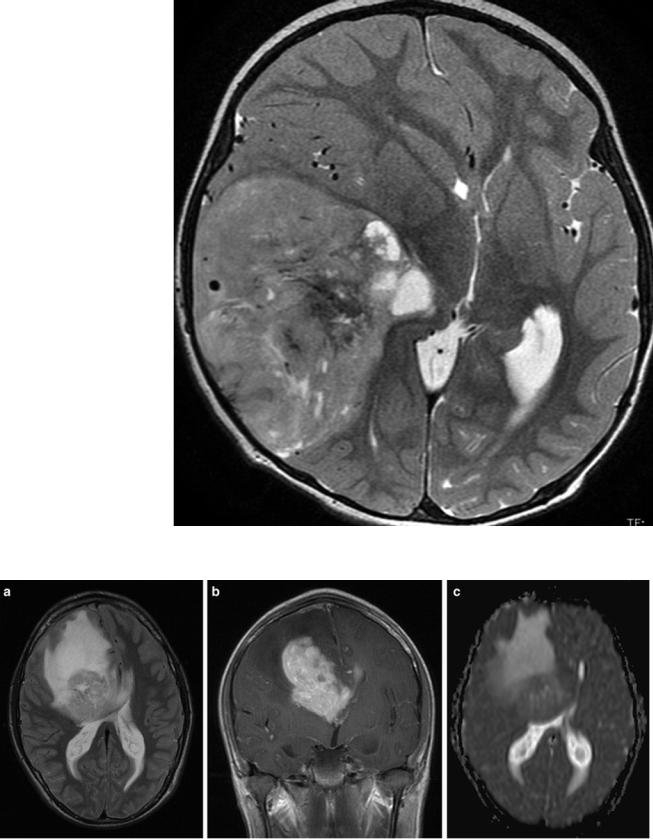
Fig. 44 In high-grade gliomas as in this anterior callosal GBM, edema is usually large and the tumor borders tend to be very indistinct (a: T2-weighted MRI). Enhancement (b) can vary but is usually
more intense in GBM compared to WHO grade III gliomas. Cell density is intermediate and therefore ADC values are not strikingly lowered (c)
MR Imaging of Brain Tumors |
47 |
|
|
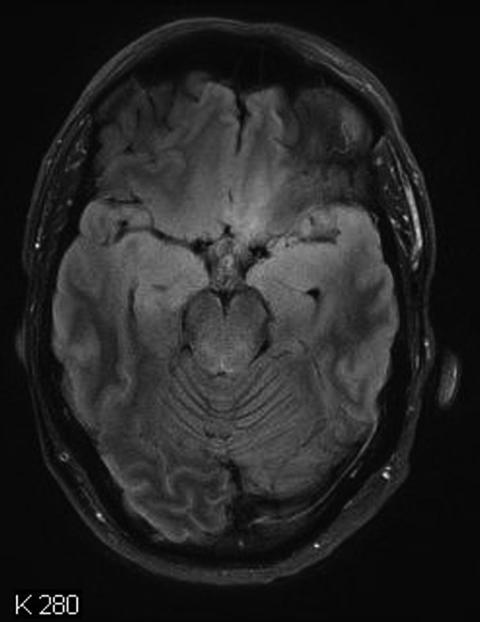
Fig. 45 Gliomatosis cerebri is defined as diffuse glioma which affects more than two lobes of the brain. The FLAIR image shows involvement of both frontal and temporal lobes and a pathology also in the cerebral peduncles bilaterally
consequence of pressure changes in the CSF space, e.g., after surgery, in case of an implanted shunting system or after lumbar punctures. In contrast, leptomeningeal enhancement either represents a neoplastic or inflammatory affection. Nodular enhancement of the leptomeninges is almost pathognomonic for nodular meningeal dissemination and is only rarely due to inflammation like sarcoidosis. In laminar enhancement, meningitis should be excluded by CSF examination.
In a considerable number of children with medulloblastomas or other tumors associated with leptomeningeal seeding, the staging examination of the spinal canal is performed after surgery. Immediately after surgery, MR scans show a physiological phenomenon, which is called nonspecific
subdural spinal enhancement. This enhancement closely resembles the MR images known from idiopathic CSF hypotension syndrome (Kumar et al. 2010; Medina et al. 2010), which typically shows an affection of the pachymeninges, whereas the leptomeninges are spared. This pattern can easily be differentiated from the MRI characteristics of leptomeningeal dissemination (Fig. 52) (Medina et al. 2010; Warmuth-Metz 2004). Subdural enhancement must not be confounded with leptomeningeal disease. Patients are always without specific symptoms. In case of extensive subdural enhancement, a leptomeningeal dissemination cannot be excluded with sufficient security, and therefore the spinal MRI has to be repeated after about 1–2 weeks. Within this time period, nonspecific enhancement should be reduced or

48 |
E. Hattingen and M. Warmuth-Metz |
|
|
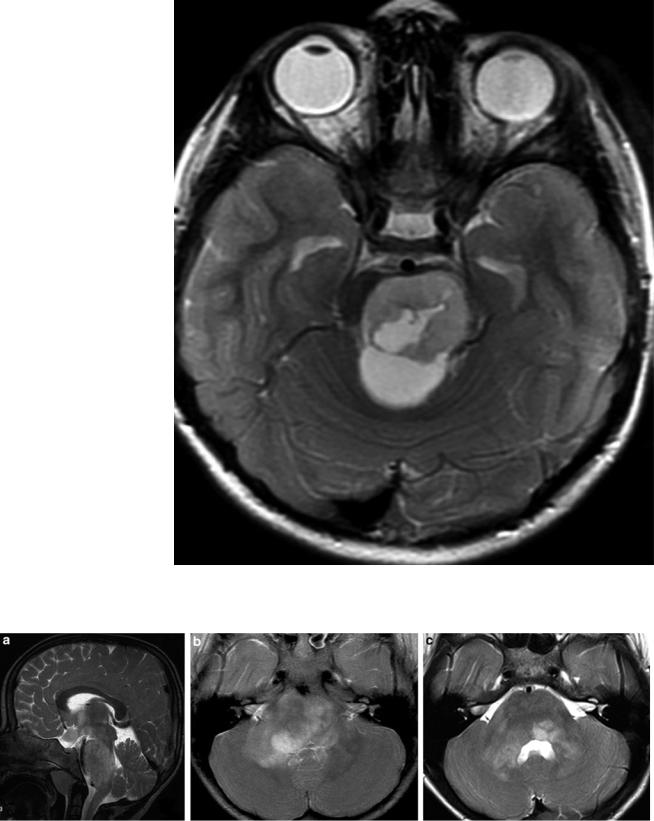
Fig. 46 Typical diffuse intrinsic pontine glioma (DIPG) despite an obvious anterior exophytic protrusion. The definition on imaging includes a main localization within the pons, affecting more than half of the pons, and a diffuse growth in the pontine fibers. True cysts (in distinction from necroses) are very unusual
even completely resolved. From time to time, a level of spinal intradural blood after surgery can be observed and resolves spontaneously as well.
Exclusively T1-weighted images after application of contrast agent are required to visualize possible spinal leptomeningeal dissemination. Rarely T2-weighted MRI is useful for the identification of small leptomeningeal nodules. Clinical practice in the reference evaluation of children with brain tumors has shown that the T1W sequence after contrast application is usually the last of the standard spinal MR sequences. Consequently, these important postcontrast T1 images are very often deteriorated by movement artifacts in no longer compliant, awake patients or by a flattening of sedation versus the expected end of the MR examination in sedated patients. Therefore, we advice to concentrate on the T1 after the contrast enhancement only. In case of doubt, theT2-weighted MRI may be added thereafter. If a fatty filum terminale is suspected, an additional T1 with fat suppression can clarify the situation. Small deposits of leptomeningeal
disease may be mistaken for physiologic vessels of the spinal cord. Vessels are easily depicted if axial slices are performed in all areas showing possible vessel enhancement on the sagittal slices.
3.5Follow-Up Examinations
Response of tumors is traditionally evaluated by size measurement. Therefore, comparable imaging parameters have to be used to guarantee as much accuracy as possible. In tumors only measurable on T2/FLAIR images like DIPG or nonenhancing tumors, a second plane of one or both of these sequences should be provided to enable a volume calculation. In pilocytic astrocytomas, an intensification of enhancement or a new contrast enhancement must not be mistaken for a malignant degeneration and progression. In these tumors, enhancement is strongly varying and not related to prognosis with (Lesniak et al. 2003) and also without treatment (Gaudino et al. 2012).
MR Imaging of Brain Tumors |
49 |
|
|
Fig. 47 This tumor of the pons was unusual for a DIPG because of a cyst besides a long duration of clinical complaints. Histological examination revealed a pilocytic astrocytoma
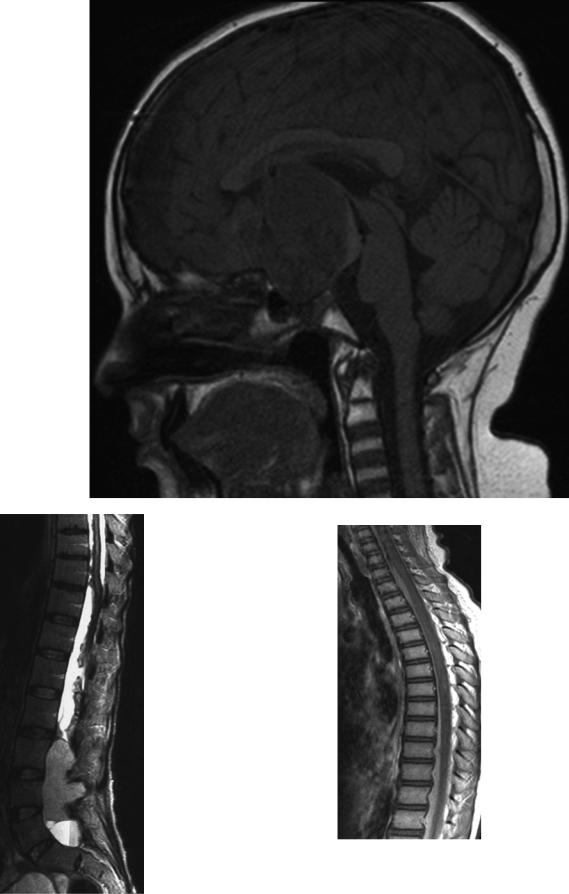
Fig. 48 Sagittal (a) and axial (b) T2-weighted images of a 4-year-old child with neurofibromatosis I and only very mild brainstem symptoms. Five years later (c) the swelling of the pons markedly regressed
50 |
E. Hattingen and M. Warmuth-Metz |
|
|
Table 3 Typical MRI features useful for the differential diagnosis of the most frequent tumor entities of the suprasellar region in children and young adults. Sarcoidosis is not common in children and may be omitted in the differential diagnosis
Histology |
LGG |
GCT |
Craniopharyngioma |
LCH |
Sarcoidosis |
T2 |
Hyperintense |
Isointense |
Mixed |
Hypointense |
Hypointense |
Enhancement |
± |
+ |
+ |
+ |
+ |
Internal structure |
Often solid/cysts |
Solid/small cysts |
Predominantly cystic |
Solid |
Solid |
|
possible |
possible |
|
|
|
HHL signal |
+ |
– |
|
– |
? |
LGG low-grade glioma, GCT germ cell tumor, LCH Langerhans cell histiocytosis
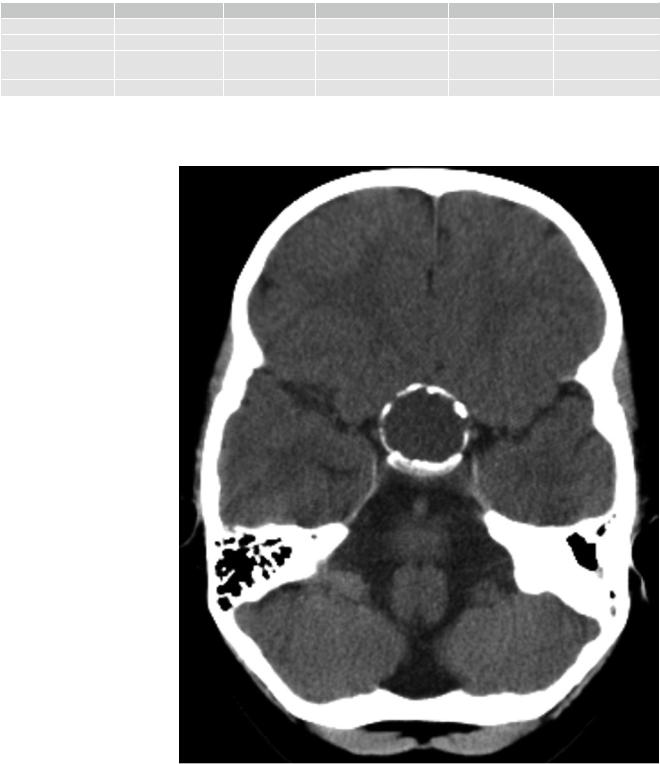
Fig. 49 A circular calcification on CT (soft tissue reconstruction mode) is characteristic for an adamantinous craniopharyngioma
MR Imaging of Brain Tumors |
51 |
|
|
Fig. 50 A large partly solid craniopharyngioma of the intraand suprasellar region has caused a loss of the physiologic bright signal of the posterior pituitary gland on unenhanced T1-weighted image. This feature is the imaging correlate of a diabetes insipidus
Fig. 51 Leptomeningeal siderosis with nodular and laminar areas of signal loss on a T2-weighted lumbosacral MRI in a patient with a large ependymoma of the filum terminale
Fig. 52 The spinal MRI (T1-weighted sequence after contrast) performed in the early postoperative period after resection of a medulloblastoma shows subdural enhancing structures protruding into the spinal canal from the outer dural margins. This nonspecific postoperative phenomenon precludes a reliable exclusion or diagnosis of leptomeningeal dissemination. Therefore, the staging MRI has to be repeated, and these nonspecific changes usually disappear quickly