

MR Spectroscopic Imaging |
67 |
|
|
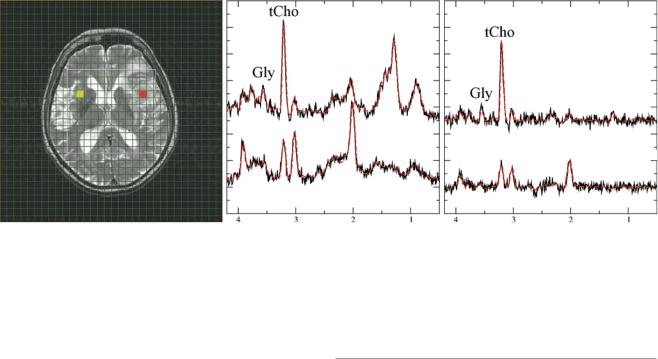
TE = 30 ms TE = 144 ms
Fig. 6 Diagnostic information from combined long and short TE spectra in high-grade gliomas. Short (30 ms, middle panel and long (144 ms, right panel) TE spectra from glioma grade IV. The upper traces represent tumor tissue from the red-marked voxel in the MRI, while lower traces show contralateral normal-appearing tissue (yellow-marked voxel
in the MRI). Note that only the short TE spectrum of the tumor shows a prominent lipid signal at 1.3 ppm. The signal at 3.6 ppm in normalappearing tissue almost disappears at the long TE, while this signal is clearly visible in tumor tissue for both TE. This indicates that the signal in tumor rather originates from glycine than from myoinositol
IDH1 mutations have signiÞcant higher GPC concentration levels compared to tumors without this mutation (Constantin et al. 2012). Studies in endometrial and ovarian cancers showed that higher activity of the GPC-cleaving enzyme glycerophosphodiesterase increases migration capacity of tumor cells (Papanagiotou et al. 2007). High activity of this enzyme lowers the GPC concentration releasing free choline which can be converted into PCho.
Most of the in vitro results were obtained from tumor cell cultures or tumor xenografts in animal models, representing cells growing as focal mass similar to the majority of body tumors. In contrast, diffuse human gliomas frequently inÞltrate large areas of normal brain tissue without signiÞcant functional and structural impairment of the host tissue until tumor necrosis and angioneogenesis occur. The prototype of this growth pattern is the gliomatosis cerebri which largely inÞltrates different lobes of the brain by sparsely distributed glioma cells in mostly oligo-symptomatic patients. Further, the mitotic rate of human gliomas is quite low compared to most experimental tumor models. Thus, concentrations of metabolites indicating growing tumor cells might be below the detectable limit due to large contributions from regular brain tissue. However, cells from inÞltrated normal brain tissue may react to the presence of tumor cells by changing their metabolism too. Some metabolites detected in gliomas by proton spectroscopy may represent this activated non-neoplastic brain tissue. Especially myoinositol and creatine, which are increased in gliomatosis cerebri and some low-grade tumors, seem to be rather markers of reactive gliosis than indicators of typical tumor metabolism (Hattingen et al. 2008).
3Tumor Grading and Heterogeneity
MR spectroscopy is only one part in the diagnostic work-up of a space-occupying lesion. There is neither a speciÞc tumor metabolite nor a speciÞc spectroscopic pattern which allows unambiguous diagnosis of a glioma. Further, larger glial tumors are commonly heterogeneous with regard to their malignancy and invasiveness, yielding regional-dependent spectral pattern which can be determined with MRSI. Consequently, this is the method of choice to depict tumor heterogeneity which is manifested in heterogeneous distribution of metabolite concentrations (Fig. 1). Further, the location of the MRSI slice can be adjusted to sample the contralateral side providing individual reference metabolite concentrations from normal-appearing brain tissue in the same measurement. In tumors with vast necrotic areas, a vital debris dilutes all metabolites and sometimes only gives rise to large lipid signals which may even spoil the spectral quality (Fig. 2c).
Fortunately, there is a spectroscopic pattern which is very characteristic for gliomas. As already mentioned, gliomas have high tCho signals reßecting higher membrane turnover and cellular density, whereas NAA as marker of viable neuronal tissue is considerably lowered. Thus, drawing a line connecting the tCho peak with the NAA peak normally yields a positive slope, while for non-necrotic high-grade gliomas, the slope is negative (Fig. 4b). Diagnosis of a cerebral tumor is unlikely if the NAA concentration is normal and partial volume effects are excluded (Papanagiotou et al. 2007; Hattingen et al. 2010). Although regular NAA concentrations rule out tumor diagnosis, a decreased NAA signal is not