

MR Spectroscopic Imaging |
61 |
|
|
can be easily distinguished from lipid (Kuesel et al. 1996), since only lactate shows a doublet signal (i.e., two peaks of identical intensity separated by 7.4 Hz) which will be inverted at an echo time of 135 ms (Fig. 2). At B0 Þeld strength of 3 T, the doublet structure of lactate may be less visible due to increased line broadening at higher Þeld strengths but signal inversion can still be exploited for discrimination of lactate from lipid.
a
2Tumor Metabolism
A major characteristic of brain tumors is the altered metabolism. In recent years it has become clear that biological modiÞcations in tumor tissue are evident through metabolic alterations which may be of great importance in therapy resistance (Tennant et al. 2010). This chapter describes changes in metabolic pathways which are typical for tumor tissue and can
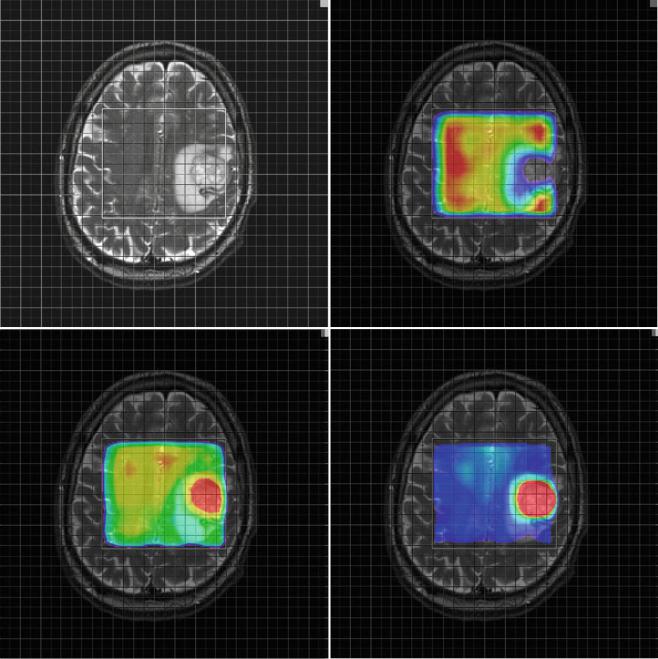
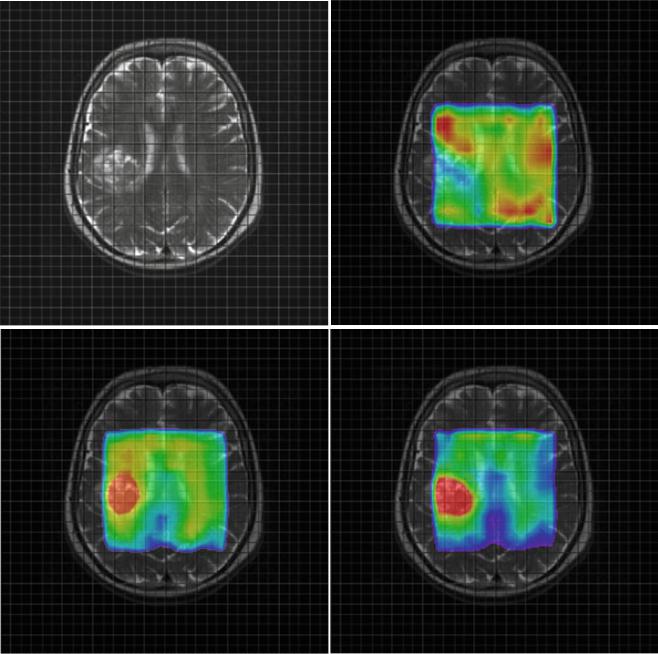
Fig. 3 Parameter maps for NAA (upper right) Cho (lower left) and the ratio Cho/NAA (lower right) from a glioblastoma (a) and a metastasis (b). Note the higher relative ratio Cho/NAA compared to the normal tissue in the glioblastoma (a) compared to the metastasis (b) due to a
marked increase of choline signal intensity in the glioblastoma (a). The Cho/NAA ratios of the glioblastoma (a) are moderately increased outside the tumor mass, indicating tumor cell inÞltration. In contrast, the Cho/NAA map of the metastasis shows clearer margins of the tumor (b)
62 |
E. Hattingen and U. Pilatus |
|
|
b
Fig. 3 (continued)
be measured by MR spectroscopy. Identifying those features may be useful for the diagnosis or treatment of brain tumors.
Tables 1 and 2 show an overview of the most important 1H and 31P metabolites for brain tumors. Representative 1H and 31P spectra from gliomas with different tumor grades are shown in Figs. 4 and 5.
A basic metabolic alteration in malignant cells is the phenotype which performs aerobic glycolysis even in the presence of oxygen whereas oxidative phosphorylation is suppressed (Warburg 1956). Enhanced lactic acid production through glycolysis causes extracellular acidosis. To counter-
act the intracellular proton accumulation, the activity of H+ extruding and buffering pathways like the Na+/H+ exchanger or the transmembrane carbonic anhydrases is upregulated (Chiche et al. 2009; McLean et al. 2000). Thus, the extracellular environment gets more acidic while the intracellular pH increases. The maintenance of an alkaline intracellular pH in tumor cells supports cellular proliferation, whereas extracellular acidosis promotes angiogenesis. Phosphorus spectroscopy is the only noninvasive method measuring both intracellular pH and the high-energy phosphate compounds ATP and PCr (Negendank 1992; Hattingen et al. 2011).
MR Spectroscopic Imaging |
63 |
|
|
Suppressed oxidative energy metabolism as a result of tumor hypoxia and repressed mitochondrial function may induce a decrease in high-energy phosphates like ATP and phosphocreatine (Papandreou et al. 2006).
Further, energy consumption is increased in neoplastic transformations to provide protein and nucleotide synthesis (Susa et al. 1989). The glycolytic pathway is linked with
amino acid production. Serine as intermediate from 3-phosphoglycerate seems to be increased in proliferating cells (Snell 1984). Serine hydroxymethyltransferase, catalyzing the reversible reaction of serine to glycine, is highly activated in cultures of rat glioma cells (Kohl et al. 1980). Glycine, one product of this reaction, is measurable by proton spectroscopy. It has been shown that glycine is increased
a
c
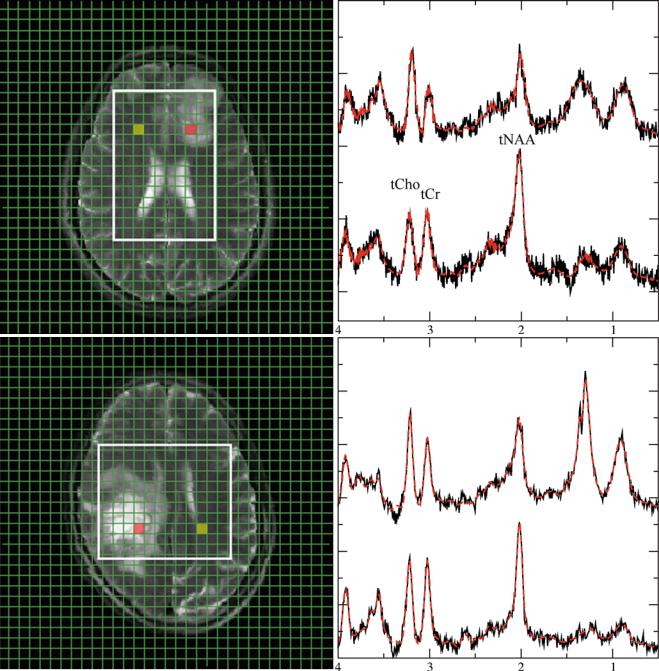
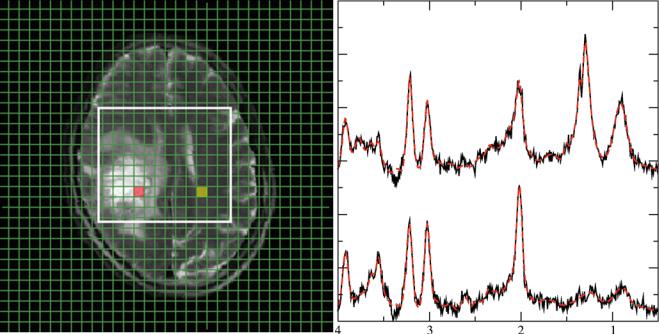
Fig. 4 Representative 1H spectra in gliomas of different WHO grades. Short TE (30 ms) from brain tumors depicting a low-grade (a), a grade III (b), and a heterogeneous grade IV tumor (c). Each panel with spectroscopic data shows spectra from the voxels marked in the respective MRI on the left with the upper trace referring to the tumor voxel (red)
and the lower trace referring to the contralateral, normal appearing tissue voxel (yellow). Due to its more frontal position, spectra from the low-grade tumor are broadened and therefore plotted with an extended y-scale. Note: The grade III tumor shows the most enhanced tCho signal
64 |
E. Hattingen and U. Pilatus |
|
|
c
Fig. 4 (continued)
in malignant gliomas (Jain et al. 2012; Lehnhardt et al. 2005; Hattingen et al. 2009; Kinoshita et al. 1994; Maudsley et al. 2014).Theotherproduct,5,10-methylene-tetrahydroxyfolate, is utilized for purine and nucleotide synthesis. Therefore, glycine might be considered as a surrogate marker of enhanced glycolysis and nucleotide synthesis.
However, the glycine signal is overlapping with the signal from myoinositol (MI) at 3.56 ppm, requiring special measures for discriminating MI from glycine as described in Chap. Future Methods in Tumor Imaging). Increased MI concentrations or ratios of MI to creatine were detected in tumors, but also in multiple sclerosis, AlzheimerÕs disease, and in other metabolic and inßammatory white matter diseases as well as in tuberous sclerosis. Common to all of these pathologies is augmented astrocytic proliferation and demyelinization. Therefore, the role of this metabolite in maintaining cell volume in reactive astrocytes is discussed (detailed discussion and references in Hattingen et al. 2008).
An increased choline signal intensity is frequently observed in 1H MRS data from tumor tissue (Figs. 3a, 4b, and 6) and has been attributed to rapidly proliferating cells (Herminghaus et al. 2002; Guillevin et al. 2008). In conjunction with the decrease of the NAA (N-acetyl-aspartate and N-acetyl-aspartylglutamate) signal intensity due to neuronal loss, the tCho/NAA ratio is considered as the most prominent marker for tumor tissue in MRS (Figs. 1, 3a, 4b, and 6). Modulations of phospholipid turnover, which is in part
described by the Kennedy pathway (Kennedy 1957), play a pivotal role in the tumor metabolism (Podo 1999). In brief, this pathway describes synthesis of phosphatidylcholine via choline and phosphocholine (PCho) and its breakdown via glycerophosphocholine (GPC). However, 1H MR spectroscopy detects only total choline (tCho) as the sum of free choline, PCho, and GPC. Consequently, 1H MRS cannot differentiate between PCho and GPC changes, whereas 31P spectroscopy can (Fig. 5). There is increasing evidence that the metabolites PCho and GPC play an important role in tumorigenesis with high PCho/GPC ratios indicating malignant phenotype of a brain tumor (Hattingen et al. 2013).
In vitro studies showed that PCho is the dominant membrane lipid metabolite in proliferating tumor cells and tumor tissues (Gillies et al. 1994). PCho is formed by phosphorylation of choline by the cholinkinase α which is over-expressed in many malignant tumors including glioma cell lines (Glunde and Bhujwalla 2007). Several oncogenes increase choline kinase activity and hypoxia-inducible factor 1 alpha signaling upregulates choline kinase expression (Glunde et al. 2008). Apart from its role as a phospholipid membrane precursor, PCho may also act as a second messenger in cell growth signaling (Gillies et al. 1994; Cuadrado et al. 1993; Aiken and Gillies 1996). Aiken and Gillie 1996 found increased PCho content of rat glioma cells, which decreased during the conversion from the exponential growth to stationary growth phase. Ex vivo MR spectroscopic
MR Spectroscopic Imaging |
|
|
|
65 |
|
|
|
|
|||
Table 2 Metabolites measurable with in vivo 31P MR phosphorus spectroscopy in brain tumor |
|
|
|||
Metabolite |
Peak |
Biology |
Marker |
Increase |
Decrease |
Phosphocholine |
6.2 ppm |
Precursor of the membrane |
Tumor cell |
Proliferating |
Putative decrease |
PCho, PC |
|
phospholipid |
proliferation |
high-grade glioma |
under HIF1α |
|
|
phosphatidylcholine |
|
cells (animal model) |
inhibitor treatment |
|
|
(lecithine) |
|
Elevated PCho/GPC |
(Venkatesh et al. |
|
|
Cho phosphorylation is |
|
implies |
2012)a |
|
|
catalyzed by choline kinase |
|
transformation of |
|
|
|
(CK) |
|
grade II to grade IV |
|
|
|
High levels of expression and |
|
glioma (Elkhaled |
|
|
|
activity of CK promotes tumor |
|
et al. 2014)a and |
|
|
|
cell growth |
|
GBM progression |
|
Glyceropho- |
2.9 ppm |
Metabolite of the degradation |
|
Low-grade glioma |
High-grade glioma |
sphocholine |
|
pathway of phosphatidyl- |
|
(relative increase to |
(Elkhaled et al. |
GPC |
|
choline by phospholipases |
|
tCho) (Righi et al. |
2014; Righi et al. |
|
|
|
|
2009) |
2009; Venkatesh |
|
|
|
|
|
et al. 2012) |
|
|
|
|
|
rGBM (Hattingen |
|
|
|
|
|
et al. 2013) |
Phospho- |
6.8 ppm |
Precursor of the membrane |
Tumor cell |
In vivo tumors |
|
ethanolamine |
|
phospholipid |
metabolism |
(Mintz et al. 2008) |
|
PEth, PE |
|
phosphatidylethanolamine |
|
Elevated PEth/GPE |
|
|
|
(cephaline) |
|
in rGBM (Hattingen |
|
|
|
|
|
et al. 2013) |
|
|
|
|
|
Lymphoma (ex vivo |
|
|
|
|
|
liquid |
|
|
|
|
|
chromatography) |
|
|
|
|
|
(Kinoshita et al. |
|
|
|
|
|
1994) |
|
Glycerophospho- |
3.5 ppm |
Metabolite of the degradation |
Putative marker of |
Tumor cell |
Recurrent GBM |
ethanolamine |
|
pathway of phosphatidyl- |
GBM |
apoptosis (rat |
(Hattingen et al. |
GPE |
|
ethanolamine by |
|
glioma) (Valonen |
2013) |
|
|
phospholipases |
|
et al. 2005)a |
|
Phosphocreatine |
0.0 ppm |
Reserve of high-energy |
High-energy storage |
ATP/Pi increase |
Brain tumors (rat |
PCr |
|
phosphates |
|
under BCNU |
glioma) (Ross et al. |
|
|
Donator of the phosphate |
|
(animals) |
1988), rGBM |
|
|
group to ADP to form ATP |
|
|
(Hattingen et al. |
|
|
catalyzed by phosphokinase |
|
|
2013) |
Adeosine |
−2.5 ppm (doublet) |
High-energy source for many |
High-energy |
Not clear (most |
(Pre)treated brain |
triphosphate |
−7.6 ppm (doublet) |
cellular processes such as cell |
metabolism |
studies used ratios), |
tumors (animal |
ATP |
−16.1 ppm (triplet) |
division and biosynthetic |
|
ATP/Pi increase |
tumors, rGBM) |
|
|
reaction |
|
under BCNU |
(Naruse et al. 1985; |
|
|
ATP is replenished from ADP |
|
(animals) |
Hattingen et al. |
|
|
an Pi mainly by energy from |
|
|
2013) |
|
|
cellular respiration |
|
|
|
Inorganic phosphate |
4.7Ð5.4 ppm |
Low-energy state of phosphate |
Part of |
(Pre)treated brain |
|
Pi |
(position changes |
|
phosphokinase |
tumors (animal |
|
|
with pH) |
|
reaction |
tumors, rGBM) |
|
|
|
|
|
(Naruse et al. 1985; |
|
|
|
|
|
Hattingen et al. |
|
|
|
|
|
2013) |
|
Intracellular pH |
Chemical shift |
Upregulation of H+ extruding |
Intracellular H+ |
Intracellular |
|
|
difference between |
and buffering pathways (Na+/ |
production (through |
alkalosis in |
|
|
PCr and Pi |
H+ exchanger, transmembrane |
glycolysis) |
high-grade gliomas |
|
|
|
carbonic anhydrases) |
|
(Oberhaensli et al. |
|
|
|
More acidic extracellular |
|
1986) |
|
|
|
environment enhances the |
|
|
|
|
|
tumor invasiveness and |
|
|
|
|
|
angiogenesis |
|
|
|
Chemical shift values are referenced to PCr, which was set to 0 ppm
aObservations are results from ex vivo proton high-resolution magic angle spinning spectroscopy
66 |
E. Hattingen and U. Pilatus |
|
|
a
b
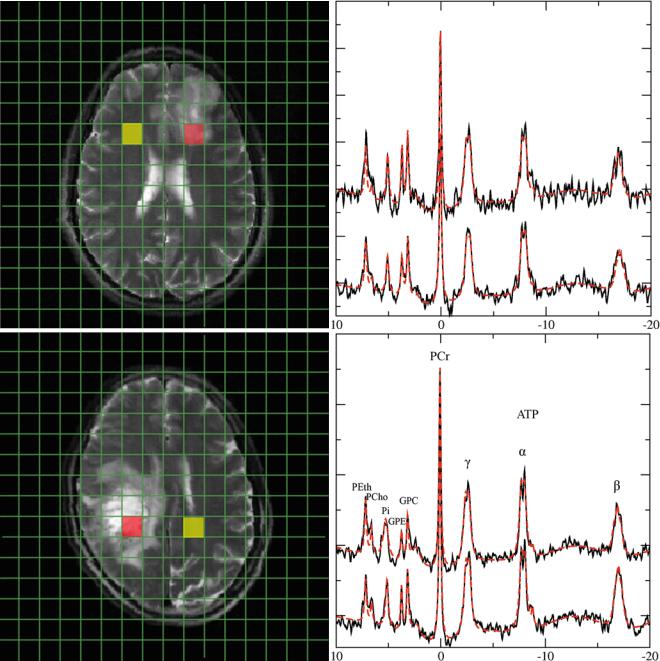
Fig. 5 Representative 31P spectra in gliomas of different WHO grades. 31P spectra from a low-grade glioma (a) and a heterogeneous glioma grade IV (b). Upper traces represent data of tumor tissue from the redmarked voxel in the MRI, while lower traces refer to the contralateral normal-appearing tissue from the yellow voxel in the MRI. Note:
Increased GPE and PE signals in the low-grade tumor, while GPE is decreased in the glioma grade IV. Broadening of the inorganic phosphate signal in the glioma grade IV indicates increased intracellular pH in the tumor tissue
studies of human brain tumors could further show that the PCho concentration is increased in high-grade gliomas compared to low-grade tumors (McKnight et al. 2011; Vettukattil et al. 2013), but the same studies yielded inconclusive results regarding the GPC concentrations in these glioma speci-
mens. It remains unclear whether low-grade gliomas have higher GPC concentrations compared to high-grade tumors. The amount of GPC might be predominantly inßuenced by molecular genetic markers and not by the tumor grade. It has been shown that glioma tissue specimens with oncogenic