


Diffusion-Weighted Methods
Peter Raab and Heinrich Lanfermann
Contents
1 |
Methods.................................................................................. |
\ |
99 |
|
2 |
Microstructural Changes...................................................... |
\ |
102 |
|
3\ Tumor |
Grading, Typing, and Heterogeneity...................... |
\ |
103 |
|
4 |
Prognostic Marker................................................................. |
\ |
106 |
|
5 |
Treatment Monitoring........................................................... |
\ |
107 |
|
Conclusion.................................................................................... |
\ |
108 |
||
References |
..................................................................................... |
\ |
108 |
|
Abstract
During the last two decades the technical advancements of Diffusion Weighted Imaging have enabled the precise and repeatable characterization of brain tumor microstructure non-invasively, mainly by the use of the apparent diffusion coefficient (ADC) as a biomarker. This has led to many applications aiding in tumor grading, prognosis assessment and treatment monitoring.
Diffusion-weighted imaging (DWI) has been widely investigated for tumor imaging to localize a tumor, to estimate its borders, and to discriminate nonneoplastic masses from proliferating tumors or tumor types and grades. Further DWI was used for the separation of tumor infiltration from reversible edematous tissue changes, the detection of white matter tracts for surgical planning and postsurgical controls, the monitoring of radiation or drug therapy response of tumors, and the separation of recurrent tumor from radiation necrosis (Field and Alexander 2004). Diffusion-weighted imaging contributes pathophysiological as well as microstructural information and is therefore another piece in the puzzle of the whole picture of a brain tumor.
P. Raab, MD (*) • H. Lanfermann, MD, PhD
Institute of Diagnostic and Interventional Neuroradiology, Hannover Medical School, Carl-Neuberg-Str. 1, Hannover 30625, Germany
e-mail: raab.peter@mh-hannover.de; Lanfermann.Heinrich@MH-Hannover.de
1\ Methods
Diffusion is a natural molecular transport mechanism caused by thermal energy, leading to perpetual random mixing of molecules. In biological systems this thermal motion, which is described by Brown’s law (Brown 1828), is dominating over diffusion caused by concentration differences being described by Fick’s first law (Fick 1855). In water, as an example of a free medium, this random mixing of molecules leads to a three-dimensional Gaussian displacement distribution of the molecules (Le Bihan 1995; Basser and Özarslan 2009; Le Bihan and Johansen-Berg 2012). During a given amount of
E. Hattingen, U. Pilatus (eds.), Brain Tumor Imaging, |
99 |
Med Radiol Diagn Imaging (2016)
DOI: 10.1007/174_2016_1052, © Springer Berlin Heidelberg

100 |
P. Raab and H. Lanfermann |
|
|
time, the molecules can randomly travel a certain distance, which is best described by the diffusion coefficient “D”:
\ |
X 2 |
= 2DTd \ |
|
|
X2 – average mean-squared diffusion distance along one direction
D – diffusion coefficient
Td – diffusion time (adopted from Le Bihan and JohansenBerg 2012)
The diffusion coefficient is dependent on the medium and its viscosity, the size of the diffusing molecule, and the temperature. In biological systems, the microstructural features of the environment also influence the diffusion coefficient, leading to a non-Gaussian displacement distribution. Compared to free water, the diffusion coefficient is reduced in biological tissues due to the interaction of the molecules with cells, cell membranes, fibers, or macromolecules (Le Bihan and Johansen-Berg 2012). During a short diffusion time, the diffusion coefficient is mainly influenced by the viscosity of the medium, and at longer diffusion times the effect of the microstructure becomes more important. This is the main effect for MR diffusion imaging given the typical MR diffusion sequences and their parameters. Although the typical MR image resolution is in the mm scale, the underlying diffusion characteristics caused by the interaction of macromolecules with tissue microstructure are in the μm scale. Therefore, diffusion-weighted imaging provides clues about microstructure and geometric organization of healthy as well as pathologically altered tissues.
The basics for nowadays DWI methods were laid down by Purcell and Carr (Purcell et al. 1946; Carr and Purcell 1954), Hahn (1950) as well as Stejskal and Tanner (1965). One of the first diffusion-weighted human brain images was published in 1986 by LeBihan et al. (1986). The sequences used today still rely mainly on the pulsed field gradient (PFG) method. This method uses gradients for labeling space along a certain direction and time and sensitizes the MR signal to molecule/proton displacement. Molecule displacement leads to signal attenuation, A, which is linked to the diffusion coefficient, D, by
\ |
A= exp(−bD) \ |
|
b represents the so-called b-factor, which is a function of timing, amplitude, and length of the diffusion gradients (Le Bihan and Johansen-Berg 2012; Le Bihan et al. 1986). The degree of diffusion weighting can be set by the value of b, and higher b-values lead to increased diffusion weighting. A b-value of zero leads to an image without diffusion encoding. In order to get quantitative diffusion images, one has to acquire images without and with diffusion encoding (b0 and b) and calculate D based on the equation mentioned before.
A typical b-value for the brain is 1,000 s/mm2. It is advisable as well to acquire diffusion-weighted images with at least three different direction encodings in order to get so-called combined “trace” DW images and an apparent diffusion coefficient (ADC) being independent of the head orientation in the scanner. The trace is the sum of the three orthogonal diffusion coefficients; the orientationally averaged mean diffusivity (MD) can be thought of trace/3 (Jones 2009). LeBihan introduced the global statistical parameter of apparent diffusion coefficient in 1986 since the MR imaging scale is much bigger than the microscopic diffusion scale and since the estimation of the real diffusion coefficient D and diffusion process is challenging and the diffusion coefficient in biological tissues appears to be smaller than in free water (Le Bihan et al. 1986).
The preferred sequence type for DWI is single-shot echo planar imaging, which is robust in spite of artificial head motion and allows for rapid acquisition. On the downside this sequence type is susceptible to magnetic field distortions leading to geometric warping, eddy currents, and ghosting artifacts leading to geometric warping as well (Jones and Cercignani 2010; Pipe 2009) and intravoxel dephasing effects on image resolution, which have to be accounted for in data analysis. The distortions and artifacts are most pronounced at the skull base and close to tissue calcifications and hemorrhages. Recent developments of DW sequences led to reduced distortions and better image quality (e.g., Maier et al. 1998; Bammer 2003).
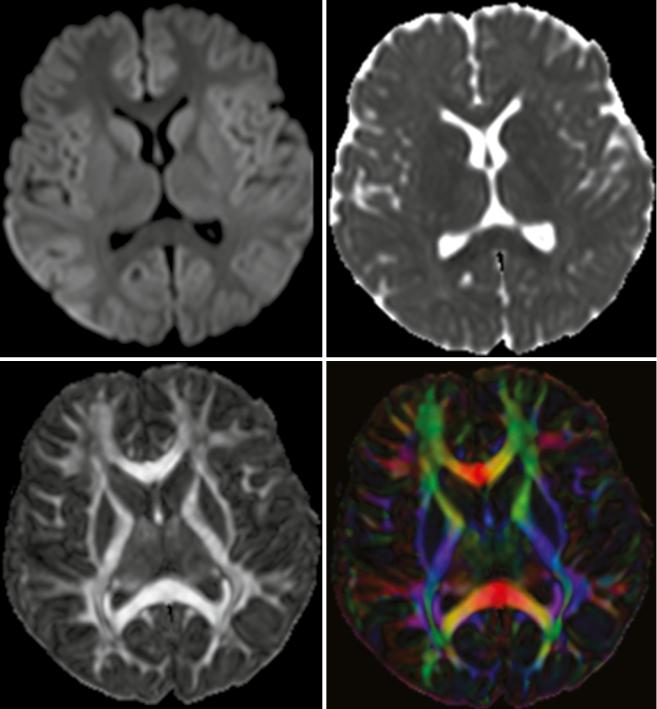
A more detailed characterization of the diffusion process can be realized with at least six different diffusion direction encodings allowing for the calculation of the diffusion fractional anisotropy (FA) and eigenvalues (Basser 1995; Basser and Pierpaoli 1996; Chenevert et al. 1990, 2006). The diffusion tensor means a mathematical 3D model of the diffusion in space, being represented by an ellipsoid whose dimensions are given by the eigenvalues and estimate the diffusivity in the respective direction. Diffusion anisotropy is a unit-less number and represents the amount of diffusion directionality within one voxel; its value ranges between zero and one (see Fig. 1). Anisotropy in the brain is mainly dependent on the organization of white matter in bundles of differently myelinated axon fibers with parallel orientation, and the diffusion speed along the fiber axis is faster compared to a perpendicular direction by a factor of 3–6x for myelinated fibers (Le Bihan and Johansen-Berg 2012). Information about diffusion anisotropy and eigenvalues is part of diffusion tensor imaging (DTI) and can be transferred into tractography (Basser et al. 1994; Le Bihan and van Zijl 2002), which allows for the reconstruction of primary diffusion directions representing white matter fiber tracts (Lazar 2010). Basis for this tensor calculation is a mathematical model, which assumes a 3D Gaussian diffusion in a voxel and a monoexponential signal decay during the diffusion
Diffusion-Weighted Methods |
101 |
|
|
Fig. 1 Normal diffusion-weighted image (b = 1,000 s/mm2) of a 6-year-old child (top left). Typical ADC images (top right). Parameter map of fractional anisotropy (FA) as intensity map (bottom left); high intensity indicates high anisotropy like in the corpus callosum. Color-
coded FA parameter map; the colors indicate the main diffusion direction within the voxel (red right to left, green anterior to posterior, blue cranial to caudal). Color mixtures are possible depending on the diffusion direction
experiment, both of which are not always true in biological tissues. Nonetheless, DTI and tractography are widely used, and they have proved to be helpful in understanding normal brain structure as well as in detecting changes caused by various diseases.
Recent developments introduced a new diffusion metric called diffusion kurtosis imaging (DKI), which can be calculated from data with at least 15 direction encodings and 2 nonzero b-values (Jensen et al. 2005; Lu et al. 2006; Tabesh et al. 2010). DKI describes the non-Gaussian water movement in

102 |
P. Raab and H. Lanfermann |
|
|
biological tissues and can be interpreted as quantitative characterization of microstructural tissue complexity. It is a model-free approach to diffusion characterization.
By the use of an extended b-factor range of up to 5,000 s/ mm2 without calculation of the kurtosis, one can also analyze the non-monoexponential diffusion-related signal decay (Maier et al. 2010; Mulkern et al. 2009). This approach is also not yet part of routine imaging due to increased scanning times, a rather difficult mathematical fitting of the data and debatable models and assumptions; so is the mathematical basis only valid for a single diffusion-encoding direction. This approach assumes that there are slow and fast diffusing water pools within the tissue with slow and fast diffusion coefficients, respectively. This method cannot be used widely in anisotropic tissues, but usually the anisotropy in the core of brain neoplasms is rather low (Maier et al. 2010). Following this idea one can try to explain differences of ADC values between different tumors, for instance, by different slow or fast diffusing water pool sizes, thereby supposing that slow diffusing water molecules are closely located to proteins or cellular membranes inside of the cells.
Diffusion-weighted imaging can also be used for an estimation of tissue perfusion. Already early during the development of diffusion-weighted imaging, LeBihan and colleagues described an influence of the microcirculation on the diffusion-weighted signal attenuation (Le Bihan et al. 1986).
Intravoxel incoherent motion (IVIM) caused by blood flow within capillary vessels leads to a distribution of phases during the influence of magnetic field gradients; this phase distribution then leads to signal attenuation of the voxel. The IVIM effect can be observed at b-values below 300 s/mm2 and is still under investigation (Le Bihan 2012; Federau and O’Brien 2015).
In 2009 a consensus report summarized the recommendations for using diffusion-weighted imaging as a cancer biomarker (Padhani et al. 2009).
Therefore, DWI sequences should be part of standard MR examination in patients with cerebral masses and in patients under treatment of a brain tumor.
2\ Microstructural Changes
Two distinct compartments are in the brain based on their main diffusion characteristics, which influence quantitative comparisons. The anisotropic compartment and its microstructure is mainly accounted for by the white matter contents, which are densely packed axons with their myelin sheets, the macroglia consisting of oligodendrocytes and astrocytes, and the microglia. Intracellular neurofilaments and microtubules with their associated axonal transport
mechanisms might also contribute to diffusion characteristics (Beaulieu 2009), although in vitro experiments question this (Beaulieu and Allen 1994a, b; Takahashi et al. 2002). In gray matter as the more isotropic compartment, the neurons and their directionally varying connections, tangles of dendrites, axon endings, and glial cell processes are the basic determining components for the microstructure. Mean diffusivity is very similar in white and gray matter, although the anisotropy is varying greatly among these tissue types. Even within the normal white matter, FA values as the measure of anisotropy vary depending on the tissue composition, being influenced by the number of axons, axon density and size, packing, myelin thickness, and amount of crossing fibers (Pierpaoli et al. 1996). Typical ADC values for normal white matter are about 0.7 μm/ms2 (Maier et al. 1998) and for deep gray matter about 0.75 μm/ms2 (Helenius et al. 2002), and these values are valid for a b-value of 1,000 s2/mm. Besides this also MR acquisition parameters (e.g., b-value, diffusion time, SNR, matrix) influence the calculated diffusion parameters.
Based on this it is not possible to compare one tract in the brain with another and to infer the myelin thickness or number of axons from diffusion values, for instance (Beaulieu 2009). However, if one compares diffusional characteristics longitudinally or specific tracts and brain structures between patients and controls, interpretations can become possible.
Tumors can have several effects on the surrounding tissues leading to microstructural changes. They can cause (1) dislocation of normal structures, (2) infiltration of adjacent tissue, (3) destruction of neighboring structures like white matter tracts, or (4) edema formation (Maier et al. 2010); in reality one can find a mixed pattern with no clear differentiation between these effects. Tumors itself differ from each other with respect to cellularity, microstructural complexity, amount of necrosis, and vascularity.
ADC values of brain tumors span a broad range from about 0.6*10−3 mm2/s in case of medulloblastomas to about 2.5*10−3 mm2/s in case of dysembryoplastic neuroectodermal tumors (Yamasaki et al. 2005). In most tumors, the ADC values are reported to be higher than ADC values of normal brain tissue, indicating microstructural differences between the two. Due to peritumoral edema with ADC values of about 1.3 mm2/s, it can be difficult to determine the tumor border by ADC values alone. The tumor-infiltrated edema surrounding gliomas has been the focus of several investigators, trying to find differences from pure vasogenic edema surrounding meningiomas or metastases (Kono et al. 2001; Provenzale et al. 2004; Pavlisa et al. 2009; Lee et al. 2011). Kono et al. (2001) as well as Provenzale et al. (2004) found no significant ADC differences in the peritumoral edema of glioblastomas and

Diffusion-Weighted Methods |
103 |
|
|
meningiomas, whereas Lee et al. (2011) found a higher minimum ADC around glioblastomas compared to metastases. When using FA as the diffusion marker, the results were differing. Provenzale found lower peritumoral FA values in gliomas compared to meningiomas, while no difference was found in studies comparing FA values around gliomas and metastases (Lu et al. (2003, 2004) and Tsuchiya et al. (2005)). In 2004 the group of Lu et al. (2004) introduced a “tumor infiltration index,” which they found to be helpful in differentiating edema around metastases, meningiomas, and gliomas. Based on the varying results, the detection of infiltrated edema based on ADC and FA values remains a challenge. Price et al. used diffusion tensor imaging for their approach to delineate glioma margins (Price et al. 2006). They employed an analysis method that separates the diffusion tensor into the isotropic and anisotropic components, and they reported the successful identification of the infiltrating glioma margins with high sensitivity and specificity (98 and 81 %, respectively).
3\ Tumor Grading, Typing,
and Heterogeneity
The gold standard of tumor grading nowadays is still the histopathological evaluation under the microscope of tissue characteristics like cell density, tissue architecture with cell arrangement, cellular atypia in size and shape and changes of the nucleus, as well as occurrence of microvessel proliferations and necrosis. Recently, genetic molecular profiling of brain tumors gained more interest, because important genetic alterations might be without histomorphological counterparts.
Diffusion-weighted imaging has the advantage of a more complete sampling of information of the whole tumor by probing the water diffusion over distances corresponding to cell sizes. In many studies an inverse relationship between ADC values and tumor grading has been described (Alvarez- Linera et al. 2008; Arvinda et al. 2009; Bai et al. 2011; Bulakbasi et al. 2004; Poretti et al. 2013), thereby also indicating an inverse relationship between ADC values and tumor cellularity – tumors with low grade tend to show higher ADC values, and higher-grade tumors tend to have lower ADC values in their solid parts. Such a relation was also shown for cerebral lymphomas and high-grade gliomas (Guo et al. 2002); in this ROI-based study, lower mean ADC values were found in lymphomas compared to high-grade gliomas. An explanation for this inverse relationship could be that the amount of membranes, which are obstacles to free diffusion, is increased with increasing cellularity. Maier et al. (2010) pointed out that within a certain tumor type also intracellular membranes like the endoplasmic reticulum can have
an effect on the diffusion coefficient, and schwannomas with their high cellularity but surprisingly high average ADC values were used by him as a counterexample. Low ADC values of highly cellular tumors could be caused by an increased fraction of slowly diffusing water pools within the tumor according to the fast and slow pool theory. Low-grade tumors might have a higher water content inside or between cells, so one has to consider other mechanisms like protein/water interactions as well besides cellular membranes being obstacles to diffusion. Alvarez-Linera et al. found increased DWI signals on high b-value images (b = 3,000 s/mm2) in highgrade gliomas, while the majority of the low-grade gliomas in their study group showed no areas of increased signal intensity (Alvarez-Linera et al. 2008). Increasing the b-value reduces the amount of the T2 shine-through leading to a higher conspicuity of tissues with restricted diffusion.
Using the recent development method of diffusion kurtosis imaging (Jensen et al. 2005; Jensen and Helpern 2003, 2010), we could show that kurtosis metrics were superior to diffusivity values in separating glioma grades, especially also WHO grades II and III (Raab et al. 2010). Van Cauter et al. confirmed our findings (Van Cauter et al. 2012).
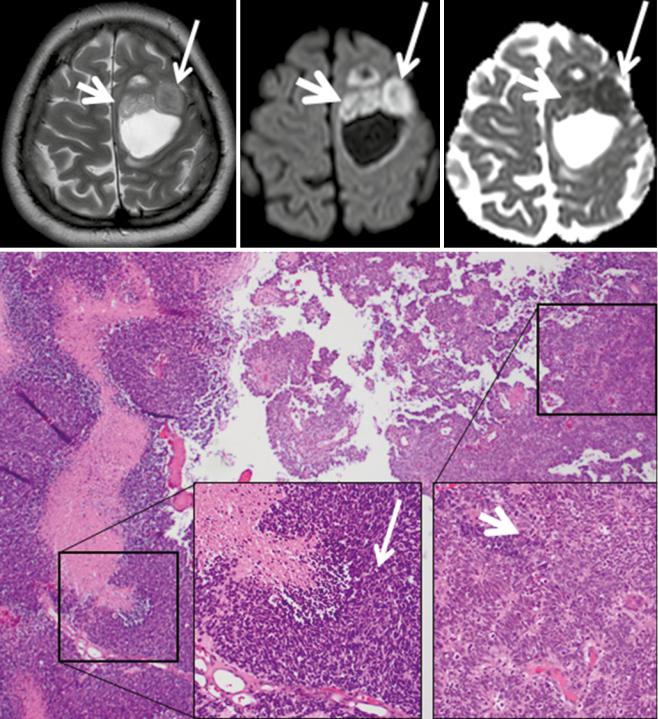
It is well known that brain tumors can be very inhomogeneous, making a decision, for instance, on the site of biopsy difficult. DWI can quickly cover the whole tumor and is able to show inhomogeneous tissue areas (see Fig. 2).
Apart from grading of gliomas, the characterization of different brain tumors and their subtypes has also been investigated with diffusion-weighted imaging. The discrimination between metastases and glioblastomas and especially the differential diagnosis of a single rim enhancing and centrally necrotic tumors can be difficult on standard MR imaging, since a cerebral abscess and hemorrhage can mimic these two tumor types based on standard imaging.
Early work already could demonstrate a clear benefit from diffusion-weighted imaging for the identification of an abscess by showing restricted diffusion within the cystlike cavity of the tumor representing the purulent fluid collection (Desprechins et al. 1999; Ebisu et al. 1996; Toh et al. 2011). One has to keep in mind that acute and subacute hemorrhages can present with reduced ADC values (Atlas et al. 2000; Busch et al. 1998; Ebisu et al. 1997) possibly mimicking a brain abscess in the situation of a hemorrhagic tumor.
For the separation of metastasis from glioblastomas, several studies have shown that lower ADC values in solid tumor parts tend to indicate metastasis (Byrnes et al. 2011), whereas higher peritumoral FA values indicate a glioblastoma (Tsuchiya et al. 2005). Certain tumor types can even be recognized almost only by diffusion-weighted imaging in combination with the tumor location. Central neurocytomas
104 |
P. Raab and H. Lanfermann |
|
|
Fig. 2 This tumor was diagnosed as glioblastoma based on molecular genetic as well as histomorphological markers. Histomorphology and DWI imaging reveal the heterogeneity of this tumor. The smaller thicker arrows indicate a tumor part with lower cell density and architectural remnants of pseudopalisading, and this area shows almost normal ADC values combined with elevated DWI signal. The longer
thinner arrows point at an area with very high cellularity, and the cells are positioned closely to each other without an order, and on MRI this corresponds to a nodule with lower T2w signal, strong DWI hyperintensity, and very low ADC values (Histologic images are by courtesy of Prof. F. Feuerhake, Neuropathology, Hannover Medical School, Germany; MR images by courtesy of Dr. Puschmann, Damme)
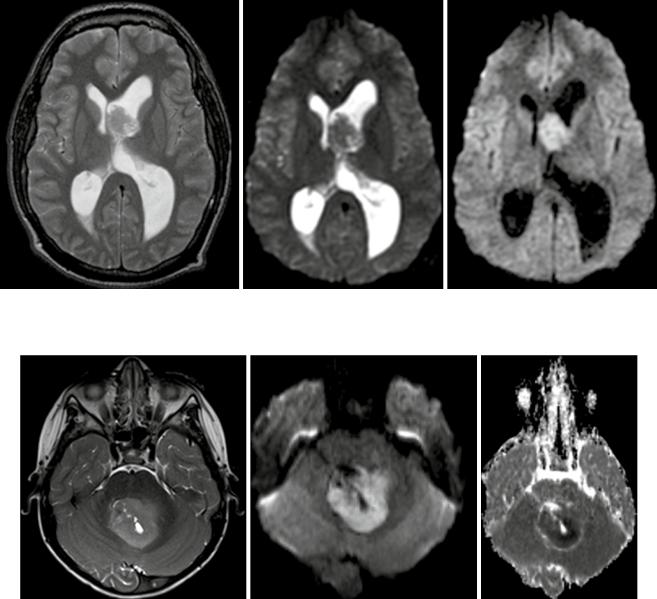
are typically located close to the foramen of Monroi, and they often show an intermediate T2w signal and may contain small cystic areas. The DWI signal is typically hyper-
intense with very low ADC values (see Fig. 3 (Kocaoglu et al. 2009; Tlili-Graiess et al. 2014)). Similar diffusion characteristics are found in medulloblastomas. This tumor
Diffusion-Weighted Methods |
105 |
|
|
Fig. 3 Central neurocytoma with typical T2w appearance, location, and restricted diffusion
Fig. 4 Typical medulloblastoma of the 4th ventricle with slightly hyperintense T2w signal, strongly elevated DWI signal and very low ADC values in the solid tumor parts (from left to right)
shows the lowest ADC values of pediatric brain tumors in the posterior fossa (Hattingen et al. 2008; Koral et al. 2013; Pierce et al. 2014) (see Fig. 4). Due to this feature, diffusion-weighted imaging is important for follow-up examinations, since even small metastases or recurrent tumors can be recognized by their high diffusion signal. Only the very rare atypical teratoid rhabdoid tumor (ATRT) can show the same increased diffusion signal intensity with low ADC values also in the posterior fossa (Koral et al. 2008). The other posterior fossa tumor types show higher ADC values than medulloblastomas, although, for instance, ependymomas might have smaller areas with low ADC values also.
A very typical DWI signal pattern is found in epidermoid tumors. They show a very hyperintense diffusion signal combined with CSF-like (cerebrospinal fluid) T2w signal intensity and almost normal parenchymal ADC values (see Fig. 5).
Tumefactive or tumorlike demyelinating lesions (TDLs) represent a differential diagnosis to gliomas. Compared to low-grade gliomas that show a homogenous ADC elevation,
these TDLs have centrally elevated ADC values surrounded by a rim of low ADC values (see Fig. 6). This rim represents the area of active inflammation, which is surrounded by elevated ADC values due to the surrounding edema (Hyland et al. 2013; Miron et al. 2013; Saini et al. 2011; Yacoub et al. 2011).