


56 |
E. Hattingen and U. Pilatus |
|
|
decades. Hitherto, MR spectroscopic studies investigated the sensitivity and diagnostic accuracy of MR spectroscopy in characterizing brain tumors and tumorlike lesions (Horsk‡ and Barker 2010). Taking into account that the accuracy is not sufÞcient to replace histopathological diagnosis, the value of time-consuming spectroscopic methods for differential diagnostic still remains limited. TodayÕs primary indications of MR spectroscopy in diagnostic settings should be:
(1) guiding stereotactic biopsy in heterogeneous or large nonnecrotic brain tumors, (2) avoiding surgery in asymptomatic patients with small brain tumors in eloquent brain areas or young patients with chronic partial epilepsy with ÒbenignÓ aspect, and (3) monitoring residual low-grade tumors after surgery. Monitoring high-grade gliomas after standard therapy (surgery, followed by radiation and chemotherapy) may be difÞcult or even impossible with proton MR spectroscopy. First, recurrent high-grade gliomas often occur at the margins of resection cavity and thus in areas with preexisting damaged brain tissue from radiation, peri-surgical infarction, and macroor microbleeds. Considering that metabolites other than lipids are only present in solid and vital tumor tissue, partial volume effects from necrotic and hemorrhagic tissue may affect the metabolite concentration obtained for the targeted voxel. Second, many malignant brain tumors are located in the temporal or frontobasal lobes. In these brain areas, proton MR spectroscopy is prone to susceptibility artifacts requiring time-consuming manual shimming or even rendering the spectra useless. Some of these disadvantages do not apply to phosphorus MR spectroscopy which measures some of the most relevant compounds involved in tumor metabolism: metabolites of membrane phospholipids, the products of oxidative phosphorylation, and the intracellular pH (see Chap. Future Methods in Tumor Imaging).
This chapter focuses on the special metabolism of glial brain tumors to elucidate the role of MR spectroscopy for a more ÒindividualizedÓ tumor characterization.
1Methods
1.1Introduction to MRS
Magnetic resonance imaging (MRI) measures the signal of water protons (1H nuclei) in the presence of magnetic Þeld gradients, which, together with phase encoding, provides the localization. MRS detects water-soluble metabolites, thus presenting a method for in vivo monitoring of metabolic changes. At the magnetic Þeld strength of a standard clinical MR scanner (1.5Ð3 T), the 1H nuclei and to a certain extent also the 31P nuclei show sufÞcient sensitivity to allow the in vivo detection of metabolites in small volumes (<4 ml) within reasonable acquisition time. The Þrst in vivo 31P spectrum of mouse brain was recorded in 1978 (Chance et al. 1978). Measuring 1H
spectra requires efÞcient suppression of the dominant water signal, which exceeds the metabolite signals by approximately 104, and is therefore technically more demanding. The Þrst in vivo 1H spectra of rat brain were recorded in 1983 using a surface coil in a vertical bore high-resolution NMR spectrometer at 8 T (Behar et al. 1983). Human brain spectra were Þrst obtained in 1985 by Bottomley et al. (1985).
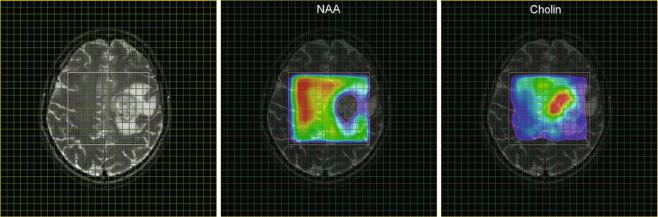
Initially, in vivo spectra were recorded with surface coils which detect signal from the entire region in the vicinity of the coil. For application to pathological lesions, it is required to obtain spectra from a targeted region of the brain (e.g., tumor tissue). This can be achieved by pulse sequences with selective excitation of three orthogonal slabs resulting into spectra from a single cuboid volume element localized at the intersection of the slabs (single voxel spectroscopy, SVS). Two methods are available, either PRESS (Bottomley et al. 1985; Ordidge et al. 1987) or STEAM (Frahm et al. 1989), each having their advantages and disadvantages as described by Moonen et al. (1989). The potential of measuring spatially resolved spectroscopic information (i.e., obtaining a matrix of spectra as demonstrated in Figs. 1 and 2) by combining spectroscopy with gradient phase encoding (spectroscopic imaging, SI or MRSI) was Þrst demonstrated by Brown et al. (1982) for the 31P nucleus, while 10 years later Fulham et al. (1992) showed Þrst 1H MR spectroscopic images of patients with brain tumors. At that time many studies on human tumors had already been performed (for review, see Negendank 1992) including several 31P MR spectroscopic examinations on brain tumors applying various localization techniques. However, with the publication of the Þrst localized water-suppressed 1H spectrum of a human brain tumor by Bruhn et al. (1989), single voxel 1H MRS had become the method of choice for supporting a noninvasive differential diagnosis in brain tumors. This can be attributed to the fact that the spectra show separate markers for the pathological and normal tissue: the increase in intensity of the choline signal is related to tumor cell proliferation (Herminghaus et al. 2002; Guillevin et al. 2008), while the decrease of the concentration of metabolite N-acetyl-aspartate marks breakdown of neuronal cells as it is shown in Fig. 1 for a patient with glioblastoma (see also Table 1).
Single voxel spectroscopy relies on the accurate deÞnition of tumor tissue from T2-weighted or CE-enhanced MRI. But these data lack information of tumor heterogeneity and potential tumor inÞltration. Further, discrimination of tumor tissue may be difÞcult for inÞltrating gliomas. In MR spectroscopic imaging (MRSI), all spectra of a selected slice are acquired simultaneously applying encoding gradients between the excitation pulse and the acquisition period. After spatial Fourier transformation, the spectroscopic image is obtained as a matrix of the dimension NX × NY, where NX and NY denote the number of phase encoding steps in each direction within the slice. For each matrix, a spectrum can be calculated representing the metabolic information for the voxel
MR Spectroscopic Imaging |
|
57 |
|
|
|
a |
b |
c |
Fig. 1 MRSI parameter maps for NAA and tCho of a patient with glioblastoma. The left panel (a) shows a T2-weighted MRI with a grid overlay indicating the spatial resolution of the MRSI data. The white frame marks the area selected for spectroscopy using the PRESS excitation scheme. The glioblastoma is located left paracentral; the adjacent parasagittal cortex is slightly blurred on both sides with a mild increase in
signal intensity. The color-coded maps show the regional distribution of the metabolites NAA (b, marker for intact neuronal tissue) and tCho (c, marker for proliferating cells). The tCho concentration increase is inhomogeneous showing tumor inÞltration into the cortex of both hemispheres (Figure already published in Nervenartz 2014)
attributed to the matrix element. Signal intensities and their ratios can be visualized as a grid overlay on the anatomical image providing parameter maps for the concentrations for speciÞc metabolites or metabolite concentrations ratios (spectroscopic image, Fig. 1). The anatomical reference image should have been recorded with identical angulation and slice offset. Such spectroscopic images provide a retrospective deÞnition of the center and the extent of tumor tissue, while at the same time reference spectra are available from normalappearing tissue (Fig. 2). The resolution can be as low as 0.75 × 0.75 × 1.00 cm3 at sufÞcient signal to noise ratio (S/N), but this requires phase encoding for the entire matrix. Consequently, acquisition of a data set with conventional MRSI techniques takes more than 15 min (see below) which might not be tolerated by many patients especially when performed in addition to the other modalities (Chaps. MR Imaging of Brain Tumors, MR Spectroscopic Imaging, MR Perfusion Imaging, and Diffusion-Weighted Methods) routinely applied in the MR examination. ModiÞcations of the basic MRSI sequence which can reduce the data acquisition time or/and provide multi-slice data will be discussed in the next section. Details of biochemical and clinical aspects of metabolic changes will be discussed in a dedicated section.
1.2Summary of Spectroscopic Imaging Techniques Applied in Tumor Diagnostics
For an in-plane resolution of 7.5 × 7.5 mm2, the 32 × 32 matrix shown in Figs. 1 and 2 had to be recorded at a 240 mm2 FOV. Acquisition of the entire k-space at a repetition time of
1.5 s would take 1,024 × 1.5 s or 26 min. Together with the preparation period (extensive shimming, adjustments for water suppression), the MRS examination may add another 30 min. to the conventional imaging examination. Reduction of measurement time and optimized automatic adjustments for the preparation period are therefore essential for a successful MRS protocol. The latter has been addressed in the modern scanners by the use of image-guided shimming procedures and implementations of routines for automatic adjustments of water suppression. These tools can reduce the preparation time to less than 1 min.
The rather extensive acquisition times required for the complete k-space can also be reduced. Without signiÞcant loss in spatial resolution, a 28 × 28 matrix can be recorded and extrapolated to 32 × 32 by adding zeroes before Fourier transformation, which will reduce the total acquisition time to 20 min. Selection of a circular (elliptical in case of rectangular FOV) k-space area centered around the origin will save another 25 % of acquisition time without seriously affecting the spatial resolution (Maudsley et al. 1994). The use of a rectangular FOV could also save up to 30 % (Golay et al. 2002) resulting in a total acquisition time between 10 and 15 min. Further reduction in acquisition time can be achieved with fast imaging techniques like echo planar spectroscopic imaging (EPSI) and parallel imaging method (Posse et al. 1995; Zierhut et al. 2009; Ozturk et al. 2006; Sabati et al. 2014) or multiple spin-echo spectroscopic imaging (MSESI) (Duyn and Moonen 1993). These techniques scan more than one phase encoding step for a single excitation pulse, providing the respective acceleration factors, and allow acquisition of 3D MRSI data with sufÞcient spatial resolution in reasonable scan time.
58 |
E. Hattingen and U. Pilatus |
|
|
a |
b |
c |
d |
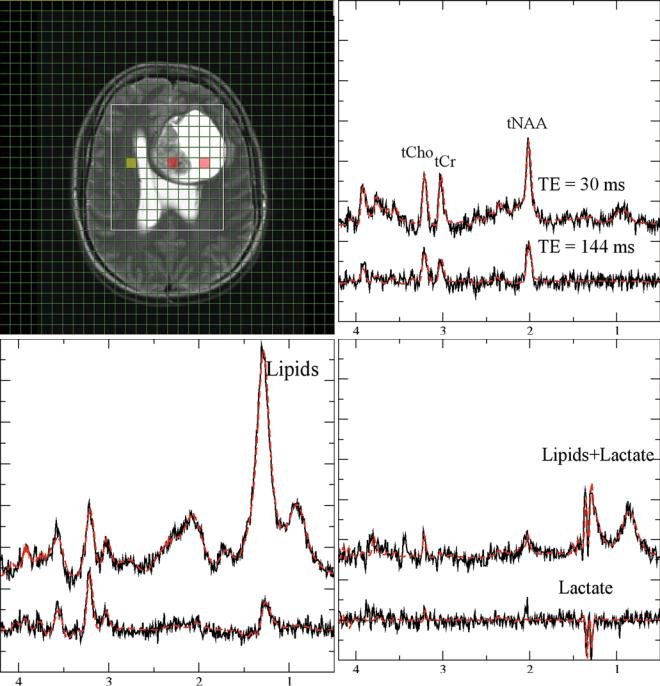
Fig. 2 Monitoring lactate. Short (30 ms, upper traces) and long (lower traces) from a patient with glioma grade IV. (a, T2-weighted MRI with a grid overlay indicating the spatial resolution of MRSI). The three panels with spectroscopic data show normal-appearing tissue (b, yellow-marked voxel in the MRI), necrotic tissue (c, central
red-marked voxel in the MRI), and CSF (d, right red-marked voxel in the MRI). Lactate is visible as a doublet (two signals with 8 Hz distance) at 1.3 ppm. The signals are inverted at long TE. Note that the lipid signals at 1.2 ppm which are only visible at short TE are overlapping with lactate

MR Spectroscopic Imaging |
|
|
|
59 |
|
|
|
|
|||
Table 1 Important metabolites in 1H MRS and their signiÞcance in brain tumors |
|
|
|||
|
Peak |
Biology |
Marker |
Increase |
Decrease |
N-Acetyl-aspartate |
2.02 ppm |
Second-most-concentrated |
Neuronal marker |
Ð |
Any neuronal |
NAA |
|
cerebral amino acid |
Neuronal integrity |
|
damage (may be |
|
|
Synthesis in neuronal |
|
|
reversible) |
|
|
mitochondria from the amino |
|
|
|
|
|
acid aspartic acid and |
|
|
|
|
|
acetyl-coenzyme A |
|
|
|
|
|
Functions still under |
|
|
|
|
|
investigation |
|
|
|
Choline-containing |
3.2 ppm |
Part of the hydrophilic head of |
Cell density |
High-grade glioma |
Cell necroses |
compounds |
|
the membrane phospholipid |
Cell proliferation |
Medulloblastoma, |
Gliosis |
Cho |
|
phosphatidylcholine (lecithin) |
Demyelination |
PNET |
|
|
|
|
|
ATRT |
|
Total creatine |
3.03 and 3.94 ppm |
PCr: storing and buffering of |
Activation of glial |
Gliomatosis |
Metastases, |
(phosphocreatine + |
|
high phosphate-bound energy, |
cells |
Some solid gliomas |
necrosis, lymphoma, |
creatine) |
|
provide quick regeneration of |
|
Prognostic marker |
malignant glial |
tCr (PCr + Cr) |
|
ATP |
|
for PSF of WHO |
tumors |
|
|
Cr: functions still under |
|
grade II and III |
|
|
|
investigations, synthesis in |
|
astrocytomas |
|
|
|
oligodendrocytes associated |
|
|
|
|
|
with neuronal elements |
|
|
|
|
|
Used for polyamine and |
|
|
|
|
|
methionine synthesis in tumor |
|
|
|
|
|
cells |
|
|
|
Myo-inositol |
3.56 ppm |
Osmotic regulator within the |
Osmolyte |
Gliomatosis |
Metastases |
MI, m-Ins |
(complex signals in |
astrocytes |
Not deÞned |
Low-grade |
High-grade gliomas |
|
short TE) |
Precursor of |
|
astrocytomas |
|
|
|
phosphatidylinositol (involved |
|
Schwannomas |
|
|
|
in metabolic pathway |
|
Choroid plexus |
|
|
|
activating proteolytic enzymes) |
|
papilloma |
|
Glycine |
3.56 ppm |
Simplest amino acid |
Not deÞned |
High-grade gliomas |
Normally not |
Gly |
|
Increased synthesis in glioma |
aTumor cell |
Medulloblastoma |
measurable, |
|
|
cells (serine |
proliferation |
|
negligible |
|
|
hydroxymethyltransferase) |
|
|
|
|
|
Utilized for de novo purine |
|
|
|
|
|
biosynthesis |
|
|
|
Lipids |
Two large peaks at |
Mobile lipids, lipids in |
Cell necrosis |
Necrosis of |
Normally not |
|
0.8Ð0.9 ppm and |
droplets |
|
high-grade gliomas |
measurable, |
|
1.2Ð1.3 ppm |
|
|
Metastases and |
negligible (cave |
|
|
|
|
meningioma |
artifacts from skull) |
|
|
|
|
Lymphomas |
|
|
|
|
|
Radio-necrosis |
|
Lactate |
Double-peak at |
Product of glycolysis |
Anaerobic |
UnspeciÞc: tumor |
Normally not |
|
1.33 ppm, in |
|
glycolysis |
(more often in |
measurable |
|
long-TE (135 ms) |
|
|
highbut also in |
|
|
inverted |
|
|
low-grade glioma) |
|
|
|
|
|
necrosis, cysts, |
|
|
|
|
|
inßammation |
|
Taurine |
3.4 ppm |
Abundant in developing |
Putative marker of |
Medulloblastoma |
Low-grade pilocytic |
|
(complex signals in |
cerebellum and isocortex; |
apoptosis |
|
astrocytoma, |
|
short TE) |
involved in cell shrinkage |
|
|
choroid plexus |
|
|
during apoptosis |
|
|
papilloma |
Alanine |
Double-peak at |
Amino acid |
|
Meningioma, |
Normally not |
|
1.5 ppm in long-TE |
|
|
abscess |
measurable |
|
(135 ms) inverted |
|
|
|
|
aJain et al. (2012) |
|
|
|
|
|