


90 |
C. Preibisch et al. |
|
|
Fig. 14 Illustration of the tumor heterogeneity with an example of two GBM (WHO °IV) cases. In Case 1, the diffusely contrast-enhancing tumor (a) shows a large hyperperfused portion (DSC rCBV map in b) and spectroscopic choline peaks in the mesial and dorsal part (c); the voxelwise comparison of the perfusion and the spectroscopic hot spots
Fig. 15 Follow-up imaging of a patient with a glioblastoma (3 months postsurgery). There is a new contrast-enhancing lesion in the post-contrast T1w image (a) rostral from the resected lesion in the left temporal lobe (arrow). Perfusion imaging with ASL (b) shows decreased rCBF (dotted arrow), suggesting radiation necrosis, which was confirmed by histology
in (d) shows a reasonable correlation. In Case 2, the tumor enhances only in small parts (a); the mesial and dorsal parts are hyperperfused (b); the spectroscopic peak is in the central part of the tumor (c); and there is little correlation between the two methods (d), indicating tumor heterogeneity
low -grade tumors as well (Bisdas et al. 2009). In the fol- low-up of low-grade astrocytic tumors, however, elevated perfusion may be the first sign of a malign transformation (Fig. 13). Therefore, use of perfusion data in combination with histological information is essential in predicting prognosis in glioma patients.
3.5\ Guidance for Biopsy and Radiation Therapy Planning
An important clinical topic where perfusion imaging can play a relevant part is in the definition of “tumor hot spots,” i.e., most malignant (or highest grade) niches of heterogeneous
MR Perfusion Imaging |
91 |
|
|
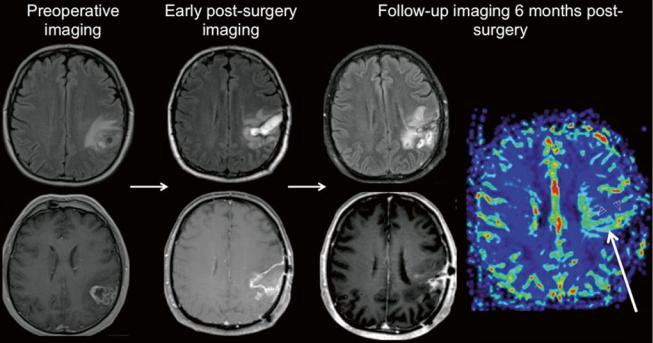
Fig. 16 Imaging follow-up of a glioblastoma patient. Preoperative imaging (axial FLAIR and post-Gd T1w) shows a partially necrotic tumor with infiltrating borders and contrast enhancement. Early postsurgery imaging (axial FLAIR and post-Gd T1w) shows persisting T2 lesion and no enhancement (T1w hyperintensities correspond to blood
products). Follow-up at 6 months after radiochemotherapy (axial FLAIR, post-Gd T1w, and DSC rCBV perfusion map): T2 lesion is progredient; rCBV elevation in a contrast-enhancing lesion suggests tumor recurrence, verified by histology
tumor tissue. Their definition is important for the guidance of biopsy procedures, to prevent the undergrading of a tumor and to focus surgical efforts. Perfusion imaging was shown to identify tissue biopsy specimens with higher tumor proliferation, necrosis, and vascular hyperplasia (Barajas et al. 2012). In the same study, diffusion weighted imaging identified regions of tumor infiltration. Other studies found that perfusion hot spots did not coincide with spectroscopic tumor hot spots, indicating a spatial divergence of neovascularization and tumor cell proliferation (Wagner et al. 2011). These data demonstrate that the use of multimodal imaging identifies tumor parts with different histological characteristics (Fig. 14). A multimodal approach remains, therefore, essential in biopsy planning.
Recently, multimodal imaging has also been introduced to the planning of radiotherapy, allowing the delivery of focused higher doses (dose-painting or intensity-modulated radiotherapy) to new target volumes characterized by functional data (e.g., perfusion or spectroscopy) (Ken et al. 2013; Grosu et al. 2007).
3.6\ Treatment Monitoring
Therapeutic interventions—resection, radiation, and chemo- therapy—affect tumor vascularization in a way that is difficult to keep track of with conventional imaging. Perfusion
imaging could be an especially valuable aid in post- therapeutic tumor imaging.
The first medication given to a patient with the diagnosis of a brain tumor is often a steroid like dexamethasone; therefore, it is important to be aware of its potential impact on imaging results. Steroid treatment has a great effect on tumor perfusion: even shortly after administration, the volume of enhancing tumor, rCBV, and permeability decreases drastically (Ostergaard et al. 1999; Armitage et al. 2007), which is due to a transient decrease in total vessel volume (Darpolor et al. 2011).
The primary focus of surgical resection is the contrast- enhancing tumor mass with disrupted blood–brain barrier. Postsurgery imaging must exclude the presence of postsurgical infarcts with the help of diffusion weighted imaging (Smith et al. 2005; Gempt et al. 2013a, b). In early postsurgery imaging (<24–48 h after resection), contrast enhancement most probably represents residual tumor, while postsurgical infarcts and reactive gliosis start to enhance somewhat later. The amount of nonenhancing tumor residual is often overestimated in these scans, which can be related to edema and postsurgical infarcts (Belhawi et al. 2011). Perfusion imaging in addition to DWI can help in the differentiation of these lesions.
Current standard adjuvant therapy of glioblastoma includes radiotherapy and concomitant chemotherapy. The
92 |
C. Preibisch et al. |
|
|
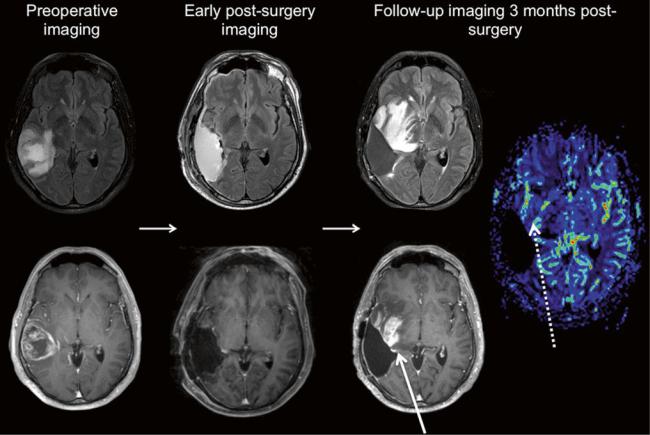
Fig. 17 Imaging follow-up of another glioblastoma patient. Preoperative imaging (axial FLAIR and post-Gd T1w) shows—just like in Fig. 15—a partially necrotic tumor with infiltrating borders and contrast enhancement. Early postsurgery imaging (axial FLAIR and post-Gd T1w) shows no residual tumor. Follow-up at 3 months
after chemotherapy (axial FLAIR, post-Gd T1w, and DSC rCBV perfusion map): extensive new T2 lesion and contrast enhancement; rCBV, however, is only partly and moderately elevated, suggesting pseudoprogression
imaging follow-up of these patients may reveal early imaging changes such as a progressive T2 lesion, contrast enhancement, and necroses even in patients who are doing well and in later follow-up these lesions regress. This phenomenon is called pseudoprogression because the conventional imaging changes are indistinguishable from tumor. Pseudoprogression may be caused by chemother- apy—mainly due to a breakdown of the blood–brain barrier and cytotoxic effects—or by radiation effects. Radiation necrosis may also result in delayed changes, months later (Sundgren and Cao 2009), by reducing overall tissue perfusion and increases permeability in both tumorous and healthy tissue, due to a decline in vessel density and an increase in vessel tortuosity (Lee et al. 2005; Fuss et al. 2000). The injured tissue is characterized by tissue edema and contrast enhancement in conventional MRI, but perfusion weighted imaging may provide more insight into tissue pathology underlying these changes (Fig. 15).
Lesions in pseudoprogression and postoperative scars show significantly lower perfusion than early tumor progression (Choi et al. 2013). High rCBV strongly suggests tumor recurrence (see Fig. 15), while normal rCBV speaks for treatment-related changes (Sugahara et al. 2000; Hu et al. 2009) (Fig. 16).
Pseudoresponse, on the other hand, is a term related to the use of anti-angiogenic therapies. These agents—antagonists of the previously mentioned angiogenic factors like VEGF— act by inhibiting the development of new tumor vessels and “normalizing” the existing ones (O’Connor et al. 2007). In perfusion imaging, there is a drastic rCBV decrease even after administration of a single dose of such drugs; overall permeability is also decreased, resulting in disappearing contrast enhancement (Vidiri et al. 2012) and reduced vasogenic edema. These changes in tumor vascularization may have controversial effects on tumor biology, and up to now, perfusion characteristics of glioblastoma under anti-angiogenic treatment cannot predict patient outcome (Figs. 17 and 18).