

6.3 Method for System-Level EMC Quantitative Design |
277 |
6.3 Method for System-Level EMC Quantitative Design
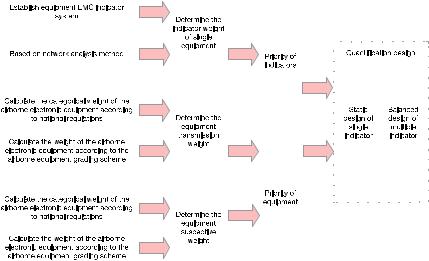
Using the degree of influence and the degree of being influenced, we can identify the equipment that needs to be specifically designed or protected in the system-level EMC design. Since the aircraft is a complex system, the design scheme to achieve good EMC of the aircraft is not unique. This book uses the Analytic Network ProcessTechnique for Order of Preference by Similarity to Ideal Solution (ANP-TOPSIS) to analyze the weight vector of each piece of onboard electronic equipment and its influence on the EMC of the whole aircraft. Furthermore, the different design schemes of each piece of equipment are sorted by its advantages and disadvantages. Finally, the equipment’s weight and its advantage ranking of equipment in different schemes are being combined to obtain the optimal design scheme of the EMC of the whole aircraft.
This section introduces the system-level EMC design method from three aspects: the quantification of indicator weighting, the optimization design of individual indicator, and the collaborative optimization design of multiple indicators [68].
6.3.1 The Quantification Method of EMC Indicator Weight
The quantitative design of the whole system is based on the quantitative evaluation of the advantages and disadvantages of the EMC design scheme, which further relies on the evaluation indicators. However, the EMC assessment indicators are numerous and the relationship between them is inextricably linked. To solve this problem, based on the research results of general system-level EMC indicator system, and through the appropriate tailoring and refinement, we have applied the general EMC indicator system to the aviation platform.
We have proposed an indicator weight calculation method based on the indicator system research results. Combining the method with the actual characteristics of the scheme, we further quantify the indicators using the analytic network process (ANP). This way we obtain the final indicator weights, which serve as the input and basis for the subsequent indicator decomposition.
1. Aircraft EMC indicator system
Through the in-depth analysis of the factors affecting the EMC of the aircraft, we establish a system for indicator selection. The indicator affecting the EMC of the aircraft can be divided into the following categories: transmitter performance indicators, receiver performance indicators, antenna layout performance indicators, interconnection performance indicators, etc., as shown in Fig. 6.10.
2. Calculation of EMC indicator weights
The ANP can describe complex systems. It is a scientific decision-making method to quantify each factor with a scale of 1–9, compare them in pairs, and finally rank
278 |
|
|
|
|
|
|
|
|
|
|
|
|
|
6 Application Cases of System-Level EMC Quantitative … |
||||||||||||||||||||||||||||||
|
|
|
|
|
|
|
|
|
|
|
|
|
|
|
|
|
|
|
|
|
|
|
|
|
|
|
|
|
|
|
|
|
|
|
|
|
|
|
|
|
|
|
|
|
|
|
|
|
|
|
|
|
|
|
|
|
|
|
|
|
|
|
|
|
|
|
|
|
|
|
|
|
|
|
|
|
|
|
|
|
|
|
|
|
|
|
|
|
|
|
|
|
|
|
|
|
|
|
|
|
|
|
|
|
|
|
|
|
|
|
|
|
|
|
|
|
|
|
|
|
|
|
|
|
|
|
|
|
|
|
|
|
|
|
|
|
|
|
|
|
|
|
|
|
|
|
|
|
|
|
|
|
|
|
|
|
|
|
|
|
|
|
|
|
|
|
|
|
|
|
|
|
|
|
|
|
|
|
|
|
|
|
|
|
|
|
|
|
|
|
|
|
|
|
|
|
|
|
|
|
|
|
|
|
|
|
|
|
|
|
|
|
|
|
|
|
|
|
|
|
|
|
|
|
|
|
|
|
|
|
|
|
|
|
|
|
|
|
|
|
|
|
|
|
|
|
|
|
|
|
|
|
|
|
|
|
|
|
|
|
|
|
|
|
|
|
|
|
|
|
|
|
|
|
|
|
|
|
|
|
|
|
|
|
|
|
|
|
|
|
|
|
|
|
|
|
|
|
|
|
|
|
|
|
|
|
|
|
|
|
|
|
|
|
|
|
|
|
|
|
|
|
|
|
|
|
|
|
|
|
|
|
|
|
|
|
|
|
|
|
|
|
|
|
|
|
|
|
|
|
|
|
|
|
|
|
|
|
|
Fig. 6.10 Aircraft EMC performance indicator system
Fig. 6.11 Basic flowchart of
ANP
them. ANP expresses complex problems in the form of a network. The basic principle of ANP is the same as the analytic hierarchy process (AHP). The first difference between the two lies in the model structure, and the second difference is that ANP introduces the application and analysis of the supermatrix.
First of all, ANP classified the elements in two parts. The first part is called the control factor layer, which generally includes the target of the problem and the decision criteria. All the decision criteria are considered to be independent and only subject to the target element. The second part is the network layer which is composed of elements determined by the upper elements.
The basic flowchart of the ANP method is shown in Fig. 6.11.
Assuming the EMC design of an aircraft prioritizes the layout of the radio, we use this EMC design as an example to illustrate the effectiveness of the method. First, EMC of the communication station is measured by the following indicators: the
6.3 Method for System-Level EMC Quantitative Design |
279 |
receiver sensitivity (C11), IF rejection ratio (C12), transmitting power (C13), antenna isolation (C21), VSWR of antenna (C22), shielding effectiveness (C31), frequency band coupling (C32), where C11, C12, and C13 belong to the equipment’s own performance indicator set C1; C21 and C22 belong to the antenna performance indicator set C2; C31 and C32 belong to the interconnection performance indicator set C3.
(1)Calculate the unweighted supermatrix. The EMC performance P of the communication station is taken as the criterion. The elements in the antenna layout performance in the network layer C21 are taken as the secondary criterion. The advantages of the influence degree of each element in the performance of the equipment C1 toward C21 are compared. Then, we can obtain the judgment matrix and normalize the matrix.
Thus, the unweighted supermatrix under criterion C is
|
|
|
|
|
|
|
|
|
|
0.0000 0.0000 0.0000 0.6369 0.6586 0.5525 0.5584 |
|
|
|
|
|
|
|
|
|
|
|
|
0.0000 0.0000 0.0000 0.1047 0.1562 0.1701 0.1210 |
|
|
|
|
|
|
|
|
|
|
|
|
|
||
|
|
W11 |
W12 |
W13 |
|
|
0.0000 0.0000 0.0000 0.2583 0.1852 0.2803 0.3196 |
|
||||
W |
|
|
|
W22 |
W23 |
|
|
0.7500 0.5000 0.8000 0.0000 0.0000 0.8750 0.8333 |
|
(6.6) |
||
|
|
|
|
|||||||||
|
W21 |
|
|
|
||||||||
|
|
W |
31 |
W |
32 |
W |
33 |
|
|
0.2499 0.5000 0.2000 0.0000 0.0000 0.1249 0.1667 |
|
|
|
|
|
|
|
|
|
|
|
|
|||
|
|
|
|
|
|
|
|
|
|
|
|
|
|
|
|
|
|
|
|
|
|
|
0.7500 0.5000 0.8571 0.9000 0.5000 0.5000 0.8000 |
|
|
|
|
|
|
|
|
|
|
|
|
0.2500 0.5000 0.1429 0.1000 0.5000 0.5000 0.2000 |
|
|
where the sub-block Wi j of the supermatrix W is normalized, while W is not. Therefore, we need to construct a weight matrix to normalize W.
(2)Calculate the weighted supermatrix. When calculating the weighted supermatrix, the weight matrix under the target criterion needs to be calculated first. For this reason, the importance of each element is compared under the target criterion based on the target P (as shown in Table 6.5). By normalizing the feature vectors, a weight matrix can be obtained, where the order vector component corresponding to the element group unrelated to Ci is zero.
The weight matrix is
|
|
0.0000 0.5528 0.1971 |
|
|
||
A 0.6496 0.0000 0.1309 |
(6.7) |
|||||
|
|
0.3504 0.4481 0.6719 |
|
|
|
|
Table 6.5 Element group Ci |
|
|
|
|
|
|
Ci |
|
C1 |
|
C2 |
C3 |
|
|
|
|
||||
|
|
|
|
|
|
|
|
C1 |
|
0.0000 |
|
0.5528 |
0.1971 |
|
|
|
|
|
|
|
|
|
|
|
|
|
|
|
C2 |
|
0.6496 |
|
0.0000 |
0.1309 |
|
|
|
|
|
|
|
|
|
|
|
|
|
|
|
C3 |
|
0.3504 |
|
0.4481 |
0.6719 |
|
|
|
|
|
|
|
|
|
|
|
|
|
|

280 |
|
6 Application Cases of System-Level EMC Quantitative … |
||||
Table 6.6 Weight of each indicator |
|
|
|
|
||
|
|
|
|
|
|
|
Receiver sen- |
IF rejection |
Transmitter |
Antenna |
SWR of |
Shielding |
Frequency |
sitivity/dBm |
ratio/dB |
power/W |
isolation/W |
antenna |
effectivity |
coupling |
|
|
|
|
|
|
|
0.2204 |
0.1233 |
0.1774 |
0.1742 |
0.1342 |
0.112 |
0.0585 |
|
|
|
|
|
|
|
When the weight matrix A has been obtained, we perform Wi j ai j Wi j , i 1, 2, 3, 4, j 1, 2, 3, 4 to get the weight matrix W. The column sum of matrix W
is 1. W is also known as column random matrix, i.e., |
|
|
|||
|
|
|
0.0000 0.0000 0.0000 0.3521 0.3641 0.1089 0.1101 |
|
|
|
|
|
0.0000 0.0000 0.0000 0.0579 0.0863 0.0335 0.0238 |
|
|
|
|
|
|
|
|
|
|
|
0.0000 0.0000 0.0000 0.1428 0.1024 0.0552 0.0630 |
|
|
|
|
|
|
|
|
|
W |
|
0.4872 0.3248 0.5197 0.0000 0.0000 0.1145 0.1091 |
(6.8) |
|
|
|
|
0.1623 0.3248 0.1299 0.0000 0.0000 0.1249 0.1667 |
|
|
|
|
|
|
|
|
|
|
|
|
|
|
0.2628 0.1752 0.3003 0.4033 0.2241 0.3360 0.5375 0.0876 0.1752 0.0501 0.0448 0.2241 0.3360 0.1344
(3)Calculate the limit weighted supermatrix. After the weighted supermatrix W
is obtained, Wls |
klim |
|
k is performed (k → ∞). The result is a long-term |
W |
|||
|
→∞ |
||
stable matrix. The value of each row of the matrix Wls is the same, which is the weight value of each element, as shown in Table 6.6.
6.3.2 The Optimization Method of Single EMC Indicator
The process of the single EMC indicator optimization method is as follows: (1) Access the evaluation indicators to obtain the EMC indicator weights for the specific project; (2) then classify the evaluation indicators according to the weights to obtain the design indicators priority and the design margin; (3) the indicators are statically designed; (4) after all the designs are completed, the individual design indicators are adjusted according to the test data, and the top-down adjustment design is conducted. The indicator allocation method is shown in Fig. 6.12.
The indicators are divided into frequency domain, margin, and time domain. Now, we introduce the method of the single-indicator allocation of frequency domain and margin.
1. Frequency-domain design method
There are many pieces of airborne spectrum-dependent equipment, so spectrum is a valuable resource on an aircraft. Spectrum must be allocated reasonably to save resources and to reduce interference caused by frequency overlap between equipment. Generally speaking, equipment should work in different frequency bands.
6.3 Method for System-Level EMC Quantitative Design |
281 |
||||||||||||||||||||||||||||||||||||||||
|
|
|
|
|
|
|
|
|
|
|
|
|
|
|
|
|
|
|
|
|
|
|
|
|
|
|
|
|
|
|
|
|
|
|
|
|
|
|
|
|
|
|
|
|
|
|
|
|
|
|
|
|
|
|
|
|
|
|
|
|
|
|
|
|
|
|
|
|
|
|
|
|
|
|
|
|
|
|
|
|
|
|
|
|
|
|
|
|
|
|
|
|
|
|
|
|
|
|
|
|
|
|
|
|
|
|
|
|
|
|
|
|
|
|
|
|
|
|
|
|
|
|
|
|
|
|
|
|
|
|
|
|
|
|
|
|
|
|
|
|
|
|
|
|
|
|
|
|
|
|
|
|
|
|
|
|
|
|
|
|
|
|
|
|
|
|
|
|
|
|
|
|
|
|
|
|
|
|
|
|
|
|
|
|
|
|
|
|
|
|
|
|
|
|
|
|
|
|
|
|
|
|
|
|
|
|
|
|
|
|
|
|
|
|
|
|
|
|
|
|
|
|
|
|
|
|
|
|
|
|
|
|
|
|
|
|
|
|
|
|
|
|
|
|
|
|
|
|
|
|
|
|
|
|
|
|
|
|
|
|
|
|
|
|
|
|
|
|
|
|
|
|
|
|
|
|
|
|
|
|
|
|
|
|
|
|
|
|
|
|
|
|
|
|
|
|
|
|
|
|
|
|
|
|
|
|
|
|
|
|
|
|
|
|
|
|
|
|
|
|
|
|
|
|
|
|
|
|
|
|
|
|
|
|
|
|
|
|
|
|
|
|
|
|
|
|
|
|
|
|
|
|
|
|
|
|
|
|
|
|
|
|
|
|
|
|
|
|
|
|
|
|
|
|
|
|
|
|
|
|
|
|
|
|
|
|
|
|
|
|
|
|
|
|
|
|
|
|
|
|
|
|
|
|
|
|
|
|
|
|
|
|
|
|
|
|
|
|
|
|
|
|
|
|
|
|
|
|
|
|
|
|
|
|
|
|
|
|
|
|
|
|
|
|
|
|
|
|
|
|
|
|
|
|
|
|
|
|
|
|
|
|
|
|
|
|
|
|
|
|
|
|
|
|
|
|
|
|
|
|
|
|
|
|
|
|
|
|
|
|
|
|
|
|
|
|
|
|
|
|
|
|
|
|
|
|
|
|
|
|
|
|
|
|
|
|
|
|
|
|
|
|
|
|
|
|
|
|
|
|
|
|
|
|
|
|
|
|
|
|
|
|
|
|
|
|
|
|
|
|
|
|
|
|
|
|
|
|
|
|
|
|
|
|
|
|
|
|
|
|
|
|
|
|
|
|
|
|
|
|
|
|
|
|
|
|
|
|
|
|
|
|
|
|
|
|
|
|
|
|
|
|
|
|
|
|
|
|
|
|
|
|
|
|
|
|
|
|
|
|
|
|
|
|
|
|
|
|
|
|
|
|
|
|
|
|
|
|
|
|
|
|
|
|
|
|
|
|
|
|
|
|
|
|
|
|
|
|
|
|
|
|
|
|
|
|
|
|
|
|
|
|
|
|
|
|
|
|
|
|
|
|
|
|
|
|
|
|
|
|
|
|
|
|
|
|
|
|
|
|
|
|
|
|
|
|
|
|
|
|
|
|
|
|
|
|
|
|
|
|
|
|
|
|
|
|
|
|
|
|
|
|
|
|
|
|
|
|
|
|
|
|
|
|
|
|
|
|
|
|
|
|
|
|
|
|
|
|
|
|
|
|
|
|
|
|
|
|
|
|
|
|
|
|
|
|
|
|
|
|
|
|
|
|
|
|
|
|
|
|
|
|
|
|
|
|
|
|
|
|
|
|
|
|
|
|
|
|
|
|
|
|
|
|
|
|
|
|
|
|
|
|
|
|
|
|
|
|
|
|
|
|
|
|
|
|
|
|
|
|
|
|
|
|
|
|
|
|
|
|
|
|
|
|
|
|
|
|
|
|
|
|
|
|
|
|
|
|
|
|
|
|
|
|
|
|
|
|
|
|
|
|
|
|
|
|
|
|
|
|
|
|
|
|
|
|
|
|
|
|
|
|
|
|
|
|
|
|
|
|
|
|
|
|
|
|
|
|
|
|
|
|
|
|
|
|
|
|
|
|
|
|
|
|
|
|
|
|
|
|
|
|
|
|
|
|
|
|
|
|
|
|
|
|
|
|
|
|
|
|
|
|
|
|
|
|
|
|
|
|
|
|
|
|
|
|
|
|
|
|
|
|
|
|
|
|
|
|
|
|
|
|
|
|
|
|
|
|
|
|
|
|
|
|
|
|
|
Fig. 6.12 Indicator allocation method
For equipment that must work in the same frequency band, the farther apart, the better. Therefore, it is necessary to allocate and optimize the frequency of all spectrumdependent equipment. Radio equipment are usually subject to frequency adjustment. Since the radios usually use a wide bandwidth and some separated frequency points, it is necessary to select the schemes for the N pieces of radio equipment that the interference among them is the minimum. The mathematical model of the problem is as follows:
|
Equipment 1: The frequency range is |
fL1 |
, fH1 |
and the frequency interval is f1. |
|||||||||||
|
Equipment 2: The frequency range is |
fL2 |
, fH2 |
and the frequency interval is f2. |
|||||||||||
|
Equipment 3: The frequency range is fL3 |
, fH3 |
and the frequency interval is f3. |
||||||||||||
|
…………. |
|
|
|
|
|
|
|
|
|
|
|
|||
|
Let |
fi |
|
f i |
, f i |
+ fi , f i + 2 fi , f i |
+ 3 fi , . . . , f i |
and |
f j |
|
|||||
|
|
|
|
L |
L |
L |
|
|
L |
H |
|
|
|||
j |
j |
+ |
j |
|
|
|
j |
|
j |
, and then we have |
|
|
|
||
fL |
, fL |
f j , fL |
+ 2 f j , fL + 3 f j , . . . , fH |
|
|
|
|
||||||||
|
|
|
|
|
|
1 (equi pment i and equi pment j are compatible) |
|
|
|||||||
|
E MC fi , f j |
0 (equi pment i and equi pment j are not compatible) |
|
||||||||||||
In an EMC design scheme, there are M pieces of spectrum-dependent equipment and N (M ≥ N ) pieces of equipment that need to be allocated with frequencies. The expression of the total number of interferences is
282 |
6 Application Cases of System-Level EMC Quantitative … |
||
|
N |
i−1 |
N M |
|
|
|
|
I ( f1, f2, . . . , fN , fN +1, . . . , fM ) |
E MC( fi , f j )+ |
E MC( fi , f j ) |
|
|
i 2 j 1 |
i 2 j N 1 |
|
|
|
|
(6.9) |
Therefore, frequency allocation is to select the appropriate frequency points within the frequency range available for the spectrum-dependent equipment to ensure that the interference among all equipment is minimized.
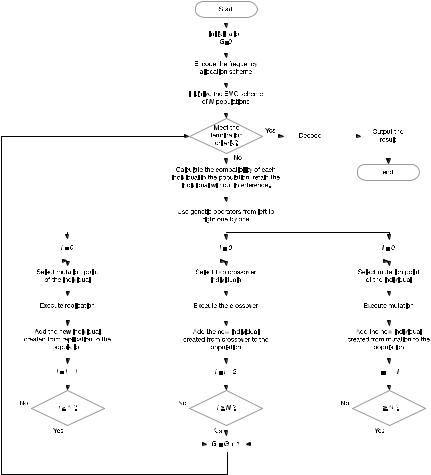
The software implementation process is as follows:
(1)Assume that there are N1 pieces of spectrum-dependent equipment.
(2)Among them, there are N2 pieces of equipment with adjustable frequencies.
(3)The adjustable frequencies of each equipment is: Equipment 1: F_E1_1, F_E1_2; F_E1_3; F_E1_4; F_E1_5; F_E1_6 … (from small to large, coded as 0, 1, 2, 3, 4, 5, 6, 7, 8 …, respectively); Equipment 2: F_ E2_1, F_ E2_2; F_ E2_3; F_ E2_4; F_ E2_5; F_ E2_6 … (from small to large, coded as 0, 1, 2,3,4,5,6,7,8…, respectively); Equipment N2: F_EN2_1, F_EN2_2; F_EN2_3; F_EN2_4; F_EN2_5; F_EN2_6 … (from small to large, coded as 0, 1, 2, 3, 4, 5, 6, 7, 8 …, respectively);
(4)The available frequencies of each equipment are encoded from small to large;
(5)Input the population size (popsize) (It is determined based on the product of the number of available frequency points of all equipment, and the maximum number is the value of the product, ranging from 50 to 500. If 500 is greater than the maximum value, then change the number 500 to the maximum value; if 50 is greater than the maximum value, then the range is changed to 1—the maximum); the crossover probability (pc) (0.2–0.99); the mutation probability (pm) is (0.001–0.1); the maximum number of iterations (maxgeneration) is (100–300);
(6)The popsize number of initial schemes is randomly selected from X number of schemes (the product of the number of available frequency points of all equipment). The frequency allocation method is shown in Fig. 6.13.
2. Margin design method
Referring to the EMC-Analyze user’s manual, the multi-port interference and coupling are analyzed to perform margin design. First, we shall define the interference coupling ports and susceptive coupling ports of the equipment/subsystem, including the antenna port, cable port, and case slot port. Then, we call the simulation prediction algorithm to calculate the interference margin of the susceptive object under each coupling channel, and then calculate the cumulative interference margin. Finally, according to a certain indicator allocation method, we can complete the design of the margin. The process is shown in Fig. 6.14.
6.3 Method for System-Level EMC Quantitative Design |
283 |
||||||||||||||||||||||||||||||||||||
|
|
|
|
|
|
|
|
|
|
|
|
|
|
|
|
|
|
|
|
|
|
|
|
|
|
|
|
|
|
|
|
|
|
|
|
|
|
|
|
|
|
|
|
|
|
|
|
|
|
|
|
|
|
|
|
|
|
|
|
|
|
|
|
|
|
|
|
|
|
|
|
|
|
|
|
|
|
|
|
|
|
|
|
|
|
|
|
|
|
|
|
|
|
|
|
|
|
|
|
|
|
|
|
|
|
|
|
|
|
|
|
|
|
|
|
|
|
|
|
|
|
|
|
|
|
|
|
|
|
|
|
|
|
|
|
|
|
|
|
|
|
|
|
|
|
|
|
|
|
|
|
|
|
|
|
|
|
|
|
|
|
|
|
|
|
|
|
|
|
|
|
|
|
|
|
|
|
|
|
|
|
|
|
|
|
|
|
|
|
|
|
|
|
|
|
|
|
|
|
|
|
|
|
|
|
|
|
|
|
|
|
|
|
|
|
|
|
|
|
|
|
|
|
|
|
|
|
|
|
|
|
|
|
|
|
|
|
|
|
|
|
|
|
|
|
|
|
|
|
|
|
|
|
|
|
|
|
|
|
|
|
|
|
|
|
|
|
|
|
|
|
|
|
|
|
|
|
|
|
|
|
|
|
|
|
|
|
|
|
|
|
|
|
|
|
|
|
|
|
|
|
|
|
|
|
|
|
|
|
|
|
|
|
|
|
|
|
|
|
|
|
|
|
|
|
|
|
|
|
|
|
|
|
|
|
|
|
|
|
|
|
|
|
|
|
|
|
|
|
|
|
|
|
|
|
|
|
|
|
|
|
|
|
|
|
|
|
|
|
|
|
|
|
|
|
|
|
|
|
|
|
|
|
|
|
|
|
|
|
|
|
|
|
|
|
|
|
|
|
|
|
|
|
|
|
|
|
|
|
|
|
|
|
|
|
|
|
|
|
|
|
|
|
|
|
|
|
|
|
|
|
|
|
|
|
|
|
|
|
|
|
|
|
|
|
|
|
|
|
|
|
|
|
|
|
|
|
|
|
|
|
|
|
|
|
|
|
|
|
|
|
|
|
|
|
|
|
|
|
|
|
|
|
|
|
|
|
|
|
|
|
|
|
|
|
|
|
|
|
|
|
|
|
|
|
|
|
|
|
|
|
|
|
|
|
|
|
|
|
|
|
|
|
|
|
|
|
|
|
|
|
|
|
|
|
|
|
|
|
|
|
|
|
|
|
|
|
|
|
|
|
|
|
|
|
|
|
|
|
|
|
|
|
|
|
|
|
|
|
|
|
|
|
|
|
|
|
|
|
|
|
|
|
|
|
|
|
|
|
|
|
|
|
|
|
|
|
|
|
|
|
|
|
|
|
|
|
|
|
|
|
|
|
|
|
|
|
|
|
|
|
|
|
|
|
|
|
|
|
|
|
|
|
|
|
|
|
|
|
|
|
|
|
|
|
|
|
|
|
|
|
|
|
|
|
|
|
|
|
|
|
|
|
|
|
|
|
|
|
|
|
|
|
|
|
|
|
|
|
|
|
|
|
|
|
|
|
|
|
|
|
|
|
|
|
|
|
|
|
|
|
|
|
|
|
|
|
|
|
|
|
|
|
|
|
|
|
|
|
|
|
|
|
|
|
|
|
|
|
|
|
|
|
|
|
|
|
|
|
|
|
|
|
|
|
|
|
|
|
|
|
|
|
|
|
|
|
|
|
|
|
|
|
|
|
|
|
|
|
|
|
|
|
|
|
|
|
|
|
|
|
|
|
|
|
|
|
|
|
|
|
|
|
|
|
|
|
|
|
|
|
|
|
|
|
|
|
|
|
|
|
|
|
|
|
|
|
|
|
|
|
|
|
|
|
|
|
|
|
|
|
|
|
|
|
|
|
|
|
|
|
|
|
|
|
|
|
|
|
|
|
|
|
|
|
|
|
|
|
|
|
|
|
|
|
|
|
|
|
|
|
|
|
|
|
|
|
|
|
|
|
|
|
|
|
|
|
|
|
|
|
|
|
|
|
|
|
|
|
|
|
|
|
|
|
|
|
|
|
|
|
|
|
|
|
|
|
|
|
|
|
|
|
|
|
|
|
|
|
|
|
|
|
|
|
|
|
|
|
|
|
|
|
|
|
|
|
|
|
|
|
|
|
|
|
|
|
|
|
|
|
|
|
|
|
|
|
|
|
|
|
|
|
|
|
|
|
|
|
|
|
|
|
|
|
|
|
|
|
|
|
|
|
|
|
|
|
|
|
|
|
|
|
|
|
|
|
|
|
|
|
|
|
|
|
|
|
|
|
|
|
|
|
|
|
|
|
|
|
|
|
|
|
|
|
|
|
|
|
|
|
|
|
|
|
|
|
|
|
|
|
|
|
|
|
|
|
|
|
|
|
|
|
|
|
|
|
|
|
|
|
|
|
|
|
|
|
|
|
|
|
|
|
|
|
|
|
|
|
|
|
|
|
|
|
|
|
|
|
|
|
|
|
|
|
|
|
|
|
|
|
|
|
|
|
|
|
|
|
|
|
|
|
|
|
|
|
|
|
|
|
|
|
|
|
|
|
|
|
|
|
|
|
|
|
|
|
|
|
|
|
|
|
|
|
|
|
|
|
|
|
|
|
|
|
|
|
|
|
|
|
|
|
|
|
|
|
|
|
|
|
|
|
|
|
|
|
|
|
|
|
|
|
|
|
|
|
|
|
|
|
|
|
|
|
|
|
|
|
|
|
|
|
|
|
|
|
|
|
|
|
|
|
|
|
|
|
|
|
|
|
|
|
|
|
|
|
|
|
|
|
|
|
|
|
|
|
|
|
|
|
|
|
|
|
|
|
|
|
|
|
|
|
|
|
|
|
|
|
|
|
|
|
|
|
|
|
|
|
|
|
|
|
|
|
|
|
|
|
|
|
|
|
|
|
|
|
|
|
|
|
|
|
|
|
|
|
|
|
|
|
|
|
|
|
|
|
|
|
|
|
|
|
|
|
|
|
|
|
|
|
|
|
|
|
|
|
|
|
|
|
|
|
|
|
|
|
|
|
|
|
|
|
|
|
|
|
|
|
|
|
|
|
|
|
|
|
|
|
|
|
|
|
|
|
|
|
|
|
|
|
|
|
|
|
|
|
|
|
|
|
|
|
|
|
|
|
|
|
|
|
|
|
|
|
|
|
|
|
|
|
|
|
|
|
|
|
|
|
|
|
|
|
|
|
|
|
|
|
|
|
|
|
|
|
|
|
|
|
|
|
|
|
|
|
|
|
|
|
|
|
|
|
|
|
|
|
|
|
|
|
|
|
|
|
|
|
|
|
|
|
|
|
|
|
|
|
|
|
|
|
|
|
|
|
|
|
|
|
|
|
|
|
|
|
|
|
|
|
|
|
|
|
|
|
|
|
|
|
|
|
|
|
|
|
|
|
|
|
|
|
|
|
|
|
|
|
|
|
|
|
|
|
|
|
|
|
|
|
|
|
|
|
|
|
|
|
|
|
|
|
|
|
|
|
|
|
Fig. 6.13 Frequency allocation method
After calculating the emission spectrum that makes an equipment compatible, the spectrum of the transmitting equipment at the receiver shall be compared with the red standard limit. When there is interference, the allocation method in Sect. 4.3.6 can be followed to perform quantitative allocation of indicators.