

Industrial Control (Students guide, 1999, v1.1 )
.pdfExperiment #2: Digital Input Signal Conditioning
Field Activity
How many digital (bi-state) field devices can you identify in a new car? List as many as you can. Make a note as to whether you suspect that the field device directly controls load current , drives some sort of relay, or if you think its status is being monitored by a microcontroller.
Industrial Control Version 1.1 •Page 69

Experiment #3: Digital Output Signal Conditioning
Page 70 •Industrial Control Version 1.1
Experiment #3: Digital Output Signal Conditioning
he outputs of a microcontroller can be used to control the status of output field devices. Output devices are those devices that do the work in a process-control application. They deliver the energy to the process under control. A few common examples include motors, heaters, solenoids, valves, and lamps. The lowpower output capability of the BASIC Stamp (or any
microcontroller) prevents it from providing the power required by these loads. With proper signal conditioning, the BASIC Stamp can control power transistors, thyristors, and relays. These are the devices that can deliver the load current and voltage demands of the field devices. In some applications, you may use a BASIC Stamp output to communicate with another microcontroller or electronic circuit. There may be compatibility issues of different logic families, separate power supplies, or uncommon grounds that require special consideration. The focus of this experiment is to present some of the signal conditioning techniques used to interface your BASIC Stamp to output field devices.
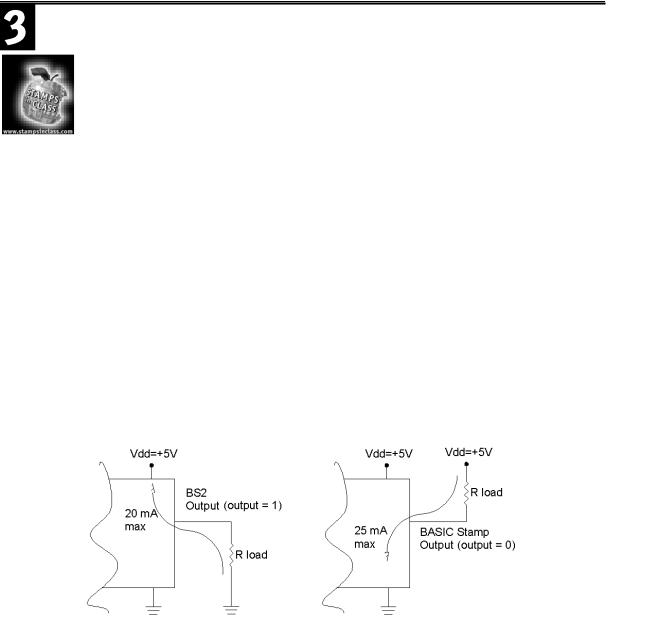
Appropriate signal conditioning design begins with a brief look at the characteristics and limitations of the BASIC Stamp’s outputs. The output of the BASIC Stamp is considered “standard TTL” level. As we discussed in Experiment #2, this means it can switch between logic high of approximately 5 volts or logic low of nearly 0 volts. According to the BASIC Stamp’s datasheet, each output can sink 25 mA and source 20 mA of current. Relating this to the partial diagram in Figure 3.1, notice how the load can be connected. In Figure 3.1a, the load is wired from the output pin to ground. When you set an output pin high, five volts appear across the load resistor (RL). Load current will flow from ground through the resistor and into the output pin. This is the current source mode, and the BASIC Stamp can deliver a maximum of 20 mA to the load.
Figure 3.1: BASIC Stamp Output Pin Current Capability
Figure 3.1a: Current Source |
Figure 3.1b: Current Sink |
Industrial Control Version 1.1 •Page 71
Experiment #3: Digital Output Signal Conditioning
In Figure 3.1b, the load is between the output pin and the +5-volt Vdd supply. Electrons will flow through the load now when the BASIC Stamp output pin is set Low (ground). Current will flow out of the output pin and up through the load resistor to Vdd. This is the current sinking mode, and the BASIC Stamp can deliver a maximum of 25 mA to the load when configured in this manner.
Output Capability of Digital Circuits
The output capability of digital circuits is listed in the manufacturer’s datasheet. Devices usually can “sink” more current than they can “source.” Some devices do not have the capability to source current because the internal path from their output to +V is not present. You may see this output design referred to as a device with an “open collector” output.
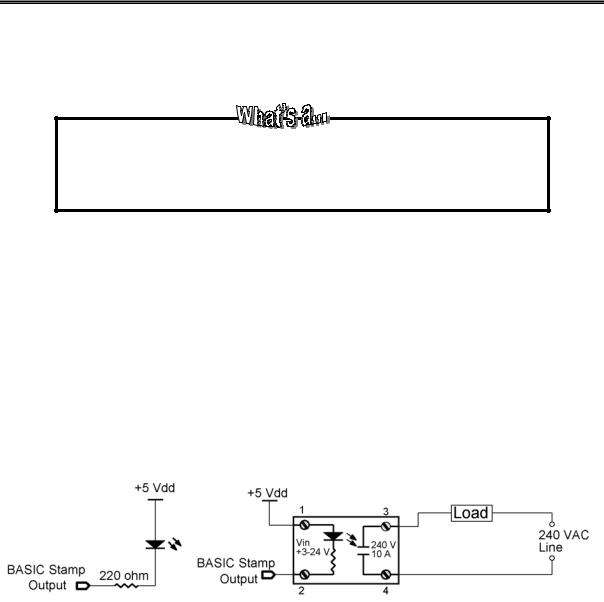
Outputs have been used to drive LEDs in previous exercises as pictured in Figure 3.2a. When the BASIC Stamp output is low, the diode is forward-biased at approximately one volt, and the remaining four volts, dropped across the 220-ohm resistor, limit current flow to approximately 22 mA. The light emitted by the diode gives visual indication of the output action. In previous programming challenges, you have assumed that the on-off status of an LED represents process action taking place. This is a valid assumption when you consider the operation of a solid-state relay (SSR). Figure 3.2b is a schematic representation of the solid-state relay. The input circuit (terminals 1-2) is equivalent to Figure 3.2a. The +3 to +24 V DC input identifies a range of control voltages. Control voltages must be above the minimum voltage to produce enough LED current for turn-on. Exceeding the maximum control voltage may cause damaging amounts of current to flow in the input LED. The light generated in the SSR strikes an optically controlled output circuit. The detail of this circuit is not shown, but is represented by the normally-open contact symbol. The current and voltage limitations of the output are listed in the device’s datasheet and are usually printed on the device itself.
Figure 3.2: BASIC Stamp to LED and Solid-State Relay Schematics
Figure 3.2a: BASIC Stamp to LED |
Figure 3.2b: BASIC Stamp to Solid-State Relay |
Page 72 •Industrial Control Version 1.1

Experiment #3: Digital Output Signal Conditioning
Solid-state relays are available in a wide variety of output ranges. They may be designed to drive either AC loads or DC loads. The load you are driving defines the minimum specification of the SSR required.
An added benefit of the solid-state relay is electrical isolation. The BASIC Stamp is controlling the load by an optically-coupled signal. There is no electrical connection between the microcontroller and the high-power load device. Electrical failures of the load, or power line problems such as spikes, are not fed back to the BASIC Stamp. The datasheet for the Potter-Brumfield SSR may be found in Appendix C. Refer to this datasheet and find the following information.
Input voltage range: |
____________ |
Input current requirement @ five volts: |
____________ |
Maximum output load current: |
____________ |
Maximum output load voltage: |
____________ |
Electrical isolation: |
____________ |
A word of caution when selecting and implementing solid-state relays:
1.Do not push the specifications to their limits. Oversize the output capability of your selection by at least 20%.
2.Pay close attention to any heatsink requirements. Maximum load current capability is usually dependent upon incorporating a proper heatsink.
3.The load’s supply source and all wiring and connections must be able to conduct the load’s current. If relays are placed on the breadboard for prototyping, be aware that the breadboard traces are rated at only 1 amp.
4.Respect the output circuit voltage. Be sure all connections are solidly secured and correct before applying line voltage. There is the risk of electrical shock. Take measures to prevent contact with high-voltage potentials. Shield or encase these contacts. Clearly identify high-voltage potentials with appropriate labeling.
5.Some electronic relays will not contain an internal current-limiting resistor on the input. In these cases, an external current-limiting resistor must be added in series with the internal LED. The value of the resistor is based on your control voltage and the manufacturer’s recommended input current specification.
Solid-state relays provide an easy interface for controlling loads in an industrial application. Become familiar with the SSR datasheet specifications in order to make the right selection for your application.
Industrial Control Version 1.1 •Page 73

Experiment #3: Digital Output Signal Conditioning
Exercises
Exercise #1: Sequential Control
The BASIC Stamp is well suited to perform sequential control operations. Many processes depend on the orderly performance of operations. Consider the machining operation pictured in Figure 3.3a.
Figure 3.3a: AutoDrill Sequence Operation
Page 74 •Industrial Control Version 1.1
Experiment #3: Digital Output Signal Conditioning
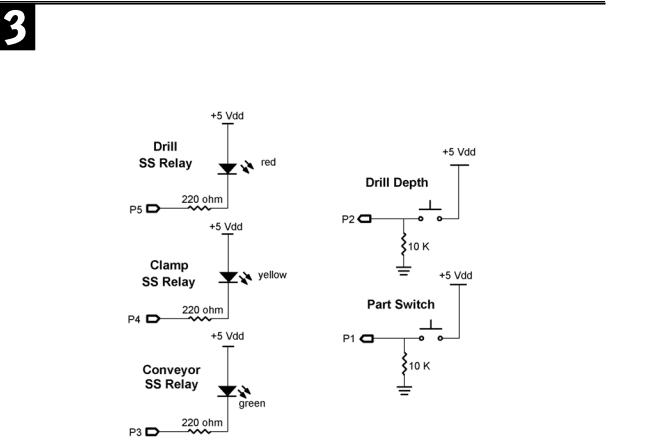
Figure 3.3b: Sequential Control (outputs are on the left; inputs shown to right)
A conveyor is moving parts through a machining station. When a part is detected in the staging area, the conveyor is turned off. After a short pause, the solenoid clamp is activated to hold the part; another short pause, and then the drill is brought down to the part. A proximity switch detects proper depth of the hole. When the depth switch closes, the “drill down” command is stopped and the drill is retracted. After allowing a short time for the drill to retract, the clamp is released and the conveyor is started. This moves the processed part out of the staging area, and the conveyor continues until a new part is detected. Upon detecting another part, the sequential process continues.
With proper signal conditioning, the BASIC Stamp can easily control this sequence. For our exercise purposes, you are asked to use your imagination to allow LEDs to simulate the SSRs that could control the conveyor, clamp, and drill. Two pushbuttons and your two fingers must simulate the part coming into position and the drill coming down to proper depth. Construct Figure 3.3b on your Board of Education. For easier
Industrial Control Version 1.1 •Page 75
Experiment #3: Digital Output Signal Conditioning
identification, use your green LED for the conveyor, your yellow LED for the clamp, and the red LED for the drill.
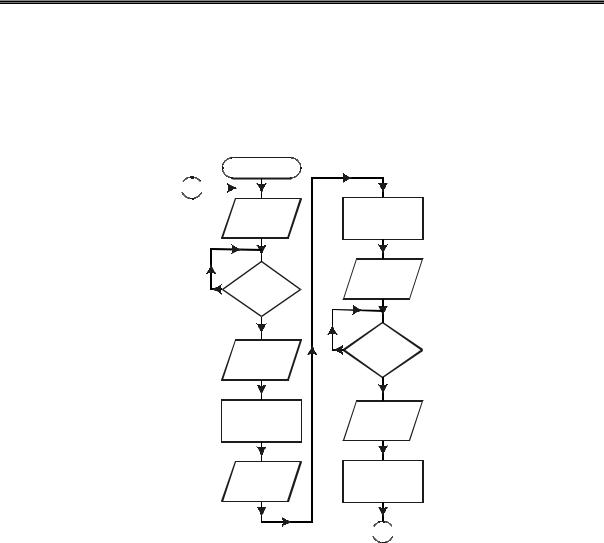
Sequential control lends itself well to flowcharting. The time required to develop your flowchart will be quickly saved as you write your program. Compare the flowchart in Figure 3.4 to the description of the machining process.
Figure 3.4: Sequential Control Flowchart
Start
 A
A 

Energize
Conveyor
Part ?
No
Yes
De-energize
conveyor
2Second Pause
Close
Clamp
2Second Pause
Energize drill (down)
Drill at
Depth?
No
Yes
De-energize
drill (up)
2Second pause
 A
A 
Program 3.1 follows the flowchart very closely. Study the program; compare its structure to the flowchart. Enter the program and try it. Again, you will have to use your imagination to simulate our process.
When the program starts, the green LED will be on. This represents the conveyor starting. To simulate a part coming into the staging area, you must press and hold Pushbutton P1. The conveyor LED will instantly turn OFF and the yellow LED indicating the Clamp relay will turn on after a one-second delay. After the Clamp has had
Page 76 •Industrial Control Version 1.1

Experiment #3: Digital Output Signal Conditioning
two seconds to secure the part, the drill will come down toward the part as indicated by the red LED. At this time bring another finger down to simulate the drill. Pushbutton P2 represents a proximity switch, which will indicate when proper drill depth has been reached. Your “drill” finger pressing P2 will be turned OFF; the red LED indicating the drill is retracting. Your finger now coming off of the P2 pushbutton indicates the bit has started retracting and two seconds will be allowed for the drill to clear the part. After this delay, the clamp will be opened (yellow light OFF) and the conveyor will start again. The part is completed and leaves the staging area. From this point the sequence starts again.
Run the program a few times. Other than the DEBUG report that a part has been completed, there is no need for your computer. Unplug the serial cable from the Board of Education and continue to simulate the sequential process. The BASIC Stamp could function as the “embedded controller” in this application. Wiring the actual field devices to the BASIC Stamp would allow it to continuously repeat the process.
After understanding this sequential process, we will redefine your two inputs and three outputs to simulate another operation. You will be challenged to develop the program necessary for this embedded control application.
'Program 3.1: Sequential Process Control Machining Operation - Embedded
INPUT 1 |
|
|
' Part detection switch |
|
INPUT 2 |
3 |
|
' Drill depth switch |
|
OUTPUT |
|
' Conveyor motor relay (green) |
||
OUTPUT |
4 |
|
' Clamp solenoid relay (yellow) |
|
OUTPUT |
5 |
|
' Drill press relay (red) |
|
Off |
CON 1 |
|
' Current sink loads |
|
On |
CON 0 |
|
' Negative logic |
|
OUT3 = |
Off |
' Initialize outputs off |
||
OUT4 = |
Off |
|
||
OUT5 = |
Off |
|
||
Start: |
= |
On |
' Conveyor on |
|
OUT3 |
||||
IF IN1 |
= 1 THEN Process |
' If pressed, start "Process" |
||
GOTO Start |
|
|||
Process: |
Off |
' The process begins |
||
OUT3 |
= |
' Stop conveyor |
||
PAUSE 1000 |
' Begin clamping part in place |
|||
OUT4 |
= |
On |
||
PAUSE 2000 |
' Wait 2 seconds to turn drill on |
|||
Drill_down: |
' Turns on drill and drill begins dropping |
|||
OUT5 |
= |
On |
||
IF IN2 |
= 1 THEN Pull_drill |
' If drill is deep enough, pull drill |
||
GOTO Drill_down |
|
|||
Industrial Control Version 1.1 •Page 77

Experiment #3: Digital Output Signal Conditioning
Pull_drill: |
' Turns off drill and drill retracts |
|
OUT5 = |
OFF |
|
IF IN2 |
= 0 THEN Drill_up |
' Indicates drill is moving up |
GOTO Pull_drill |
|
|
Drill_up: |
|
' Continue pulling drill up for 2 seconds |
PAUSE 2000 |
||
Release: |
Off |
' Open clamp to release part |
OUT4 = |
||
PAUSE 1000 |
' Wait 1 second |
|
OUT3 = |
On |
' Conveyor on |
IF IN1 |
= 0 THEN Next_part |
' Finished part leaves process area |
GOTO Release |
|
|
Next_part: |
' Wait 1 second |
|
PAUSE 1000 |
||
DEBUG "Part leaving clamp. Starting next cycle", CR
GOTO Start
The real beauty of microcontrollers is to have the capability of embedding all of the intelligence necessary to perform sophisticated control within the equipment.
There are times, however, that being able to retrieve information from the microcontroller adds to its capabilities. The StampPlot Lite interface can be effectively used to monitor the sequential machining process. Program 3.2 uses this interface. The machine functions in Program 3.2 are the same as those in the previous program. DEBUG commands have been embedded to send data to the StampPlot Lite interface. The program plots the status of the digital I/O, reports process steps in the User status bar, and keeps a time-stamped list of the total parts produced. Figure 3.5 is a representative screen shot of the sequential process being monitored by StampPlot Lite. Load Program 3.2 and run it. Study the StampPlot Lite DEBUG commands that have been added to the original program. Become familiar with their use. Graphical user interfaces such as this are very useful in the maintenance and data acquisition of embedded control systems. Use StampPlot to monitor the Sequential Control Mixing Challenge at the end of this section.
Program 3.2: Sequential Process Control Machining Operation with StampPlot Interface
Pause 500
DEBUG "!TITL Sequential Process Control Machining Operation", CR ' StampPlot title
DEBUG "!TMAX 100", CR |
' Set sweep plot time (seconds) |
||
DEBUG "!PNTS 500", |
CR |
' Sets the number |
of data points |
DEBUG "!AMAX 20", |
CR |
' Sets vertical axis (counts) |
|
DEBUG "!CLRM", CR |
|
' Clear List Box |
|
DEBUG "!CLMM", CR |
|
' Clear Min/Max |
|
DEBUG "!RSET", CR |
|
' Reset all plots |
file |
DEBUG "!DELD", CR |
|
' Delete old data |
|
DEBUG "!PLOT ON", CR |
' Turn Plot on |
completion |
|
DEBUG "!TSMP ON", CR |
' Time-stamp part |
||
Page 78 •Industrial Control Version 1.1