

Industrial Control (Students guide, 1999, v1.1 )
.pdfExperiment #1: Flowcharting and StampPlot Lite
Figure 1.8: Exercise 3 - Simple Heater Flowchart
Industrial Control Version 1.1 •Page 19

Experiment #1: Flowcharting and StampPlot Lite
Enter and run Program 1.2. Monitor the value in debug window while adjusting the potentiometer and note what occurs as the value rises above 120 and below 100.
'Program 1.2, Simple Heater |
'LED1 is on P4 |
||
LED1 |
VAR |
OUT4 |
|
RC |
CON |
7 |
'RC network is on Pin 7 |
Temp |
VAR |
WORD |
'Pot is a variable to hold results |
OUTPUT 4 |
|
'Setup LED as output |
|
LED1 = 1 |
|
'Energize initially |
|
Main: |
|
|
'Read pot value as temperature |
GOSUB ReadTemp |
|||
GOSUB CheckTemp |
'check temp to setpoint |
||
PAUSE 250 |
|
|
|
GOTO Main |
|
|
|
ReadTemp |
|
'Read Potentiometer |
|
HIGH RC |
|
||
PAUSE 10 |
|
|
|
RCTIME RC, 1, Temp |
'Scale the results down, |
||
Temp = Temp/30 |
|||
DEBUG "Temp = ",dec Temp, CR |
'store as temperature |
||
|
|||
RETURN |
|
|
|
CheckTemp: |
|
'If Temp > 100, or heat already on, |
|
|
|
|
'check if should be off |
IF (Temp > 100) OR (LED1 = 1) THEN CheckOff |
|||
LED1 = 1 |
|
'If not, then energize and display |
|
DEBUG "The heater energized",CR |
|
||
CheckOff: |
|
'If Temp < 120 or heat is off already, all done |
|
IF (Temp < 120) OR (LED1 = 0) THEN CheckDone |
|||
LED1 = 0 |
|
'if not, then energize and display |
|
DEBUG "The heater de-energized", CR |
|
||
CheckDone: |
|
|
|
RETURN |
|
|
|
Programming Challenge
Modify the process flowchart and program so the LED indicates an air conditioner cycling between 70 and 75 degrees.
Exercise #4: Using StampPlot Lite
Page 20 •Industrial Control Version 1.1

Experiment #1: Flowcharting and StampPlot Lite
While the debug window for the BASIC Stamp is very useful for obtaining data and information from the BASIC Stamp, it can be difficult to visualize the data without careful scrutiny. Is the temperature increasing or decreasing? How quickly is it changing? At what point did the output change? What temperature is it cycling around?
Enter StampPlot Lite! StampPlot Lite (SPL) was specifically developed for this text. SPL accepts data from the BS2 in the same fashion the debug window does, only SPL interprets the data and performs on of 4 actions based on the structure of the data:
•A value is plotted on an analog scale in real time.
•A binary value starting with % is plotted as digital traces in real time.
•Strings beginning with ! are interpreted as instructions to control and configure SPL.
•Any other string is listed as a message at the bottom of SPL and optionally time-stamped.
A main rule of SPL is that each line must end in a carriage return (13 or CR).
Please review Appendix A for a more in-depth discussion of StampPlot Lite.
If you have not yet installed StampPlot Lite, install it on your computer by downloading it from http://www.stampsinclass.com. Double-click the setup button and install it in your designated directory.
Let's take another look at Program 1.2, our simple heater, but this time using StampPlot Lite to help visualize the process. Program 1.2 has been rewritten as Program 1.3 to utilize StampPlot Lite (bold lines are added/modified from program 1.2).
'Program 1.3; Simple Heater using StampPlot Lite
'Configure StampPlot Lite |
|
||
PAUSE 500 |
|
'Set span for 50-150 |
|
DEBUG "!SPAN 50,150",CR |
|||
DEBUG "!TMAX 60",CR |
'Set for 60 seconds |
||
DEBUG "!PNTS 500",CR |
'500 data points per plot |
||
DEBUG "!TITL Simple Heater Control",CR |
'Title the form |
||
DEBUG "!SHFT ON",CR |
'Allow plot to shift at max |
||
DEBUG "!TSMP ON",CR |
'Enable plotting |
||
DEBUG "!PLOT ON",CR |
|||
DEBUG "!RSET",CR |
'Reset Plot |
||
LED1 |
VAR |
OUT4 |
'LED1 is on P4 |
RC |
CON |
7 |
'RC network is on Pin 7 |
Temp |
VAR |
WORD |
'Pot is a variable to hold results |
OUTPUT 4 |
|
'Setup LED as output |
|
LED1 = 1 |
|
'Energize initially |
|
Industrial Control Version 1.1 •Page 21

Experiment #1: Flowcharting and StampPlot Lite
Main: |
'Read pot value as temperature |
|
GOSUB ReadTemp |
|
|
GOSUB CheckTemp |
'check temp. to setpoint |
|
PAUSE 250 |
|
|
GOTO Main |
|
|
ReadTemp |
'Read Potentiometer |
|
HIGH RC |
|
|
PAUSE 10 |
|
|
RCTIME RC, 1, Temp |
'Scale the results down, |
|
Temp = Temp/30 |
|
|
DEBUG DEC Temp, CR |
'store as temperature |
|
'Send temperature value |
|
|
DEBUG IBIN LED1,CR |
'Send LED Status |
|
RETURN |
|
|
CheckTemp: |
'If Temp > 100, or heat already on, |
|
|
'check if should be off |
|
IF (Temp > 100) OR (LED1 = 1) THEN CheckOff |
|
|
LED1 = 1 |
'If not, then energize and display |
|
DEBUG "The heater energized",CR |
'Update SPL status bar |
|
DEBUG "!USRS The heater is energized!",CR |
|
|
CheckOff: |
'If Temp < 120 or heat is off, all done |
|
IF (Temp < 120) OR (LED1 = 0) THEN CheckDone |
|
|
LED1 = 0 |
'if not, then energize and display |
|
DEBUG "The heater de-energized", CR |
|
|
DEBUG "!USRS The heater is de-energized!",CR 'Update SPL Status Bar |
|
|
CheckDone: |
|
|
RETURN |
|
|
Download this program to your BASIC Stamp, and follow these instructions to use StampPlot Lite. |
|
|
• Start StampPlot Lite by using |
your Windows Start button and |
going to |
Programs/StampPlot/StampPlot Lite. |
|
|
•Enter and run Program 1.3 on your BASIC Stamp.
•Close the BASIC Stamp editor’s blue debug window.
•Select the correct COM port in StampPlot Lite and click 'Connect.'
•
•Reset the BASIC Stamp by pushing the button on the Board of Education. Now you’re ready to use this unique software utility.
Page 22 •Industrial Control Version 1.1
Experiment #1: Flowcharting and StampPlot Lite
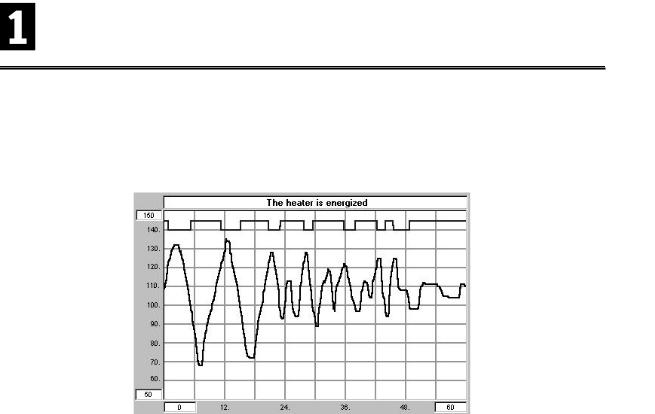
At this point you should see data being plotted. Adjust the 10K-ohm potentiometer with your fingers or a small screwdriver. The analog line displays the value of the potentiometer. The digital trace at the top displays the status of the LED indicator. Figure 1.9 is a sample capture of the plot from our circuit.
Figure 1.9: StampPlot Lite Graph of Exercise #4
Note the correlation between the analog value and the switching of the digital output. Use the various controls on StampPlot Lite to become familiar with the functions and features. Analyze Program 1.3 and note the various configuration settings and data sent to the application. Refer to Appendix A for additional information on StampPlot Lite if you are having problems understanding the basics of the software utility.
Programming Challenge
Modify your air conditioner challenge from Exercise #2 to use StampPlot Lite. Configure your program to transmit data approximately every 0.5 seconds. Calculate the number of data points needed to fill the screen within a maximum of 60 seconds, and test.
Just for fun!
Enter and run the following program. The potentiometer simulates a single-handle shower (mixer) valve with adjustment delay. Adjust the shower temperature for a constant 110 degrees. See how fast you can stabilize the temperature at the set point! Press the reset button on the Board of Education and try again. We'll leave it up to you to figure out the program.
Industrial Control Version 1.1 •Page 23

Experiment #1: Flowcharting and StampPlot Lite
'PROGRAM 1.4: ADJUST THE SHOWER!
SetPoint |
VAR BYTE |
CurTemp |
VAR BYTE |
Diff |
VAR BYTE |
TempSet VAR WORD |
|
RC |
CON 7 |
LED1 |
CON 4 |
SetPoint = 110
PAUSE 500
DEBUG "!RSET",CR,"!SPAN 0,200",CR,"!TMAX 30",CR,"!PLOT ON",CR DEBUG "!TSMP ON",CR,"!MAXS",CR,"!PNTS 100",13
DEBUG "!USRS ADJUST THE TEMP FOR ",DEC SetPoint,CR
Main:
HIGH RC
PAUSE 10
RCTIME RC,1,TempSet
TempSet = TempSet/ 30
IF TempSet > CurTemp THEN Higher
IF TempSet < CurTemp THEN Lower
GOTO Display
Higher:
DIFF = TempSet - CurTemp/5
CurTemp = CurTemp + Diff
GOTO Display
Lower:
Diff = CurTemp - TempSet/5
CurTemp = CurTemp - Diff
Display:
LOW LED1
DEBUG DEC CurTemp,CR
IF CurTemp <> SetPoint THEN SkipBeep
DEBUG "AT SETPOINT!",CR,"!BELL",CR
HIGH LED1
SkipBeep:
PAUSE 250
GOTO Main
Page 24 •Industrial Control Version 1.1

Experiment #1: Flowcharting and StampPlot Lite
Questions and Challenge
1.List one everyday human process that involves a decision. List the steps in performing the process and the decisions needed to be made.
2.Develop a simple flowchart for the process in Question #1.
3.List an example of an electronics process in your home or school (such as that of an electric or microwave oven control, alarm clock, etc). Develop a simple flowchart to describe the process.
4.Develop the flowchart and code for the following process: The potentiometer simulates a temperature sensor. If the temperature exceeds 100 degrees, lock on the alarm (LED). Do not clear the alarm until the pushbutton is pressed.
5.Modify the program from Question #4 to use StampPlot Lite to display the temperature, alarm bit and status of the alarm.
Industrial Control Version 1.1 •Page 25
Experiment #2: Digital Input Signal Conditioning
Experiment #2: Digital Input Signal Conditioning
Process control relies on gathering input information, evaluating it, and initiating action. In industrial control, input information most often involves monitoring field devices whose outputs are one of two possible states. A switch is the most common example of a “bi-state” device. It is either open or closed.
Switches can provide control of an operation in three ways. One may be wired directly with the load and therefore control the full current and voltage. A switch also can be wired in the input circuit of a relay. In this case, the switch controls the relay’s relatively low power input and the output contacts control load power. The on/off status of a switch may also provide a digital input to a programmable controller.
How many switches have you used today? And, what processes were affected by the toggling of those switches? Table 2.1 lists a few possibilities, starting at the beginning of your day:
Table 2.1: Switch Possibilities at the Beginning of your Day
Switch Status |
Result |
First, you may slap the “SNOOZE” button on your |
The buzzing stops and -- Ah! 5 more minutes of sleep! |
alarm clock. |
|
Next, stumble to the bathroom and flip “ON” the |
Ouch! Turn it “OFF.” Those vanity lights hurt! |
bathroom light. |
|
Now, into the kitchen, start your coffeemaker, |
Breakfast is ready. And who knows if that light really |
press down the toaster, and program your |
goes off when you close the refrigerator? |
microwave. Open the refrigerator and the light |
|
comes on . |
|
Turn on the thermostat. |
Heat or AC – your choice. What temperature? A |
|
setpoint is usually just a “switching point.” |
Turn on your TV, change the channel, turn up the |
The pushbuttons on the front or the flashing infrared |
volume. |
LED in your remote– they all still just switch data. |
Make a phone call. Lift the receiver and check for |
The limit switch held down by the handset now is in |
dial tone. Key in the phone number. |
its “off the hook” position. Each switch on the keypad |
|
allows a specific tone to be generated. |
Boot your PC. Switch on the monitor. Left click |
These are only three obvious ones. There are many |
the mouse to check your e-mail. |
more switches behind the scenes in your PC. |
You are up to 15 switches and you haven’t even left your house!
Industrial Control Version 1.1 •Page 27
Experiment #2: Digital Input Signal Conditioning
Some of the switches listed in Table 2.1 probably have direct control of electrical continuity to the loads involved. For example, the bathroom light switch controls the actual current flowing to the vanity light bulbs. The thermostat is an example of a switch controlling a low-voltage system that controls a relay in your furnace or air conditioner.
Most of the switches in Table 2.1, however, probably are providing a digital high or low signal being monitored by an electronic control system. It is the status of this input signal that is evaluated and used to determine the appropriate state of the outputs involved. The snooze button isn’t physically opening the alarm circuit of your clock radio. When you “slapped” it, the momentary change of state was recognized by a programmable circuit. As a result, the program instructed the output to go off and add five minutes to the programmed alarm time. The start button on your microwave doesn’t have to carry the actual current that powers the magnatron, inside light, and ventilation fan. However, pressing it creates an input causing the oven’s microcontroller to close relays that do handle these loads.
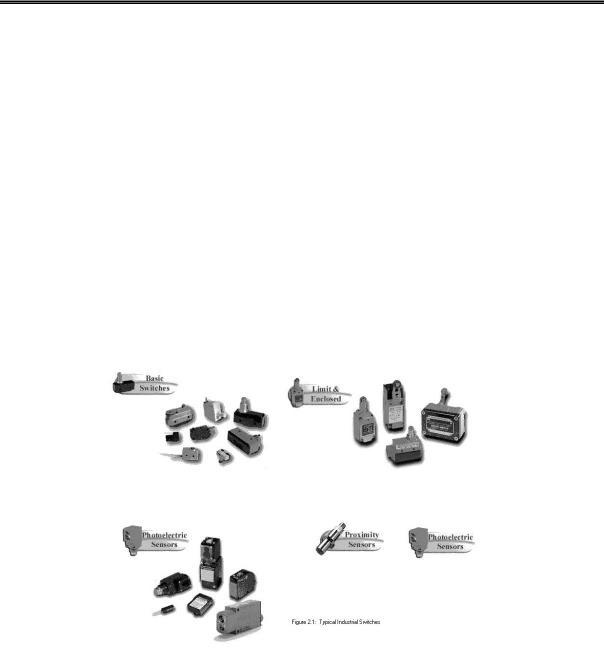
Most often we think of switches as mechanical devices that make and break continuity between contact points in a circuit. In the case of the manual pushbutton and the limit switches pictured in Figure 2.1, this is exactly the case.
Figure 2.1: A Variety of Manual Pushbutton and Mechanical Limit Switches
Page 28 •Industrial Control Version 1.1