

Industrial Control (Students guide, 1999, v1.1 )
.pdf
|
Experiment #7: Real-time Control and Data Logging |
|
|
|
|
RETURN |
|
TimeControl: |
' Check if time for reading |
IF (Time = LTime) AND (MemAddr-4 < Samples) THEN SaveData |
|
RETURN |
|
SaveData: |
' Write ADC reading to memory |
WRITE MemAddr, DataIn |
' Store data into EEPROM |
HIGH 8:PAUSE 250:LOW 8 |
' Blink LED |
MemAddr = MemAddr + 1 |
' Increment memory location for next reading |
WRITE 0,MemAddr.HIGHBYTE |
' Update recovery data |
WRITE 1,MemAddr.LOWBYTE |
|
LMinutes = LMinutes + Interval |
' Update for next interval |
IF MemAddr-4 < Samples THEN AdjustTime' If samples not full, continue |
|
IF Stop_Reset = 1 THEN Dont_Reset |
' If samples full, restart or end logging |
GOSUB RecoveryData |
|
Dont_Reset: |
|
AdjustTime: |
'Decimal adjust Time |
IF LSeconds.LOWNIB < $A THEN HighSec |
|
LSeconds = LSeconds + 6 |
|
HighSec: |
|
If LSeconds < $60 THEN LowMin |
|
LSeconds = LSeconds - $60 |
|
LMinutes = LMinutes + 1 |
|
LowMin: |
|
IF LMinutes.LOWNIB < $A THEN HighMin |
|
LMinutes = LMinutes + 6 |
|
HighMin: |
|
IF LMinutes < $60 THEN LowHours |
|
LMinutes = LMinutes - $60 |
|
LHours = LHours + 1 |
|
LowHours: |
|
IF LHours.LOWNIB < $A THEN HighHours |
|
LHours = LHours + 6 |
|
HighHours: |
|
IF LHours < $24 THEN AdjustDone |
|
LHours = LHours - $24 |
|
AdjustDone: |
|
RETURN |
|
Display: |
'Display real time and time for next log reading |
DEBUG "!USRS Time:", HEX2 hours,":",HEX2 minutes,":",HEX2 seconds
DEBUG " Sample Due:",HEX2 LHours,":",HEX2 LMinutes,":",HEX2 LSeconds
DEBUG " # ",DEC MemAddr-4, " Temp now = ", DEC Temp,CR
DEBUG DEC Temp,CR
Return
SetTime:
'****** Initialize the real time clock to start time RTemp = $10 : RTCCmd = CtrlReg : GOSUB WriteRTC
'Clear Write Protect bit in control register
Industrial Control Version 1.1 •Page 209

Experiment #7: Real-time Control and Data Logging
RTemp = |
Hours : |
RTCCmd = |
HrsReg : |
GOSUB WriteRTC ' |
Set initial hours |
RTemp = |
Minutes |
: RTCCmd |
= MinReg |
: GOSUB WriteRTC ' |
Set initial minutes |
RTemp = |
Seconds |
: RTCCmd |
= SecReg |
: GOSUB WriteRTC ' |
Set initial seconds |
RTemp = |
$80 : RTCCmd = CtrlReg : GOSUB WriteRTC |
|
|||
' Set write-protect bit in control register |
|
||||
Return |
|
|
|
|
|
WriteRTC: |
|
|
|
' |
Write to DS1302 RTC |
HIGH RTCReset
SHIFTOUT RTC_IO, RTC_CLK, LSBFIRST, [%0\1,RTCCmd\5,%10\2,RTemp]
LOW RTCReset
RETURN |
|
|
|
ReadRTCBurst: |
|
|
' Read all data from RTC |
HIGH RTCReset |
|
|
|
SHIFTOUT RTC_IO, RTC_CLK, LSBFIRST, [%1\1,BrstReg\5,%10\2] |
|||
SHIFTIN RTC_IO, RTC_CLK, LSBPRE, [Seconds,Minutes,Hours] |
|||
LOW RTCReset |
|
|
|
RETURN |
|
|
|
RecoveryData: |
|
|
' Stores data for recovery from restart |
MemAddr = 4 |
|
' Set starting location |
|
WRITE 0,MemAddr.HIGHBYTE |
' Write to EEPROM |
||
WRITE 1,MemAddr.LOWBYTE |
' Save start time in EEPROM |
||
WRITE 2,Hours |
|
||
WRITE 3,Minutes |
|
|
|
Return |
|
|
|
'*** Download and siplay logged data *** |
|
||
DumpData: |
|
|
|
'Configure Plot |
|
' Allow buffer to clear |
|
PAUSE 500 |
|
||
DEBUG "!RSET",CR |
' Reset plot to clear data |
||
DEBUG "!TITL Interval Data Logging",CR |
' Title the plot |
||
DEBUG "!PNTS 2000",CR |
' 2000 sample data points |
||
DEBUG "!TMAX ", DEC MemAddr/7+1,CR |
' Time based on number of samples |
||
DEBUG "!SPAN ",DEC offset/10,",",DEC (TempSpan/10 + Offset) / 10,CR |
|||
DEBUG "!AMUL .1",cr |
' Multiply data by 0.1 |
||
DEBUG "!CLMM",CR |
' Clear Min/Max |
||
DEBUG "!CLRM",CR |
' Clear messages |
||
DEBUG "!TSMP OFF",CR |
' Time Stamping off |
||
DEBUG "!SHFT ON",CR |
' Enable plot shift |
||
DEBUG "!DELM",CR |
' Delete message file |
||
DEBUG "!SAVM ON",CR |
' Save messages (logged data) to file |
||
DEBUG "!PLOT ON",CR |
' Start plotting |
||
PAUSE 500 |
|
' Reset plot to time 0 |
|
DEBUG "!RSET",CR |
|||
X |
VAR |
Word |
' Set log time = start time |
LTime = STime |
|
||
DEBUG "Point,Time,Temperature",CR |
' message header |
||
Page 210 •Industrial Control Version 1.1

|
|
Experiment #7: Real-time Control and Data Logging |
|
|
|
|
|
|
FOR x |
= 4 to MemAddr-1 |
' Loop through memory locations |
READ x,DataIn |
' Read data stored in memory |
|
GOSUB Calc_Temp |
' Calculate temp based on data |
|
LMinutes = LMinutes + Interval |
' Add interval to get stored time |
|
GOSUB AdjustTime |
' Decimal adjust time |
|
|
|
' Display message data |
DEBUG DEC X-4,",",HEX2 LHours,":",HEX2 LMinutes,",",DEC Temp,CR |
||
DEBUG DEC Temp,CR |
' Plot temperature |
|
HIGH LED |
' Pause 0.1 second for spacing between data |
|
PAUSE 100 |
||
LOW |
LED |
|
NEXT |
|
|
DEBUG |
"!PLOT OFF",CR |
' Disable plotting |
LTime |
= Time |
' Set Log time to current time |
LMinutes = LMinutes + Interval |
' Add interval to set for next data logging |
|
GOSUB |
AdjustTime |
' After dump, hold button to reset logging |
|
|
|
HIGH 8 |
|
' Or logging will continue from current point |
|
' LED ON |
|
DEBUG |
"Hold button now to reset log",CR |
|
PAUSE |
2000 |
' If button not pressed, skip restart |
IF PB |
= 1 THEN SkipReset |
|
GOSUB |
RecoveryData |
' Restart - save new recovery data |
DEBUG |
"Release button now",CR |
|
SkipReset: |
|
' LED Off |
LOW 8 |
= 0 THEN SkipReset |
|
If PB |
' Wait for button release |
|
Return
We'll discuss operation and major blocks in our code. At the top of the code is the initialization information:
'*** Set Init. |
Time and Logging Interval ************** |
|
||||
Time |
= |
$2246 |
|
' Initialization Time |
|
|
Interval |
CON |
$05 |
' Do not |
use digits > |
6 |
|
' Sample |
interval (in |
BCD minutes) for logging |
||||
Samples |
|
CON |
500 |
' Number |
of samples to acquire |
|
Stop_Reset |
CON |
0 |
' When full, 0=reset, |
1 = stop logging |
||
'******************************************************
This data defines the time to set the RTC, how long the interval between logging should be, and how many samples should be logged. Stop_Reset is defines whether to stop logging (1) or reset (0) and start over destroying the old data when the maximum samples are collected.
The pushbutton has several purposes:
Industrial Control Version 1.1 •Page 211

Experiment #7: Real-time Control and Data Logging
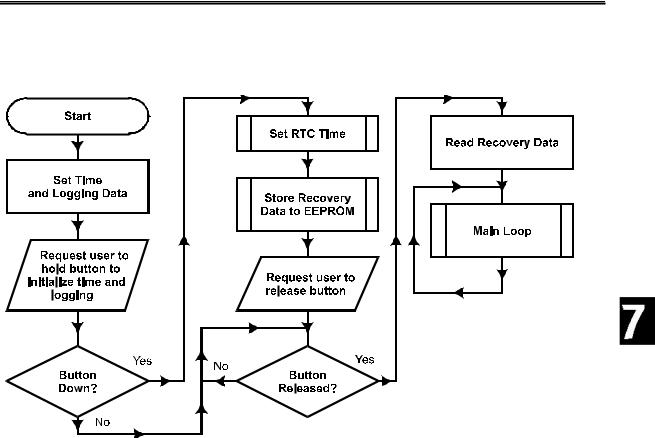
1.On-Power up or Reset of the BS2, a message will appear informing you to hold down the pushbutton to initialize the clock and logging (the LED will light for this also). If the button is held down, the value of time in the initialization section will be used to set the RTC and logging will be reset to the start. Recovery data will be written to EEPROM for the next reset.
RecoveryData: |
' Stores data for recovery from restart |
MemAddr = 4 |
' Set starting location |
WRITE 0,MemAddr.HIGHBYTE |
' Write to EEPROM |
WRITE 1,MemAddr.LOWBYTE |
' Save start time in EEPROM |
WRITE 2,Hours |
|
WRITE 3,Minutes |
|
Return |
|
Note that a memory address is |
a word-sized value and must be saved as high and |
low byte. |
|
2.During logging, if the pushbutton is pressed, the data will be ‘dumped’ or downloaded. We will be using StampPlot Lite to capture and plot the data as it is dumped. The data is NOT destroyed and the logger will continue to log new data.
3.At the end of a data dump, if the pushbutton is held down, the data logger will reset the log to the start destroying old data and resetting the start time of logging.
If the BASIC Stamp 2 is reset and the button is NOT held down, the program will read recovery data of current memory location and start time from the EEPROM. The RTC time will NOT be reset. It should be maintaining proper time through the reset UNLESS power was lost. Figure 7.7 is the flowchart of the initialization of the program.
Page 212 •Industrial Control Version 1.1
Experiment #7: Real-time Control and Data Logging
Figure 7.7: Logging Initialization Routine
Industrial Control Version 1.1 •Page 213
Experiment #7: Real-time Control and Data Logging
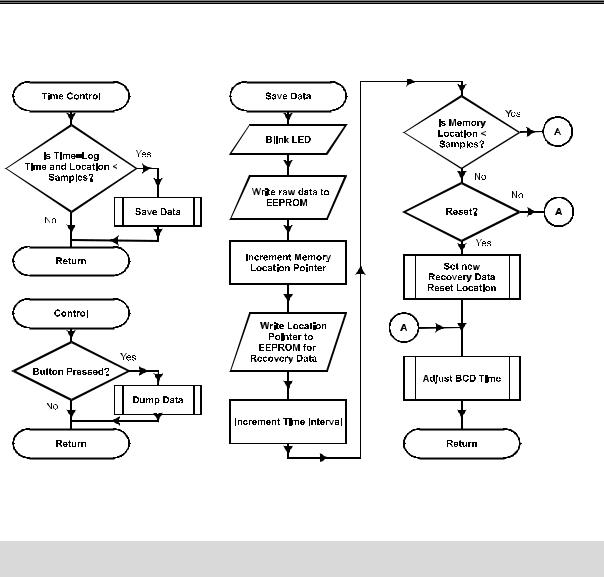
Figure 7.8: Control and Saving Routines
Time Control routine (Figure 7.8) is used to determine if it is time to save new data to memory. This is contingent on the memory location for samples being less than the number of samples specified.
TimeControl: ' Check if time for reading IF (Time = LTime) AND (MemAddr-4 < Samples) THEN SaveData
RETURN
The Save Data routine is called from Time Control when it is time to write a new sample to memory. The current DataIn (value read from the ADC) is stored in the current memory address, and the memory address is incremented for the next cycle. The next interval time is calculated (and later BCD adjusted). If the
Page 214 •Industrial Control Version 1.1

Experiment #7: Real-time Control and Data Logging
maximum number of samples is reached, depending on the Stop_Reset value, data logging will either ceased (see Time Control) or logging will start over.
Note that the raw DataIn value from the ADC is stored and not the temperature-calculated value. This allows the data to be stored in one byte instead of two as a word. The stored value will be converted into temperature when it is ‘dumped’ to the PC.
SaveData: |
' Write ADC reading to memory |
WRITE MemAddr, DataIn |
' Store data into EEPROM |
HIGH 8:PAUSE 250:LOW 8 |
' Blink LED |
MemAddr = MemAddr + 1 |
' Increment memory location for reading |
WRITE 0,MemAddr.HIGHBYTE |
' Update recovery data |
WRITE 1,MemAddr.LOWBYTE |
|
LMinutes = LMinutes + Interval |
' Update for next interval |
IF MemAddr-4 < Samples THEN AdjustTime |
' If samples not full, continue |
IF Stop_Reset = 1 THEN Dont_Reset |
' If samples full, restart or end logging |
GOSUB RecoveryData |
|
Dont_Reset: |
|
AdjustTime: |
|
Figure 7.9 illustrates the flow of the DumpData routine. When the pushbutton is pressed, Dump Data configures StampPlot for plotting, and creates a loop reading through the logged values, converting them to temperatures, and sending the values for plotting and the message window. Note that the log time is set to the start time, and the timing interval is added to the log time each loop iteration to determine the original time the data was logged.
Once the loop is complete, the log time is set back to the current time and the user is requested to hold down the pushbutton to reset the logging to start (the LED will light for indication also).
Industrial Control Version 1.1 •Page 215

Experiment #7: Real-time Control and Data Logging
Figure 7.9: Data Dump Routine Flowchart
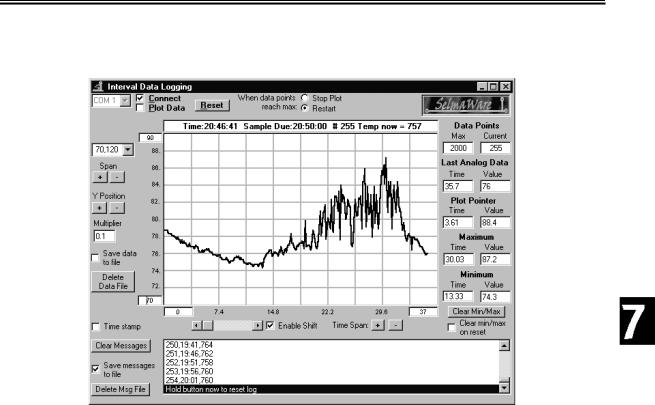
Once DumpData is complete, the control time will be updated to the time of the next sample, and logging will continue from the point it left off, allowing downloading without affecting the stored data. Figure 7.10a is a screenshot of our collected data dumped to StampPlot Lite.
Page 216 •Industrial Control Version 1.1
Experiment #7: Real-time Control and Data Logging
Figure 7.10a: Sample Data Dump of Logged Data
The format of the message data is suitable for importing into a spreadsheet for graphing, as seen in Figure 7.10b. A portion of the saved message file is as follows:
Point,Time,Temperature
0,22:51,787
1,22:56,787
2,23:01,787
3,23:06,787
4,23:11,783
5,23:16,783
Industrial Control Version 1.1 •Page 217
Experiment #7: Real-time Control and Data Logging
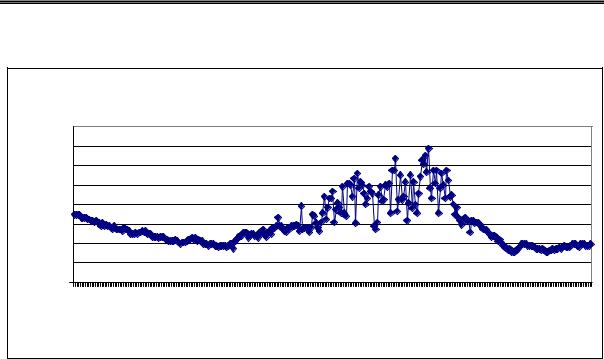
Figure 7.10b: Imported Message Data to Excel
|
|
|
|
|
|
|
Logged Temperature Data |
|
|
|
|
|
|
|
|
||||||||
|
900 |
|
|
|
|
|
|
|
|
|
|
|
|
|
|
|
|
|
|
|
|
|
|
(tenths) |
875 |
|
|
|
|
|
|
|
|
|
|
|
|
|
|
|
|
|
|
|
|
|
|
850 |
|
|
|
|
|
|
|
|
|
|
|
|
|
|
|
|
|
|
|
|
|
|
|
825 |
|
|
|
|
|
|
|
|
|
|
|
|
|
|
|
|
|
|
|
|
|
|
|
Temperature |
|
|
|
|
|
|
|
|
|
|
|
|
|
|
|
|
|
|
|
|
|
|
|
800 |
|
|
|
|
|
|
|
|
|
|
|
|
|
|
|
|
|
|
|
|
|
|
|
775 |
|
|
|
|
|
|
|
|
|
|
|
|
|
|
|
|
|
|
|
|
|
|
|
750 |
|
|
|
|
|
|
|
|
|
|
|
|
|
|
|
|
|
|
|
|
|
|
|
725 |
|
|
|
|
|
|
|
|
|
|
|
|
|
|
|
|
|
|
|
|
|
|
|
|
|
|
|
|
|
|
|
|
|
|
|
|
|
|
|
|
|
|
|
|
|
|
|
|
700 |
|
|
|
|
|
|
|
|
|
|
|
|
|
|
|
|
|
|
|
|
|
|
|
22:51 |
00:01 |
01:11 |
02:21 |
03:31 |
04:41 |
05:51 |
07:01 |
08:11 |
09:21 |
10:31 |
11:41 |
12:51 |
14:01 |
15:11 |
16:21 |
17:31 |
18:41 |
19:51 |
21:01 |
22:11 |
23:21 |
00:31 |
|
|
|
|
|
|
|
|
|
|
|
|
Time |
|
|
|
|
|
|
|
|
|
|
|
We set the incubator outside of a window and recorded outdoor temperatures.. Outdoor temperature can be tricky due to effects of wind cooling, sunlight heating, and thermal layers in the canister trapping heat. We had quite a few spikes in readings. Can you do better?
Our plot shows temperatures from 22:51 to 22:51 the next night. Note the rise and falls in temperature during the day. The expected high for the day was 88F, and we came pretty close!
Of course, we are not restricted s temperature range 70F-120F. Refer back to Experiment #4. Software range values are determined by the span and offset voltage settings to the ADC0831.
TempSpan |
CON |
5000 |
' |
Full Scale input span |
(5000 = 50 degrees |
span) |
Offset |
CON |
700 |
' |
Minimum temp. Offset. |
(700 = 70 degrees) |
|
Page 218 •Industrial Control Version 1.1