

Industrial Control (Students guide, 1999, v1.1 )
.pdfExperiment #7: Real-time Control and Data Logging
Questions and Challenges:
1.Perform Logging of a System: Determine a temperature that you want to log over a long period of time. This may be outdoors, the room temperature (does the heating/cooling change during evening hours?), or maybe some other slow changing system (a water tank in the sun?).
1)Determine the range of expected values for temperature. Set the span and offset variables and potentiometers appropriately.
2)Determine the length of time you need to collect the data (one day? the weekend?). Based on a maximum of 50 samples, calculate the interval time needed for logging.
3)Ready to program? If you are going to move your BOE, make sure it is running on a battery that will last throughout the logging!
4)We also want to check the accuracy of the RTC in this experiment, so when the program is ready to download:
a)Open the Windows clock and pick an upcoming time.
b)Set the start time to this upcoming time (remember to use 24-hour time) Time = $1530
c)5 seconds before the initializing time, download the file to the BS2 and hold the circuit pushbutton down until the LED goes off or debug window instructs you to release it.
d)Use the Debug Window or StampPlot to note the BS2 and the PC Times.
BS2: _________ PC: __________ Difference: ________
e)Let your data record! After the 1st sample is done, you may test the data dump by pressing the push-button.
f)After you are finished recording data, run and connect StampPlot Lite, press the push-button to dump the data.
g)Use the Debug Window or StampPlot to note the BS2 and the PC Time.
BS2:_________ PC: __________ Difference: ________
h) Extrapolate the time-error for 24 hours: _________
Did the data conform to your expectations?
Industrial Control Version 1.1 •Page 219

Experiment #7: Real-time Control and Data Logging
2.Discuss the 'system' you monitored and conclusions of your results.
3.How much time error was calculated over a 24-hour period? How could this error be compensated for in software?
4.Why is it important to limit the amount of data that can be stored in the BS2?
Page 220 •Industrial Control Version 1.1

Appendix A: StampPlot Lite
Appendix A:
StampPlot Lite
StampPlot Lite is an application developed by SelmaWare Solutions for the Industrial Control series. The application allows plotting and capture of analog, digital and general data.
Downloading and Installing StampPlot Lite
StampPlot Lite may be downloaded from the Stamps in Class web site at http://www.stampsinclass.com. The program is installed by double-clicking on the setup.exe icon and accepting the default directories.
To download StampPlot Lite, click on the “Downloads” button on our web site and scroll down to the “Industrial Control” section.
Industrial Control Version 1.1 •Page 221

Appendix A: StampPlot Lite
Data from the BASIC Stamp is processed in one of four ways by the application: Analog Values
Any string sent beginning with a numeric value will be processed as an analog value and graphed.
Debug DEC 100, 13 |
'Plot the number 100 |
Digital Values
Any string sent beginning with '%' will be processed as digital values. A separate digital plot will be started for each binary value in the string. For example, "%1001" will plot four digital values. Up to a 9-bit value may be sent. Once digital plots are started, caution should be used to always send the same number of bits since the plots are position-order dependent.
Debug IBIN4 INC,13 |
'Plots 4 digital values |
Control Settings
Any string beginning with '!' will be processed as a control setting. The various settings of the application may be controlled from the BASIC Stamp using specified control words and values, if required.
Debug |
"!AMAX 200",13 |
'Sets analog maximum for plot to 200 |
Debug |
"!RSET",13 |
'Resets the plot |
Other Strings
All other strings simply will be added to the running message list box.
Debug "Hello world!",13
Note that each instance of data MUST end with a carriage return (13 or CR).
Page 222 •Industrial Control Version 1.1

Appendix A: StampPlot Lite
The steps for using BASIC Stamp programs with StampPlot Lite are as follows:
1.Start StampPlot Lite through your Start/Programs/StampPlot/StampPlot Lite icon.
2.Enter and run your BASIC Stamp program from the BASIC Stamp editor.
3.Close the blue BASIC Stamp debug window by clicking on the “close” box.
4.Select the COM port and click 'Connect' checkbox.
5.Click the 'Plot Data' checkbox.
6.Some programs may require you to reset the Board of Education (BASIC Stamp) to catch initial configuration and control settings. Do this by pressing the Reset button on the board.
7.Prior to downloading (running) another program to the BASIC Stamp, be sure to uncheck the StampPlot 'Connect' checkbox or your COM port will be locked by StampPlot Lite.
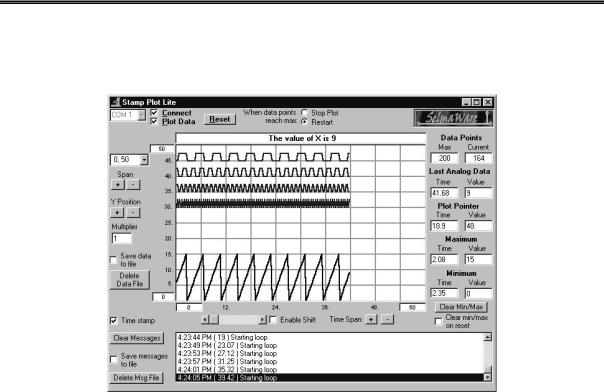
The plot will acquire analog and digital data and store it temporarily so that it may be resized or shifted on the screen. The number of data points collected is adjustable. Once the data points reach maximum, the plot must either be stopped or reset.
The following program will perform some configuration settings, continually plot and display the value of X on StampPlot, and plot the four digital bits of the value of X. Enter the program and use the steps above to test it with StampPlot Lite.
'Appendix A Program, StampPlot Example
'Configure StampPlot |
' Variable for counting |
||
Pause |
500: Debug "!RSET",CR |
' Short pause and reset |
|
Debug |
"!SPAN |
0, 50",CR |
' Span the analog range |
Debug |
"!TSMP |
ON",CR |
' Time Stamp the messages |
Debug |
"!TMAX |
60",CR |
' Set plot to 60 seconds max |
Debug |
"!RSET",CR |
' Reset the plot |
|
X var |
Byte |
|
|
Loop: |
"Starting loop", CR |
' Message that loop is resetting. |
|
Debug |
|||
For X |
= 0 to |
15 |
' For-Next loop to count to 15 |
Debug |
DEC X, |
CR |
' Plot Analog value of X |
Debug |
IBIN4 X, CR |
' Plot digital bits of X |
|
Debug |
"!USRS |
|
' Change the User Status message. |
The value of X is ", DEC X, CR |
|||
Pause |
200 |
|
' Short pause |
Next |
|
|
' Restart |
Goto Loop |
|
||
Industrial Control Version 1.1 •Page 223
Appendix A: StampPlot Lite
Below is a screen shot of StampPlot Lite showing the above program plotted.
Page 224 •Industrial Control Version 1.1
Appendix A: StampPlot Lite
Tool Text Help
If a copy of StampPlot Lite is running on your computer, you may place the cursor over each control for 'Tool Text Help.’ The following is a brief summary of each control. The BASIC Stamp programmable command, where applicable, is in brackets:
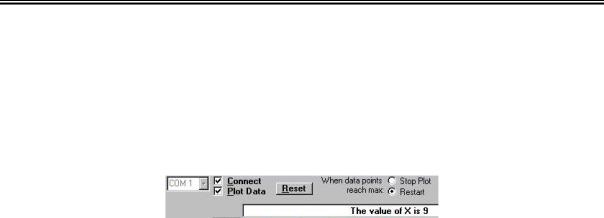
Top Section: General Controls
•Com 1: Drop down to select the applicable COM port.
•Connect: Connects the application to the selected COM port.
•Plot Data: Allows plotting of incoming data. Deselecting this control will stop the plotting of data but will allow messages and other actions to continue. [ !PLOT ON/OFF]
•Reset: Clears the plot, resets to time 0, clears minimum and maximum value (optional). [ !RSET ]
•Stop Plot: When maximum data points are reached, the plot stops (Plot Data becomes unchecked). [!MAXS ]
•Reset Plot: When maximum data points are reached, the plot resets. [ !MAXR ]
•User Status: (showing "The value of X is 9") Optional status messages from the BASIC Stamp may place data here. [ !USRS message ]
Industrial Control Version 1.1 •Page 225
Appendix A: StampPlot Lite
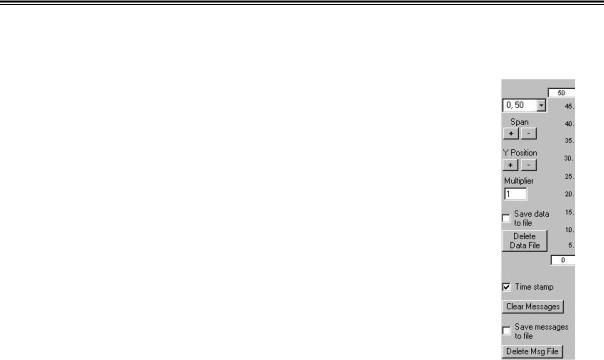
Left Section: Primarily for Setting the Analog Plot
•Span Drop-Down box: Allows a selection of pre-defined plot ranges. Use of the
BASIC Stamp command !SPAN will add a range to this drop-down. [ !SPAN minvalue, maxvalue ]
•+ and - buttons: Respectively double or halve the span. The minimum value does not change.
•Multiplier: Defines the amount incoming BASIC Stamp analog data will be multiplied by prior to plotting or saving to file. [ !AMUL value ]
•Save Data to File: Saves the incoming data to a text file in the application directory called "stampdat.txt.” If time stamping is enabled, each record will be marked with the current system time and the number of seconds since the last reset. The value of the data point for analog and digital values will also be recorded. Each record will have the following form:
-Time of day, seconds since reset, analog data point, analog value, digital data point, digital data value. Note that each record is comma delineated for importing into a spreadsheet, if desired.
-Note: Data is saved ONLY when ANALOG data arrives. To force saving when no analog data is recorded, debug a value such as zero ( DEBUG DEC 0, CR).[ !SAVD ON/OFF ]
•Delete Data File: Deletes "stampdat.txt.” If data saving is enabled, the file will be re-created after deleting it. [ !DELD ]
•Analog Minimum and Maximum values: These may be manually changed. Tab off, or click another
control, to set the new value. [ !AMIN value !AMAX value <or> !SPAN minvalue, maxvalue ]
•Time Stamp: Enables time stamping of messages and data to the file. It includes both the current time and seconds since the last reset. [ !TSMP ON/OFF ]
•Clear Messages: Clears the messages in the listbox. [ !CLRM ]
•Save messages to file: Saves messages to the file "stampmsg.txt" in the application directory. Messages will be saved the same way they appear in the message box. [ !SAVM ON/OFF ]
•Delete Msg file: Deletes "stampmsg.txt" in the application directory. If the "Save Messages…" is enabled, the file will be re-created. [ !DELM ]
Page 226 •Industrial Control Version 1.1
Appendix A: StampPlot Lite
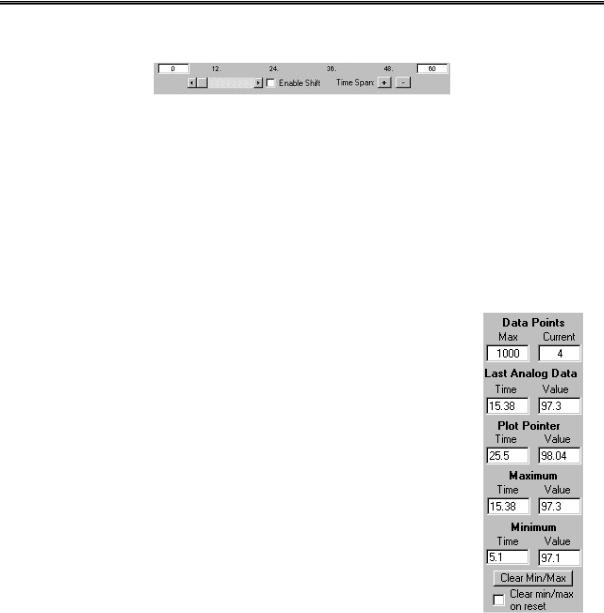
Bottom Section: Plot Shift and Time Span
•The minimum and maximum times of the plot may be set manually. Tab-off or click another control to apply the value. [ !TMIN value and !TMAX value ]
•Scroll Bar: If the plot extends beyond the current limits, the scroll bar may be used to reposition the plot (if collecting data, Enable Shift must be on).
•Enable Shift: Allows the plot to shift automatically when maximum plotted time is exceeded. Also enables operation of the scroll bar when collecting data. Note: Shifting of the plot during data collection may cause time errors in the data as the plot refreshes. [ !SHFT ON/OFF ]
•+/-: Respectively doubles or halves the time span of the plot. The minimum value of the plot will not change.
Right Section: Plot Data
•Data Points: To allow the plot to be manipulated, data is stored in memory. The maximum number of points (either analog or digital) that may be recorded is the Max. ‘Current’ displays the current data point being stored. Once the maximum is reached, the plot will either reset or stop, depending on the configuration. [ !PNTS 1000 ]
•Last Analog Data: Displays the time since reset and the last analog value plotted.
•Plot Pointer: Moving the plot pointer on the display shows the current analog value and time for that point on the plot.
•Maximum: Records the maximum analog value and the time it was reached.
•Minimum: Records the minimum analog value and the time it was reached.
•Clear Min/Max: Clears the recorded minimum and maximum values. [ !CLMM
]
•Clear min/max on reset: Allows a reset to clear the minimum and maximum values. [!CMMR]
Industrial Control Version 1.1 •Page 227

Appendix A: StampPlot Lite
Page 228 •Industrial Control Version 1.1