

Industrial Control (Students guide, 1999, v1.1 )
.pdfExperiment #6: Proportional – Integral – Derivative Control
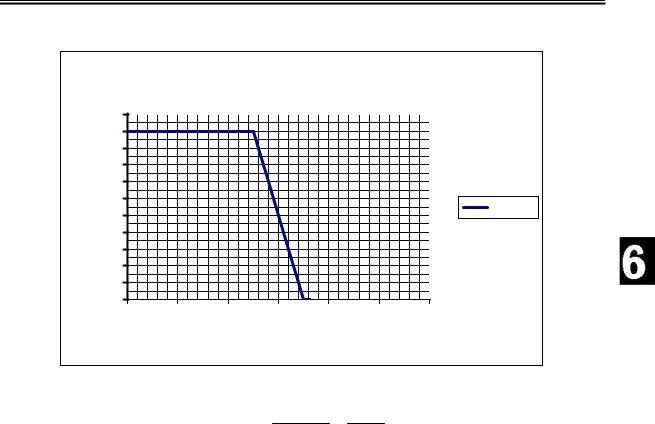
From Figure 6.5, if the temperature is at 101.5F, 50% drive will be used to add heat energy to our system. If the temperature drops to 101 F, 100% drive will be used to increase the temperature, and any temperature in between will result in a proportional amount of drive.
If the temperature rises above 101.5F, the drive will proportionally decrease to lower the temperature until, at 102F, %drive has decreased to 0%.
From the graph, what would the drive be at 101.2 degrees? ______; at 101.7 degrees? _______.
Now let’s look at it mathematically. The error of our system is calculated by subtracting the current temperature from the setpoint:
Error = Setpoint-Actual
The percent error is found by dividing the error value by the full temperature range and multiplying by 100%:
%Error = |
Error |
x100% |
|
FullRange |
|||
|
|
For our incubator the full temperature range is:
102.0-101.0 = 1.0F.
If the temperature is 101.2:
Error = 101.5 – 101.2 = .3 %Error (E) = .3/1.0*100% = 30%
The general gain formula is:
Gain = ∆∆OutputInput
For our example, we are changing 100% of the drive over 100% of the allowable temperature range:
Gain(Kp) = ∆∆OutputInput = 100100%% =1
Our system would have a proportional gain (Kp) of 1.
Industrial Control Version 1.1 •Page 159

Experiment #6: Proportional – Integral – Derivative Control
The amount of proportional drive at 101.2 degrees would be: %DrivePROP = Kp*E = 1 * 30% = 30%
The total drive of our system would then be:
%DriveTOTAL = B+(Kp*E)= 50%+30% = 80%.
Does this values match what you read from the Figure 6.3 for a temperature of 101.2F?
Calculate the total drive for a temperature of 101.7: __________
Compare your value to Figure 6.3. Do they match? ________.
One more term to consider is Proportional Band. Figure 6.3 is termed a 100% Proportional Band because the full range of drive covers 100% of our allowable band (101.0-102.0). Does this mean the temperature will not exceed our high and low limits? No. This simply means that at those limits our system will be taking full action to get the temperature back to the setpoint.
What if we wanted tighter temperature control of our system? Our allowable band for healthy eggs is still 101.0 to 102.0, but we can adjust our values to take full control over half the allowable range. Figure 6.6 is a plot of this control.
Page 160 •Industrial Control Version 1.1
Experiment #6: Proportional – Integral – Derivative Control
Figure 6.6: Temperature vs. Drive Over 50% of Range
|
|
|
Temperature vs. Drive |
|
|||
|
110 |
|
|
|
|
|
|
|
100 |
|
|
|
|
|
|
|
90 |
|
|
|
|
|
|
% |
80 |
|
|
|
|
|
|
70 |
|
|
|
|
|
|
|
Drive |
|
|
|
|
|
|
|
60 |
|
|
|
|
|
% Drive |
|
50 |
|
|
|
|
|
||
PWM |
|
|
|
|
|
|
|
40 |
|
|
|
|
|
|
|
30 |
|
|
|
|
|
|
|
|
|
|
|
|
|
|
|
|
20 |
|
|
|
|
|
|
|
10 |
|
|
|
|
|
|
|
0 |
|
|
|
|
|
|
|
100 |
100.5 |
101 |
101.5 |
102 |
102.5 |
103 |
|
|
|
Temperature |
|
|
||
In Figure 6.6 the system is driving twice as hard for any deviation from the setpoint. What would be the proportional gain for this system?
Gain(Kp) = ∆∆OutputInput = 10050%% = 2
Note from the equation the system is driving the full range of output over only 50% of the allowable temperature range. This is also known as a 50% Proportional Band because full control action happens over 50% of the allowable range.
Use the equations to calculate the following at 101.7F:
Error = __________
%Error = _________ (Hint: The allowable band is still 1.0) Proportional Drive = ________
Total Drive = _________.
Note the relationship between proportional gain and proportional band:
Industrial Control Version 1.1 •Page 161

Experiment #6: Proportional – Integral – Derivative Control
Proportional Band = |
1 |
*100% = |
1 |
*100% = 50% |
|
Proportaional Gain |
2 |
||||
|
|
|
What if we wanted a slower responding system? We can define that the full range of drive will be over temperatures greater than the allowable range. If 100% drive were to cover twice as much as the allowable range:
Gain(Kp) = ∆∆OutputInput = 100200%% = 0.5
Calculate the Proportional band: ________
Graph the Drive vs. Temperature for this gain:
Temperature vs. Drive
PWM Drive %
100 |
|
|
|
|
|
|
|
|
|
|
|
|
|
|
|
|
|
|
|
|
|
|
|
|
|
|
|
|
|
|
|
|
|
|
|
|
|
|
|
|
|
|
|
|
|
|
|
|
|
|
|
|
|
|
|
|
|
|
|
|
|
|
|
|
|
|
|
|
|
|
|
90 |
|
|
|
|
|
|
|
|
|
|
|
|
|
|
|
|
|
|
|
|
|
|
|
|
|
|
|
|
|
|
|
|
|
|
|
|
|
|
|
|
|
|
|
|
|
|
|
|
|
|
|
|
|
|
|
|
|
|
|
|
|
|
|
|
|
|
|
|
|
|
|
80 |
|
|
|
|
|
|
|
|
|
|
|
|
|
|
|
|
|
|
|
|
|
|
|
|
|
|
|
|
|
|
|
|
|
|
|
|
|
|
|
|
|
|
|
|
|
|
|
|
|
|
|
|
|
|
|
|
|
|
|
|
|
|
|
|
|
|
|
|
|
|
|
70 |
|
|
|
|
|
|
|
|
|
|
|
|
|
|
|
|
|
|
|
|
|
|
|
|
|
|
|
|
|
|
|
|
|
|
|
|
|
|
|
|
|
|
|
|
|
|
|
|
|
|
|
|
|
|
|
|
|
|
|
|
|
|
|
|
|
|
|
|
|
|
|
60 |
|
|
|
|
|
|
|
|
|
|
|
|
|
|
|
|
|
|
|
|
|
|
|
|
|
|
|
|
|
|
|
|
|
|
|
|
|
|
|
|
|
|
|
|
|
|
|
|
|
|
|
|
|
|
|
|
|
|
|
|
|
|
|
|
|
|
|
|
|
|
|
50 |
|
|
|
|
|
|
|
|
|
|
|
|
|
|
|
|
|
|
|
|
|
|
|
|
|
|
|
|
|
|
|
|
|
|
% Drive |
|
|
|
|
|
|
|
|
|
|
|
|
|
|
|
|
|
|
|
|
|
|
|
|
|
|
|
|
|
|
|
|
|
|
||
40 |
|
|
|
|
|
|
|
|
|
|
|
|
|
|
|
|
|
|
|
|
|
|
|
|
|
|
|
|
|
|
|
|
|
|
|
|
|
|
|
|
|
|
|
|
|
|
|
|
|
|
|
|
|
|
|
|
|
|
|
|
|
|
|
|
|
|
|
|
|
|
|
|
|
|
|
|
|
|
|
|
|
|
|
|
|
|
|
|
|
|
|
|
|
|
|
|
|
|
|
|
|
|
|
|
|
|
|
30 |
|
|
|
|
|
|
|
|
|
|
|
|
|
|
|
|
|
|
|
|
|
|
|
|
|
|
|
|
|
|
|
|
|
|
|
|
|
|
|
|
|
|
|
|
|
|
|
|
|
|
|
|
|
|
|
|
|
|
|
|
|
|
|
|
|
|
|
|
|
|
|
20 |
|
|
|
|
|
|
|
|
|
|
|
|
|
|
|
|
|
|
|
|
|
|
|
|
|
|
|
|
|
|
|
|
|
|
|
|
|
|
|
|
|
|
|
|
|
|
|
|
|
|
|
|
|
|
|
|
|
|
|
|
|
|
|
|
|
|
|
|
|
|
|
10 |
|
|
|
|
|
|
|
|
|
|
|
|
|
|
|
|
|
|
|
|
|
|
|
|
|
|
|
|
|
|
|
|
|
|
|
|
|
|
|
|
|
|
|
|
|
|
|
|
|
|
|
|
|
|
|
|
|
|
|
|
|
|
|
|
|
|
|
|
|
|
|
0 |
|
|
|
|
|
|
|
|
|
|
|
|
|
|
|
|
|
|
|
|
|
|
|
|
|
|
|
|
|
|
|
|
|
|
|
100 |
100.5 |
101 |
101.5 |
102 |
102.5 |
103 |
|
|
|
||||||||||||||||||||||||||
Temperature
Calculate the following for a temperature of 101.7F:
Error = |
_________ |
%Error = |
_________ (Hint: The allowable band is still 1.0) |
Proportional Drive = |
_________ |
Total Drive = |
_________. |
Page 162 •Industrial Control Version 1.1

Experiment #6: Proportional – Integral – Derivative Control
Controlling the Incubator:
Theory is nice, but now we need to deal with the temperature inside our actual canister using proportional control and some limitations we’ll need to work with.
1)The bias temperature at 50% bias drive will not be 101.5F. The 50% bias temperature for your incubator was found in Exercise #1 of this experiment. If need be, repeat that portion to find the current bias temperature. This should be done if you think conditions in or around the canister are different. For instance if the room temperature is now higher than it was before, your stable temperature at 50% bias will stabilize at a higher value.
2)The BASIC Stamp works in integer math. Our temperatures are in tenths of degree (101.5=1015), and we will want to work with gain settings that are less than 1.
3)The resolution of the A/D is 0.19 degrees, which would not provide very fine control with an allowable temperature band of 101.0 – 102.0. For these experiments we will increase the allowable band to +/- 1.0F or 100.5F – 102.5F for a range of 2.0F.
In performing these experiments, the general sequence will be to allow the incubator to stabilize at the bias temperature. Once stable, the PID program with the appropriate settings will be downloaded. After 1 minute the fan positioned approximately 1 inch from the canister will be energized manually by connecting the positive lead to the Vin supply for 10 seconds.
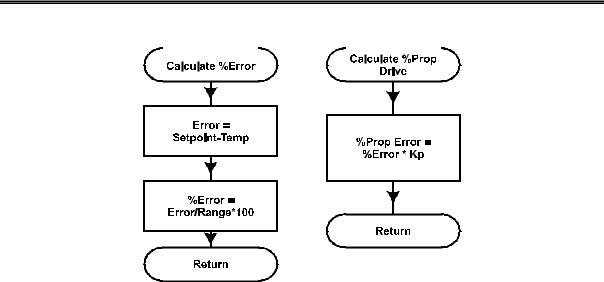
Figure 6.7 is the flowchart for the error calculations and proportional drive. Notice in the code for the proportional calculations the result is divided by 10 to scale our Kp value down from tenths.
Industrial Control Version 1.1 •Page 163
Experiment #6: Proportional – Integral – Derivative Control
Figure 6.7: Error and Proportional Calculations
'********** Calculate %Error - Sign adjusted |
|
|
ErrorCalc: |
(SP - Temp) |
'Calculate temperature error |
Err = |
||
Sign = Err |
|
|
GOSUB |
SetSign |
'Calculate % error |
Err = |
ABS Err*100/Range |
|
Err = |
Err * Sign |
|
Return |
|
|
'*********** Proportional Drive - Sign adjusted |
|
|
PropCalc: |
|
|
Sign = Err |
|
|
GOSUB |
SetSign |
'Prop err = %Err * Kp /10 to scale |
P = ABS Err * KP/10 |
||
P = P |
* Sign |
|
RETURN |
|
|
Page 164 •Industrial Control Version 1.1
Experiment #6: Proportional – Integral – Derivative Control
PID Control: 100% Proportional Band, Proportional Gain = 1
1)Find the 50% drive bias temperature if needed. Allow the temperature to stabilize at the bias temperature.
2)Set the PID Control settings program 6.1 accordingly, setting the value of SP to your bias temperature in tenths and the value of Kp to 10 for a gain of 1.
3)Disconnect on SPL, download the BS2 program, close the debug window, reconnect on SPL and reset your BS2.
4)Monitor temperature on SPL. When 1 minute (60 seconds) has passed, energize the fan for 10 seconds.
5)Monitor the incubator’s response to the disturbance.
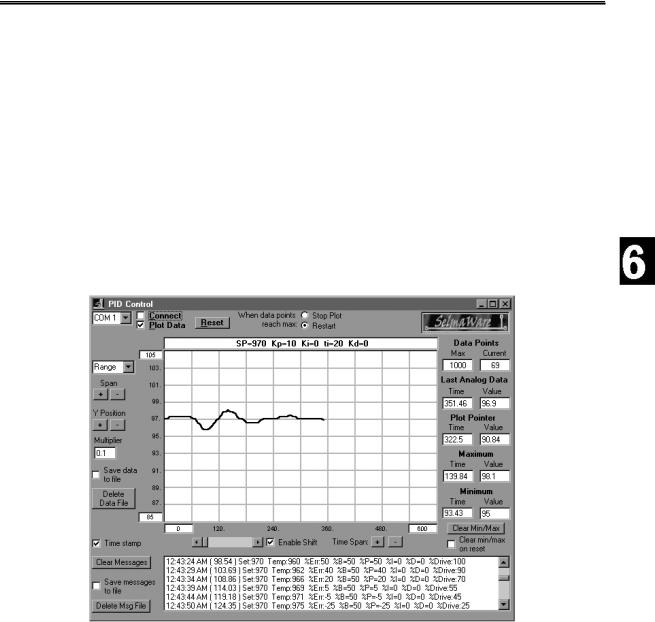
Figure 6.8a: Response with Kp = 1, 100% Band
Note how the temperature overshoots the setpoint then turns, goes down, overshoots, and goes up again. This is termed hunting. Drive is added and removed based on the response of the system to finally settle at
Industrial Control Version 1.1 •Page 165

Experiment #6: Proportional – Integral – Derivative Control
the setpoint value. Depending on the needs of your system, PID may be tuned to prevent hunting. The cruise control in our cars might make for an interesting drive if the speed hunting around the setpoint speed!
The user status box at the top of the plot shows the current settings for PID control. The message window displays the setpoint and current temperatures, %Error, and the amount of drive from each evaluation along with the total drive.
Let’s do the math to analyze some of these values. The setpoint is 970 or 97.0F, the bias temperature for our testing. At a temperature of 962 (96.2F) the total drive was 90% with 50% from the Bias drive and 40% from the proportional drive.
Error = Setpoint – Temperature = 97.0F-96.2F=0.8F %Error = Error/Range * 100 = 0.8F/2F * 100 = 40%
%DrivePROP = Kd*E = 1*40% = 40%
%DriveINT and DriveDERIV will be 0 since their gains are 0. %DriveTotal = %DriveBIAS + %DrivePROP + %DriveINT + %DriveDERIV =
= 50% + 40% + 0% + 0% = 90%
The calculations worked!
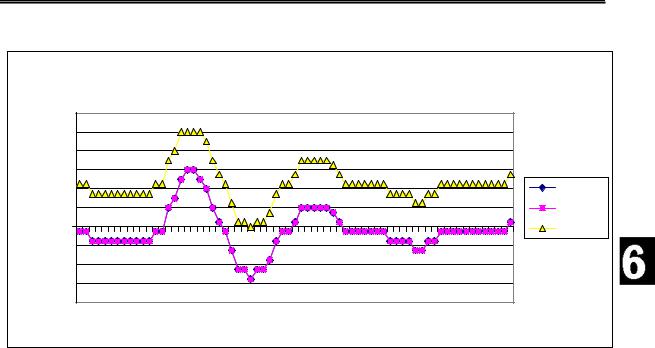
Using the alternative line for the message file logging in the Display routine, the data saved to the message file may be imported into a spreadsheet, such as Excel, for analysis. It is a simple coma-separated version of the message window data suitable for importation and graphing.
'** Comma-seperated message output for import into spreadsheet
'DEBUG ",",DEC Temp,",",SDEC Err,",",SDEC P,",",SDEC I,",",SDEC D,",",SDEC Drive,CR
Figure 6.8b is the message data imported into Excel will show the error, proportional drive and total drive.
Page 166 •Industrial Control Version 1.1
|
|
|
|
|
|
|
|
|
Experiment #6: Proportional – Integral – Derivative Control |
||||||||||
|
|
|
|
|
|
|
Figure 6.8b: Message file plotted in Excel |
|
|
|
|
||||||||
|
|
|
|
|
|
|
|
|
Drive with Kp=1 |
|
|
|
|
|
|
||||
|
120 |
|
|
|
|
|
|
|
|
|
|
|
|
|
|
|
|
|
|
|
100 |
|
|
|
|
|
|
|
|
|
|
|
|
|
|
|
|
|
|
|
80 |
|
|
|
|
|
|
|
|
|
|
|
|
|
|
|
|
|
|
|
60 |
|
|
|
|
|
|
|
|
|
|
|
|
|
|
|
|
|
%Err |
%Drive |
40 |
|
|
|
|
|
|
|
|
|
|
|
|
|
|
|
|
|
|
20 |
|
|
|
|
|
|
|
|
|
|
|
|
|
|
|
|
|
%P |
|
|
|
|
|
|
|
|
|
|
|
|
|
|
|
|
|
|
|
||
|
0 |
0.44 |
21.1 |
41.8 |
62.5 |
83.1 |
104 |
124 |
145 |
166 |
186 |
207 |
228 |
248 |
269 |
290 |
310 |
331 |
%Drive |
|
-20 |
352 |
|||||||||||||||||
|
|
|
|
|
|
|
|
|
|
|
|
|
|
|
|
|
|
|
|
|
-40 |
|
|
|
|
|
|
|
|
|
|
|
|
|
|
|
|
|
|
|
-60 |
|
|
|
|
|
|
|
|
|
|
|
|
|
|
|
|
|
|
|
-80 |
|
|
|
|
|
|
|
|
|
|
|
|
|
|
|
|
|
|
|
|
|
|
|
|
|
|
|
|
Seconds |
|
|
|
|
|
|
|
|
|
Note that with a proportional gain of 1, the %Error line is barely seen because the %P (Proportional Error) exactly overlaps it. %DrivePROP = %Error. The amount of proportional error is added to the bias drive of 50% and follows the error.
PID Control: 50% Proportional Band, Proportional Gain = 2
Repeat the experiment for a proportional band of 50% at a gain setting of 2. Change Kp = 20 in the control settings and run the program.
Industrial Control Version 1.1 •Page 167
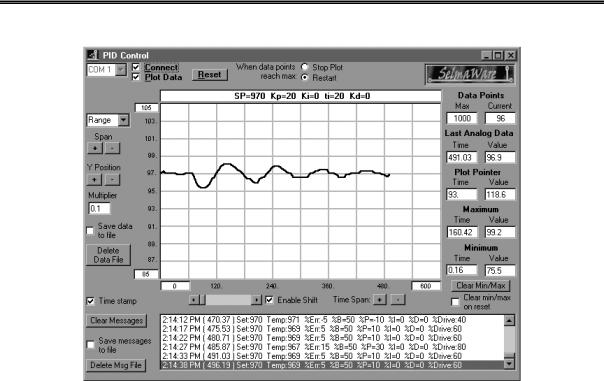
Experiment #6: Proportional – Integral – Derivative Control
Figure 6.9a: Response with Gain = 2, 50% Band
With a gain of 2, note that the response time is slightly faster though there is greater hunting.
Page 168 •Industrial Control Version 1.1