

Industrial Control (Students guide, 1999, v1.1 )
.pdfExperiment #1: Flowcharting and StampPlot Lite
Figure 1.1: Shower Temperature Example
Yes
No
Yes
No
Industrial Control Version 1.1 •Page 9
Experiment #1: Flowcharting and StampPlot Lite
Example #2: Conveyor Counting Example
Let's look at a real scenario and develop a flowchart for it. In a manufacturing plant, items are boxed and sent down a conveyor belt to one of two loading bays with trucks waiting. Each truck can hold 100 boxes. As the boxes arrive, workers place them on the first truck. After that truck is full, the boxes must be diverted to the second truck so the loaded truck can be moved out and an empty one moved into position. Also, in the event of an emergency or problem, there must be a means of stopping the conveyor.
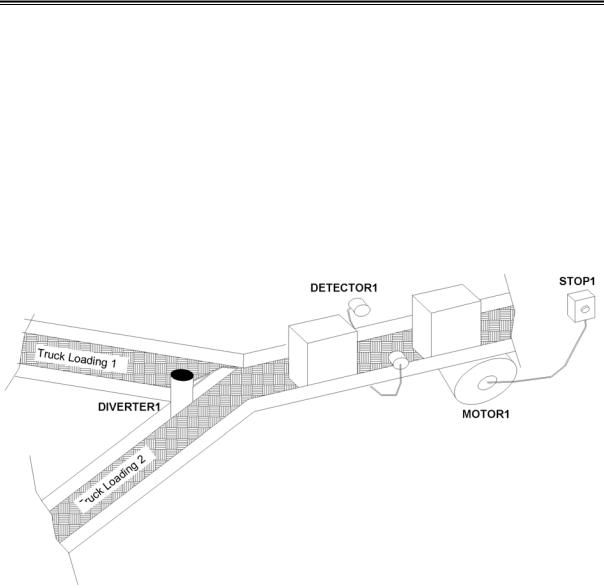
The physical aspects of the scenario are illustrated in Figure 1.2. The motor for the belt is labeled MOTOR1. The sensor to detect the boxes as they pass is labeled DETECTOR1. The lever to direct boxes to one truck conveyor or the other is labeled DIVERTER1. The emergency stop button is labeled STOP1.
Figure 1.2: Conveyor Counting Example
Page 10 •Industrial Control Version 1.1
Experiment #1: Flowcharting and StampPlot Lite
Let's list in order a brief description of what must occur:
•Start the conveyor motor.
•Count the boxes as they pass.
•When 100 boxes have passed, switch the diverter to the opposite position.
•Whenever the emergency stop is pressed, stop the conveyor.
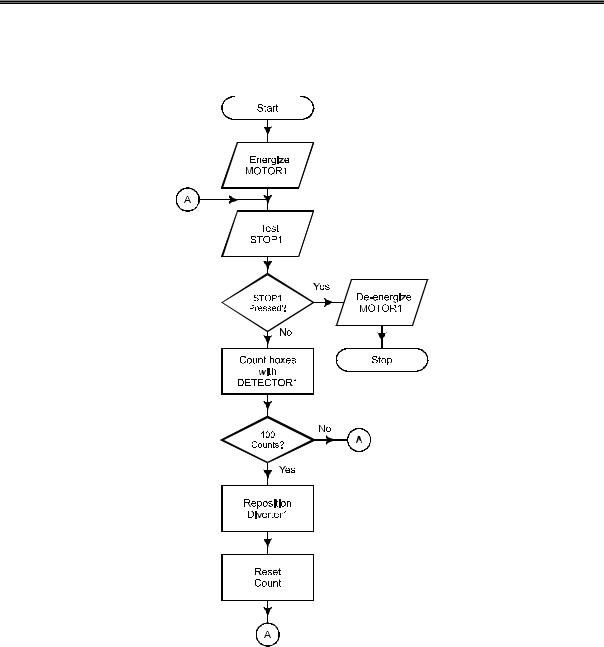
Now that we know the basic steps involved, let's develop a flowchart for the process. Let's begin by looking at the simple process flow in Figure 1.3 on the following page.
Notice the placement of the Input/Output box for checking the emergency stop button, STOP1. It ensures the button is tested during every cycle. What if we had placed it following the 100-count decision box? How long would it have taken from when the button was pushed until the conveyor stopped?
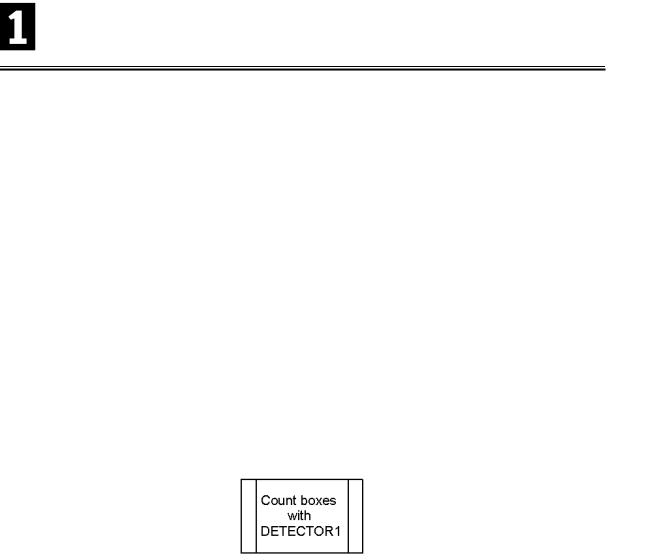
Does the flowchart describe everything our program needs to do? Definitely not, but it is a good start at determining the overall flow of the process. Look at the "Count Boxes with DETECTOR1" Process box. How exactly is this carried out? We may need to develop a flowchart to describe just this routine. If a process needs further detailing, we might replace the Process box with a Sub-Process box as shown in Figure 1.4.
Figure 1.4: Sub-Process Box
How involved is it to simply count a box passing by a detector? If DETECTOR1 is activated by “going low,” do we count? When the detector stays low, how do we keep from recounting it again the next time our program passes that point? What if the box bounces on the conveyor as it enters our beam? How do we keep from performing multiple counts of the box? These answers may not be as simple as they seem. Even when performing a task as simple as counting a passing box, many variables must be taken into account.
Industrial Control Version 1.1 •Page 11
Experiment #1: Flowcharting and StampPlot Lite
Figure 1.3: Conveyor Counting Flowchart
Page 12 •Industrial Control Version 1.1

Experiment #1: Flowcharting and StampPlot Lite
Another consideration is the output of our detector. Can we directly measure the output using one of the BASIC Stamp inputs, or is there some circuitry needed to condition the signal first?
Let's consider an output in our conveyor counting example. How do we energize the motor? It is doubtful the 5-volt, milliamp-rated output of the BASIC Stamp will be able to drive a motor of sufficient horsepower to move a conveyor! How do we condition an output of the BASIC Stamp to control a higher voltage and current load?
These issues will be considered as you work through the chapters in this text. What may seem simple for us to do as humans may require some sophisticated algorithms for a microcontroller to mimic. We will use readily available electronic components, a BASIC Stamp module, and the Board of Education to simulate some complex industrial control processes.
Industrial Control Version 1.1 •Page 13
Experiment #1: Flowcharting and StampPlot Lite
Exercises
Exercise #1: Flowchart Design
Develop a flowchart that will energize a heater below 100 degrees and de-energize it above 120 degrees.
Exercise #2: LED Blinking Circuit
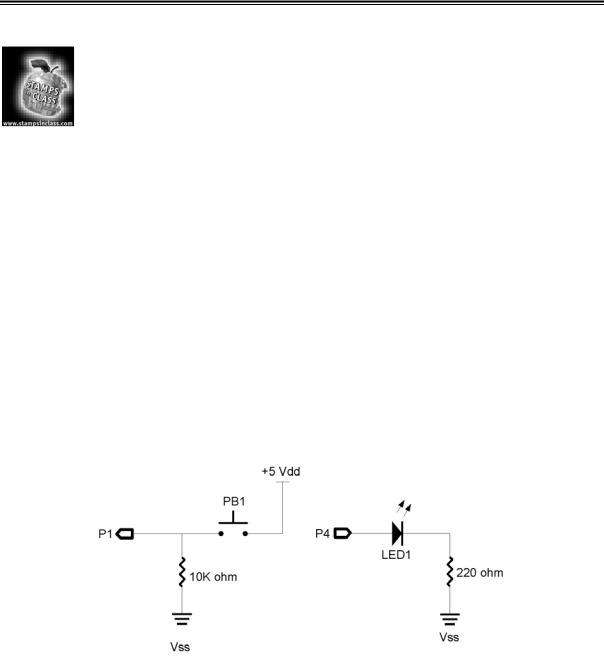
We’ll use a simple circuit to demonstrate a flowchart process and the program to perform the task. You’ll need to build the circuit shown in Figure 1.5. The following parts will be required for this experiment:
(1)LED, green
(2)220-ohm resistors
(1)10K-ohm resistor
(1)Pushbutton
(1)10K-ohm multi-turn potentiometer
(1)1 uF capacitor (Miscellaneous) jumper wires
Figure 1.5: Exercise #2 Blinking Circuit Schematic
Page 14 •Industrial Control Version 1.1
Experiment #1: Flowcharting and StampPlot Lite
The circuit you are building consists of a single
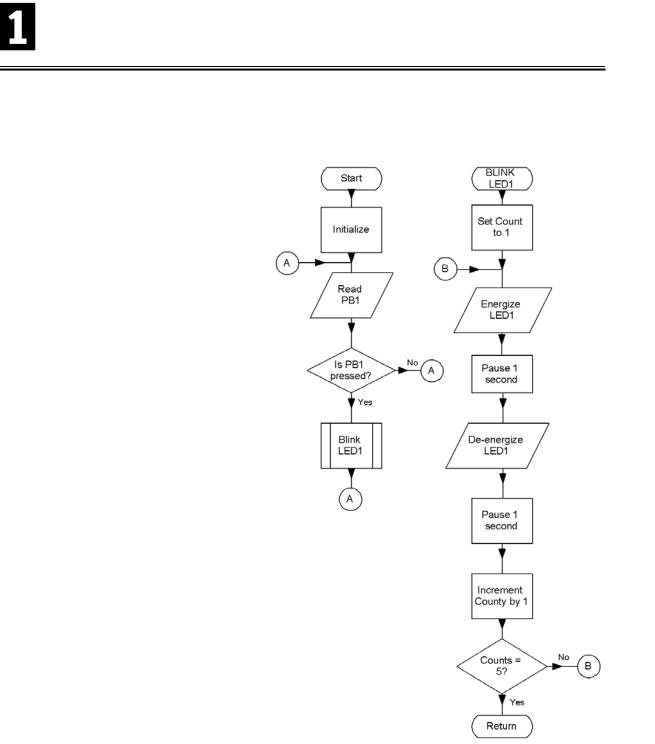
input button and a single output LED. Here is Figure 1.6: Exercise #2 Blinking Circuit Flowchart the process we want to perform: when the
button (PB1) is pressed, blink the green LED (LED1) five times over 10 seconds. The flowchart for our process is shown in Figure 1.6.
Notice a few things about the flowchart. Our main loop is fairly simple. In the Initialize process box, we will define any variables needed and set initial outputs (LED off) and will loop unless PB1 is pressed, which calls our subroutine, blink_led1. Our subroutine doesn't begin with "Start,” but the name of the process, so that we can identify it. The flowchart describes a process that we will repeat five times, alternately energizing and de-energizing our LED for one second each time.
Now that we have a flowchart to describe the process, how do we program it in PBASIC? Programmatically, we can sense PB1 using the IN statement. We have two ways we can call our subroutine. If the condition is true (1), then we can branch to our subroutine directly using an IF-THEN statement. This would be treated as a PBASIC GOTO. Once this completes, we would need to GOTO back to our main loop. Or, if the condition is false (0), we can branch back to our main loop from the IF-THEN, and use a GOSUB command to branch to our subroutine when true. We can then use a RETURN when our subroutine is complete.
Industrial Control Version 1.1 •Page 15

Experiment #1: Flowcharting and StampPlot Lite
In our blink_led1 subroutine, we need a loop to repeat five times. Choices for accomplishing this task may be to set up a variable we increment and check during each repetition, or use the FOR-NEXT statement to accomplish it for us.
The flowchart describes the general steps involved in accomplishing a process. The code required is flexible as long as it faithfully completes the process as described. The same flowchart may be used in multiple languages or systems and even for humans!
Program 1.1 is one way to write the code for our blinking LED process. Enter the text in the BASIC Stamp editor, download it to the BASIC Stamp, and press the pushbutton of the circuit you built. If it works properly, the LED will blink five times after the pushbutton is pressed.
'Program 1.1; Blinking LED Example
Cnt |
VAR |
BYTE |
PB1 |
VAR |
IN1 |
LED1 |
CON |
4 |
INPUT 1
OUTPUT 4
LOW LED1
Start:
IF PB1 = 0 then Start
GOSUB Blink_LED1
GOTO Start
Blink_LED1:
For Cnt = 1 to 5
HIGH LED1
PAUSE 1000
LOW LED1
PAUSE 1000
NEXT
RETURN
'Variable for counting 'Variable for PB1 input 'Variable for LED1 output
'Set PB1 as input 'Set LED1 as output
'Turn off LED
'Not Pressed? Go back to loop
'If it was pressed then perform subroutine 'After return, go back to start
'Subroutine to blink LED 5 repetitions 'Setup loop for 5 counts
'Turn ON LED 'Wait 1 second 'Turn off LED 'wait 1 second
'Repeat loop until done
'return back to after gosub call
Programming Challenge
Flowchart and program a process where the LED will blink four times a second while the pushbutton is NOT pressed!
Page 16 •Industrial Control Version 1.1
Experiment #1: Flowcharting and StampPlot Lite
Exercise #3: Analog Data
In many instances a process involves analyzing and responding to analog data. Digital data is simply on or off (1 or 0). This is comparable to the simple light switches in our homes. The light is on or it is off. Analog data on the other hand is a range of values. Some examples include the level of lighting if we use a dimmer switch instead of an on/off switch, or the temperature of the water coming out of our shower nozzle.
There are several methods to bring analog data into a microcontroller, such as using an analog-to-digital (A/D) converter that changes analog values into digital values that may be processed by the microcontroller. Another method used by the BASIC Stamp is a resistor/capacitor network to measure the discharge or charge time of the capacitor. By varying the amount of the resistance, we can affect and measure the time it takes the capacitor to discharge. In this experiment, resistance is set by manually adjusting a variable resistor. But the device may be more sophisticated, such as a photo-resistive cell that changes resistance depending on the amount of light shining on it, or a temperature sensor. More discussion on analog data is found in later sections, but for now let's perform a simple process-control experiment using an analog value.
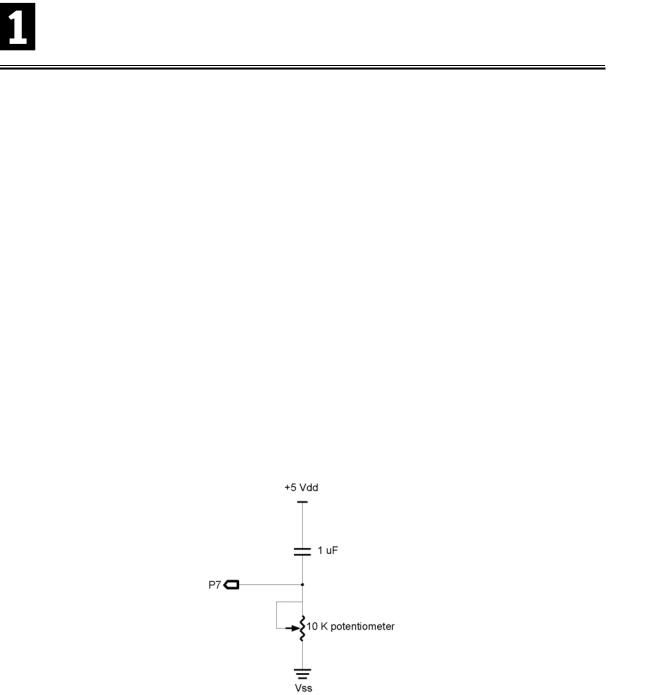
Add the RC network shown in Figure 1.7 to your circuit from the previous experiment. It uses these parts:
(1) 1 uF capacitor
(1) 10K potentiometer
Figure 1.7: Schematic for Analog Data circuit added to Exercise #3
Industrial Control Version 1.1 •Page 17
Experiment #1: Flowcharting and StampPlot Lite
PBASIC Command Quick Reference: RCTime
RCTIME pin, state, resultvariable
•Pin is the I/O pin connected to the RC network.
•State is the input voltage of that pin.
•Resultvariable is normally a word-length variable containing the results of the command.
.
The PBASIC command we will use to read the analog value of the potentiometer is RCTIME. A typical block of code to read the potentiometer is as follow:
Pot VAR WORD
HIGH 7
PAUSE 10
RCTIME 7, 1, Pot
In order for the BS2 to read the potentiometer, the routine needs to take the following steps:
•+5V (HIGH) is applied to both sides of the capacitor to discharge it.
•The BASIC Stamp pauses long enough to ensure the capacitor is fully discharged.
•When RCTIME is executed, Pin 7 becomes an input. Pin 7 will initially read a high (1) because an uncharged capacitor acts as short.
•As the capacitor charges through the resistor, the voltage at Pin 7 will fall.
•When the voltage at Pin 7 reaches 1.4 V (falling), the input state is read as low (0), stopping the process and storing a value in Pot proportional to the time required for the capacitor to charge.
The greater the resistance, the longer the time required for a capacitor to discharge; therefore, the higher the value of Pot. In this manner, we can acquire an analog value from a simple input device.
Let's write a process-control program to make use of this input. Our process will be one where temperature is monitored and a heater energizes below 100 degrees and de-energized above 120 degrees. The potentiometer will represent a temperature sensor and the LED will represent the heater being energized. We will use the debug window to display our temperature and the status of the heater. The maximum potentiometer value, with this combination of resistor and capacitor, may reach 5000, so we will divide it by 30 to scale it to a more reasonable range. Figure 1.8 is the flowchart of the process.
Page 18 •Industrial Control Version 1.1