

Книги по МРТ КТ на английском языке / Neuro Imaging Redcases
.pdf128 RadCases.thieme.com |
RadCases Neuro Imaging |
|
|
■ Imaging Findings |
|
A 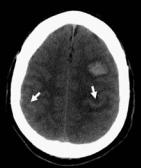 B
B 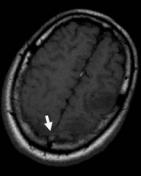 C
C 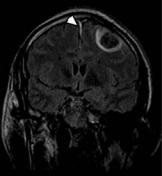
 D
D
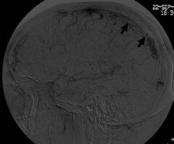
(A) Axial computed tomography (CT) of the brain demonstrates subarachnoid hemorrhage at the vertex bilaterally (arrows) and parenchymal hematoma in the left frontal lobe. (B) Axial T1-weighted image (WI) shows increased signal in the superior longitudinal sinus (arrow). The left frontal hematoma is isointense to the cortex (acute). (C) Coronal T2WI shows subdural hemorrhage in the parafalcine region (arrowhead). The parenchymal hematoma shows a central area of low signal and a rim of high signal. (D) Lateral projection digital subtraction angiography of the venous phase of the left carotid injection demonstrates multiple filling defects in the sagittal sinus (arrows).
■ Di erential Diagnosis
•Parenchymal and extra-axial hemorrhages secondary to venous sinus thrombosis: Parenchymal hemorrhage can be seen in one-third of cases of cerebral venous thrombosis. Hemorrhages are typically cortical with subcortical extension. Smaller zones of isolated subcortical hemorrhage also may be seen.
•Bleeding metastasis: This may be single or multiple, and simultaneous extra-axial hemorrhage is usually absent. Additional nonhemorrhagic metastatic lesions with mass e ect and vasogenic edema are frequently seen.
•Dural arteriovenous fistula: The clinical presentation may be identical to that of sinus thrombosis. Increased venous pressure may result in thrombosis. Conventional angiography demonstrates the arteriovenous shunt in the dura.
■ Essential Facts
•The clinical presentation includes headache, focal neurologic deficits, and seizures.
•Parenchymal changes include infarctions in a nonarterial distribution in the white matter and/or cortical–white matter junction and early hemorrhagic transformation.
•Flame-shaped irregular zones of lobar hemorrhage in the parasagittal frontal and parietal lobes are typical findings in patients with superior sagittal sinus thrombosis.
•Treatment options are anticoagulation with heparin and endovascular recanalization.
■ Other Imaging Findings
•Signs of sinus occlusion are the following: delta sign on noncontrast-enhanced CT (dense triangle from hyperdense thrombus within the sinus), reverse delta sign on contrast-enhanced CT (empty triangle from enhancement of the dural leaves surrounding the comparatively less dense thrombosed sinus).
•Magnetic resonance (MR) imaging: the signal intensity of the thrombus varies with time.
•Time-of-flight (TOF) MR venography is the method most commonly used for the diagnosis of cerebral venous thrombosis. Two planes of acquisition improve the assessment of all the sinuses.
•Contrast-enhanced MR venography is better than TOF MR venography to visualize small vessels.
•CT venography provides a highly detailed depiction of the cerebral venous system, superior to that available with conventional TOF MR venography, and has at least equivalent accuracy for the detection of cerebral venous thrombosis.
¸Pearls & ˚ Pitfalls
¸Restricted di usion may or may not be seen in cerebral
venous thrombosis; when present, it may be reversible.
˚An intrasinus thrombus in the subacute stage may have markedly increased signal intensity on MR images that may be misinterpreted as evidence of flow on TOF MR venograms. A close evaluation of MR venographic source images usually allows di erentiation, as the thrombus signal is typically not as intense as the flow-related signal.
129
Case 65
A
■ Clinical Presentation
A 35-year-old with the new onset of seizures.
Further Work-up
B
C
D

130 RadCases.thieme.com |
RadCases Neuro Imaging |
|
|
■ Imaging Findings |
|
A B 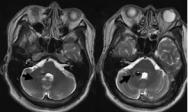 C
C 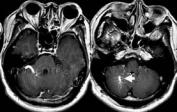 D
D
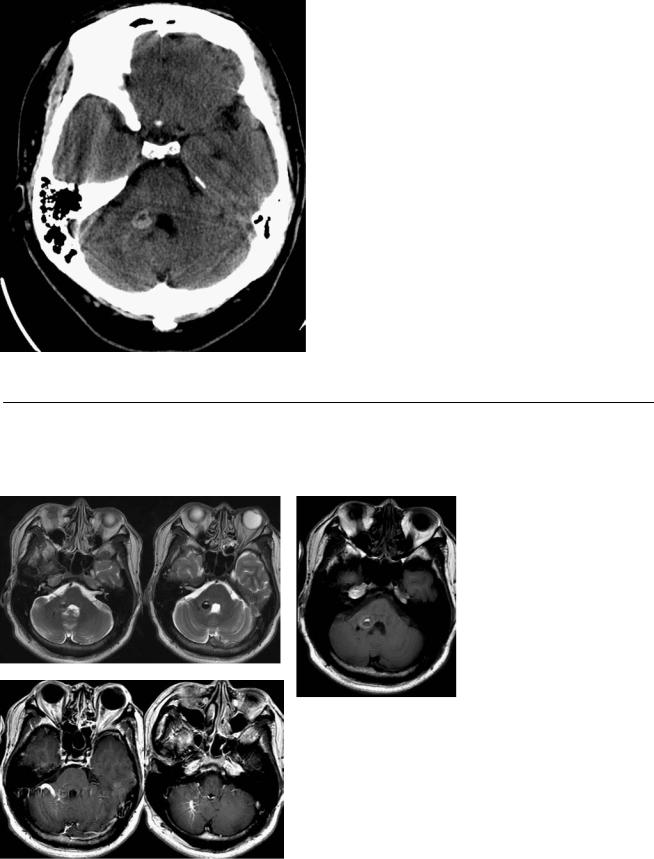
(A) Nonenhanced computed tomography (CT) demonstrates a round area of increased attenuation with a fluidlike core in the right middle cerebellar peduncle (arrow). There is no edema or mass e ect. (B) Axial T2-weighted images (WIs) show a round lesion with heterogeneous intensity. A rim of low signal is evident. There are a few linear flow voids lateral to this lesion (arrows). (C) The areas of high signal on T2WIs are also hyperintense on T1WIs. The dark rim on T2WIs has intermediate signal on T1WIs. Findings are consistent with blood products of di erent ages (arrow). (D) Axial T1WIs after contrast show enhancement of vascular structures, with a linear and a “caput medusae” pattern (arrow).
■ Di erential Diagnosis
•Cavernous malformation (CM) with associated developmental venous anomaly (DVA): CMs are vascular malformations composed of well-circumscribed sinusoidal vascular channels containing blood in various stages of evolution. The lesion is well defined and lobulated, with a reticulated core of heterogeneous T1 and T2 signal as a result of thrombosis, fibrosis, calcification, and hemorrhage. Associated DVA shows a flow void in the draining vein.
•Arteriovenous malformation: This causes variable hemorrhage and gliosis of the adjacent parenchyma and enlargement of the feeding arteries and draining veins. A nidus may be identified on the T2WI, postcontrast T1WI, or conventional angiogram.
•Hemangioblastoma: This is the most common primary in- tra-axial posterior fossa tumor in adults. The second most common location is the spinal cord. Twenty-five percent of all cases are associated with von Hippel-Lindau disease. CT and magnetic resonance imaging (MRI) typically show an enhancing tumor nodule in association with an adjacent cyst.
•CMs are also known as cavernomas, cavernous angiomas,
■Essential Facts
angiographically occult vascular malformations, or cavernous hemangiomas.
•CMs may be asymptomatic, or they may present clinically with headache, seizures, and hemorrhage.
•CMs may be congenital or arise de novo in familial cases and after radiation, pregnancy, or brain biopsy.
•CMs are associated with DVAs (congenital variants of cerebral venous drainage without involvement of capillaries or arteries).
■ Other Imaging Findings
•On CT, there is increased attenuation (from calcium, blood, or both) with indistinct margins, a stippled appearance, and no mass e ect.
•On T2WIs, a signal void is seen in the draining vein; variable degrees of T2 and T1 prolongation may be present in the adjacent parenchyma.
•Contrast-enhanced MRI may show the associated DVA as a series of small, deep parenchymal veins converging toward a larger collecting vein, which follows a trans-
hemispheric course before draining into a normal deep or superficial vein.
•There is a rim of low signal on gradient-echo and T2WIs from hemosiderin and iron deposition in the adjacent parenchyma.
•At angiography, a DVA typically opacifies at the same time as the normal veins, although DVAs in the frontal lobes may opacify earlier with an associated capillary blush.
¸Pearls & ˚ Pitfalls
¸Magnetic resonance perfusion of DVAs can show an asso-
ciation with varying degrees of elevation in the cerebral blood volume, mean transit time, and time to peak.
˚Recent hemorrhage in a cavernous anomaly may result in an atypical appearance, with perilesional and extralesional hemorrhage outside the hemosiderin ring, an increase in size with respect to prior studies, edema, or mass e ect.
˚Follow-up imaging is warranted in these cases.
131
Case 66
A
■ Clinical Presentation
A 55-year-old woman with headaches and left hemiparesis.
Further Work-up
B C D

132 RadCases.thieme.com |
RadCases Neuro Imaging |
|
|
■ Imaging Findings |
|
A 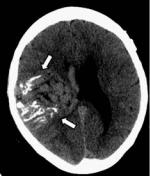 B
B 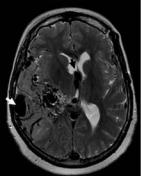 C
C 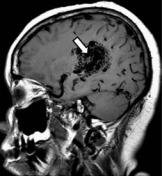
 D
D
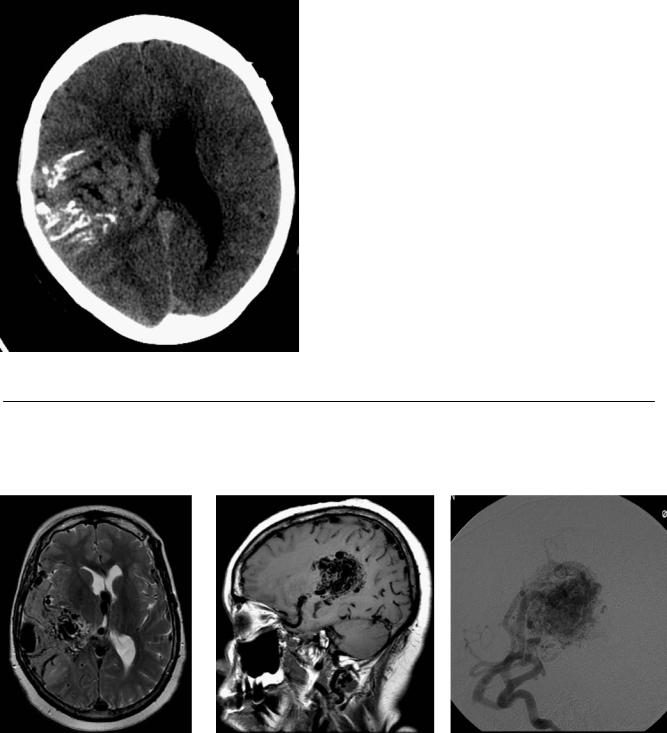
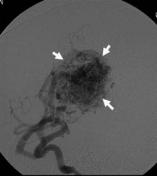
(A) Computed tomography (CT) of the brain shows a large right hemispheric lesion with linear calcifications and serpentine areas of increased attenuation (arrows). Note that the mass e ect of the lesion is small relative to its size. (B) Axial T2-weighted image (WI) shows numerous large flow voids surrounded by areas of high signal in the temporal and parietal lobes, indicative of gliosis. The internal cerebral veins (black arrow) and superficial veins (white arrow) are enlarged. (C) Sagittal T1WI shows flow voids in a large arteriovenous nidus (arrow). (D) Right internal carotid angiogram shows early filling of a large arteriovenous nidus (arrows).
■ Di erential Diagnosis
•Arteriovenous malformation (AVM): AVM is a vascular malformation in which blood flows directly from the arterial system to the venous system without passing through a capillary system (i.e., arteriovenous shunt). Calcifications occur in 25 to 30% of cases. There is strong serpentine enhancement. Magnetic resonance (MR) imaging demonstrates tightly packed flow voids, high T2 signal due to gliosis, and enlarged arterial feeders or draining veins. Blood products of various ages are seen.
•Highly vascular glioma: This presents as an enhancing mass in which prominent intratumoral vessels are the predominant feature. There is significant mass e ect and surrounding edema. Angiogram shows tumor blush without enlarged draining veins.
•Sturge-Weber syndrome: This is also called encephalotrigeminal angiomatosis. It is a neurocutaneous disorder in which angiomas involve the leptomeninges and skin of the face. The abnormal venous drainage of the hemispheres results in the enlargement of collateral veins from the choroid plexus and medullary veins. Chronic cerebral ischemia leads to atrophy and calcification (described as a “tram track” appearance).
■Essential Facts
•AVMs are lesions of the cerebral vasculature.
•The clinical presentation includes hemorrhage, seizure, headache, and progressive neurologic deficit. In pediatric patients, there may also be heart failure, macrocephaly, and prominent scalp veins.
•AVMs have enlarged feeding arteries and draining veins and an arteriovenous nidus.
•Gliosis in the adjacent brain parenchyma is associated with evidence of recent or remote hemorrhage.
•Treatment consists of surgery, stereotactic radiosurgery, and embolization, alone or in combination.
■ Other Imaging Findings
•On CT, an AVM appears as an isoor hyperattenuating mass with limited mass e ect relative to its size.
•CT angiography and MR angiography are helpful to delineate the architecture of the lesion, demonstrate and measure the nidus, and plan treatment; however, they lack the dynamic information that conventional angiography provides.
•Conventional cerebral angiography is the gold standard for characterizing the lesion and planning treatment.
¸Pearls & ˚ Pitfalls
¸The Spetzler-Martin grading system helps predict the
likelihood of a satisfactory outcome if surgical resection is attempted.
¸Grades are assigned depending on the size of the nidus, eloquence of the adjacent brain parenchyma, and deep versus superficial venous drainage.
¸Eloquent areas include the sensorimotor, language, and visual cortex; thalami; hypothalamus; internal capsules; brainstem; cerebellar peduncles, and deep cerebellar
nuclei.
˚ Thrombi within an AVM may simulate hemorrhage.
133
Case 67
A
■ Clinical Presentation
A premature infant with cardiac failure.
Further Work-up
B C D

134 RadCases.thieme.com |
RadCases Neuro Imaging |
|
|
■ Imaging Findings |
|
A 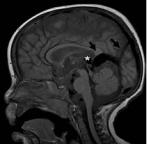 B
B 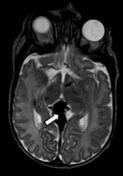 C
C 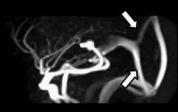
 D
D
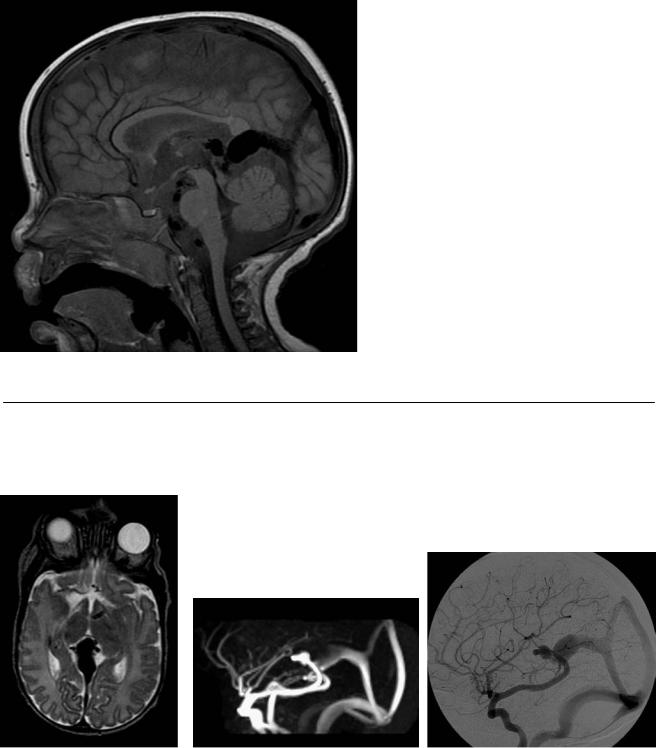
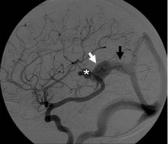
(A) Sagittal T1-weighted image (WI) shows large flow voids in the region of the tectum (asterisk) and prominent midline veins in the margin of the tentorium and occipital region (arrows). (B) Axial T2WI confirms prominent veins in the tectal region (arrow). (C) Sagittal phase-contrast magnetic resonance (MR) venogram shows enlarged veins from the tectum to the torcula and sagittal sinus (arrows). (D) Digital subtracted angiogram of a left internal carotid injection shows a prominent posterior communicating artery and posterior cerebral artery shunting into a venous pouch (asterisk) located anterosuperiorly to the dilated vein of Galen (white arrow), which subsequently drains into a falcine sinus (black arrow) toward the sagittal sinus and torcula.
■ Di erential Diagnosis
•Vein of Galen aneurysmal malformation (VGAM): VGAM is characterized by prominent arteries and veins in the tectum that converge toward a dilated vein of Galen. It is a frequent cause of heart failure in neonates and can be diagnosed in utero.
•Thrombosis of the torcular Herophili: Venous obstructions would result in venous infarcts and hemorrhages, as well as enlarged collateral veins. A lack of flow would be evident in the obstructed sinus.
■ Other Imaging Findings
•Ultrasound can demonstrate the malformation in the fetal period.
•Computed tomography angiography simultaneously depicts the venous and arterial anatomy. The use of iodinated contrast material should be limited in children with a shunt because of the risk for renal dysfunction.
•Cerebral angiography defines the extent of aneurysmal dilatation and details the arterial supply.
■ Essential Facts
•VGAMs are rare congenital vascular malformations characterized by the shunting of arterial flow into an enlarged cerebral vein dorsal to the tectum.
•VGAMs are thought to result from the development of an arteriovenous connection between primitive choroidal vessels and the median prosencephalic vein of Markowski.
•The abnormal flow through the connection retards the normal involution of this embryonic vein and thus prevents the development of the vein of Galen.
•Clinical presentation:
•High-output heart failure in the newborn
•Strokes or steal phenomena
•Hemorrhage (uncommon)
•Hydrocephalus
•Treatment is endovascular embolization.
•MR angiography can help to delineate the vascular supply.
•Venous anatomy is well shown by MR venography.
¸Pearls & ˚ Pitfalls
¸Lasjaunias and colleagues have separated VGAMs from
vein of Galen aneurysmal dilatations (VGADs).
¸In VGADs, a parenchymal arteriovenous malformation drains through the vein of Galen. The dilated vein in these cases drains both brain parenchyma and the malformation, whereas the persistent embryonic vein in the true VGAM drains only the malformation.
¸Patients with VGADs more often present with intracra-
nial hemorrhage.
˚The VGAM may result in hydrocephalus. However, shunting before obliteration of the VGAM is usually avoided because it has been reported to worsen cerebral perfusion.
135
Case 68
A
■ Clinical Presentation
A 75-year-old woman presenting with transient left hemiparesis.
Further Work-up
B C D
136 |
RadCases.thieme.com |
|
RadCases Neuro Imaging |
|
■ Imaging Findings |
|
|
A |
B |
C |
D |
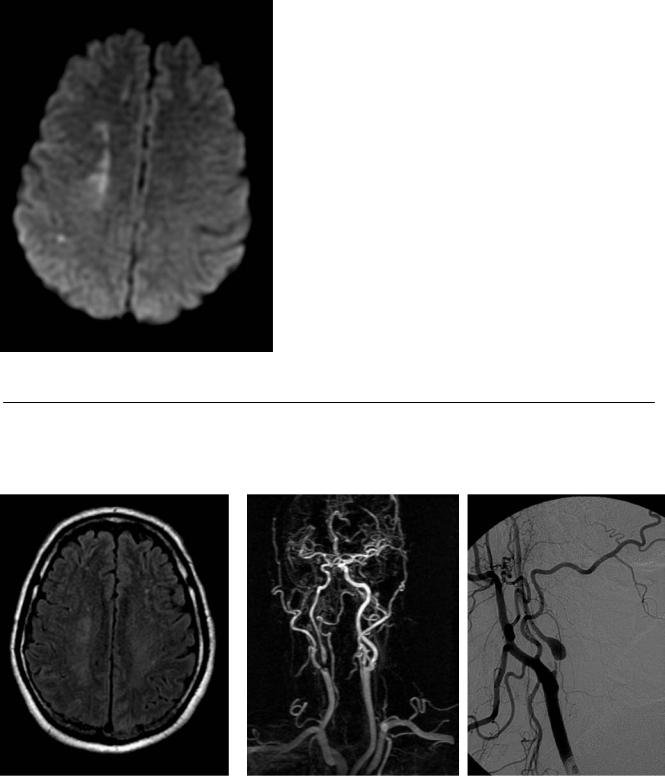
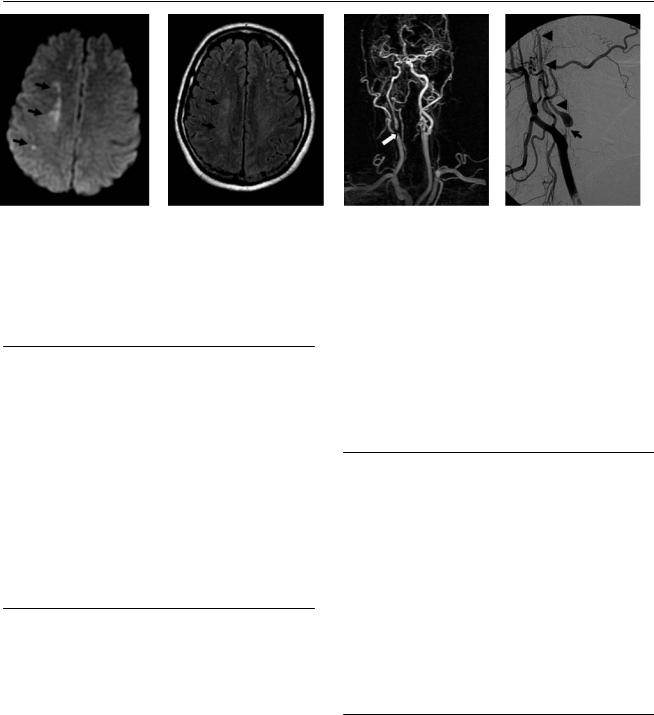
(A) Di usion image demonstrates ischemic changes in the so-called internal watershed in the deep white matter between the territories of the anterior cerebral artery and middle cerebral artery on the right (arrows). (B) Very subtle T2 signal changes are present in the same area on the fluid-attenuated inversion recovery image (arrows). (C) Magnetic resonance angiography (MRA) of the neck with contrast demonstrates signal dropout in the proximal right internal carotid artery (ICA), which is consistent with critical stenosis (arrow). The degree of stenosis cannot be quantified. (D) Critical stenosis (>90%) in the proximal ICA is confirmed on the digital subtraction angiogram (DSA; arrow). The diameter of the distal ICA (arrowheads) is small compared with that of the contralateral ICA (not shown).
■ Di erential Diagnosis
•Critical ICA stenosis: Infarcts in the watershed territories may result solely from hemodynamic compromise, but they are more frequent in the setting of carotid stenosis.
•Carotid pseudoaneurysm: Traumatic disruption of the continuity of the arterial wall results in periarterial hematoma contained by adjacent soft tissues. Subsequent encapsulation results in pseudoaneurysm formation. Other signs of vascular trauma, such as stenosis, dissection, and occlusion, may be present.
•Carotid dissection: This more frequently manifests as a long segment of smooth luminal narrowing. False and true lumina may be demonstrated. Carotid dissection is associated with pseudoaneurysm.
■ Essential Facts
•Atherosclerotic disease of the cervical carotid artery is a frequent cause of stroke.
•Infarcts may occur in the cortical watershed or in the internal watershed (rosary-like pattern in the centrum semiovale).
•Mechanism of stroke:
•Thromboembolism develops from atherosclerotic plaque.
•Low-flow states a ect the territory of penetrating arterioles from the most distal middle and anterior cerebral arteries, which have no potential for collateral supply.
•Most strokes likely represent a synergistic e ect of the two mechanisms.
•Indications for imaging of the carotid arteries are carotid bruit, transient ischemic attack, and ischemic stroke.
•According to the North American Symptomatic Carotid Endarterectomy Trial (NASCET), symptomatic and asymp-
tomatic patients with carotid stenosis of at least 70% will benefit from carotid endarterectomy.
•When the residual luminal diameter is less than 1 mm, the carotid artery distal to the stenosis narrows because of a decrease in the perfusion pressure.
■ Other Imaging Findings
•Conventional angiography is the gold standard for the quantification of stenosis.
•Two noninvasive methods, such as ultrasound, computed tomography angiography (CTA), or MRA, can be used instead of conventional angiography, provided that the findings are concordant.
•The quantification of the degree of stenosis by conventional angiography, CTA, and MRA is based on NASCET criteria for comparing the diameter of the residual lumen to that of the distal ICA.
•In duplex ultrasound, the degree of stenosis is estimated based on the correlation of velocity measurements with angiographic stenosis.
¸Pearls & ˚ Pitfalls
¸Carotid duplex imaging can be limited by the presence of
dense calcifications in the carotid plaque.
¸In MRA, flow-related signal dropout occurs in areas of turbulent or vortex flow.
¸Metallic stents cause signal dropout that limits MRA interpretation.
¸The assessment of stenosis by CTA can be limited by
heavily calcified or circumferential plaques.
˚In DSA or CTA, the ascending pharyngeal artery can be mistaken for a hairline ICA in cases of carotid occlusion.
137
Case 69
A B 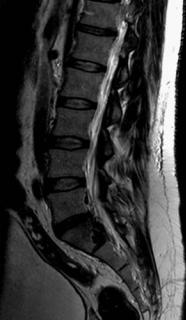 C
C
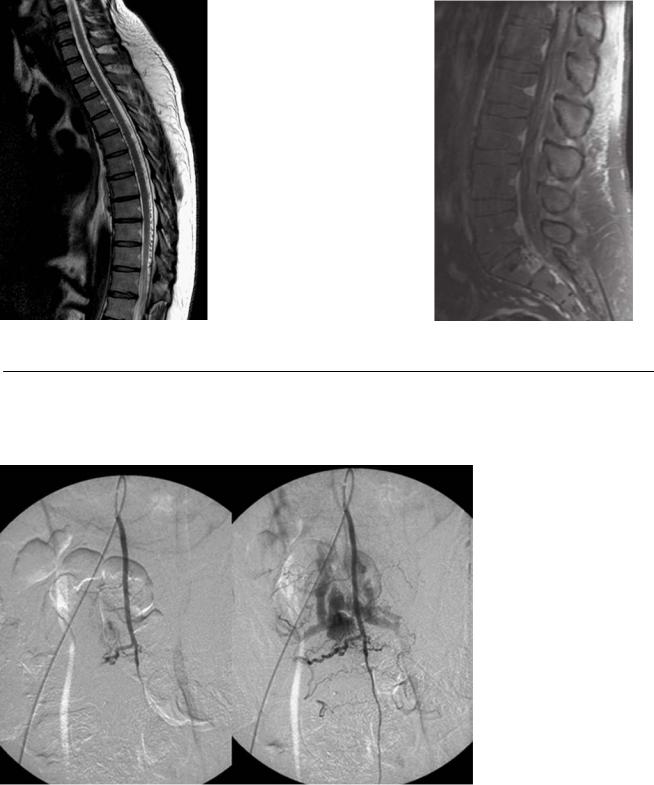
■ Clinical Presentation
A 38-year-old man with lower extremity numbness and progressive weakness.
Further Work-up
D