

Книги по МРТ КТ на английском языке / Magnetic Resonance Imaging in Ischemic Stroke - K Sartor R 252 diger von Kummer Tobias Back
.pdfVascular Anatomy and Pathology |
75 |
Part 2:
MR Imaging of Stroke Pathology

Vascular Anatomy and Pathology |
77 |
5Vascular Anatomy and Pathology
Dirk Petersen and Stefan Gottschalk
CONTENTS
5.1Technical Considerations 77
5.1.1Time-of-Flight MRA 78
5.1.2 Phase Contrast MRA 79
5.1.3Contrast-Enhanced MRA 80
5.1.4 |
Black Blood Angiography and Vessel Wall Imaging 82 |
5.1.5 |
Postprocessing of MRA 83 |
5.2Vascular Anatomy 84
5.2.1 |
Supraaortic Vessels |
84 |
5.2.2 |
Intracranial Vessels |
85 |
5.3Clinical Application of MRA in
Stenoocclusive Arterial Diseases 86
5.3.1Atherosclerotic Diseases 87
5.3.1.1Plaques 87
5.3.1.2Extracranial Stenoses 87
5.3.1.3Intracranial Stenoses 90
5.3.2Arterial Dissection 92
5.3.3Fibromuscular Dysplasia 94
5.3.4 Moya Moya Phenomenon 94
5.3.5Vasculitis 94
5.3.6 |
Stenoses of Other Etiologies |
95 |
5.3.7 |
MRA in Clinical Protocols |
96 |
5.3.8 |
Limitations and Pitfalls of MRA 98 |
|
|
References 99 |
|
5.1
Technical Considerations
The term MR angiography (MRA) does not denote a single imaging technique or MR-pulse sequence but it stands for a variety of different methods of vessel imaging, which are more or less comparable with classical angiographic examinations. As a robust method for the depiction of intracranial arterial stenoses the time-of-flight MRA (TOF-MRA) is widely accepted (Ozsarlak et al. 2004), while the contrast-enhanced MRA (CE-MRA) dominates the assessment of cervical stenoses (Wetzel and Bongartz 1999). It might be pointed out, that the best MRA technique does not exist. The selection of
D. Petersen, MD
S. Gottschalk, MD
Institute of Neuroradiology, University of Lübeck, Ratzeburger
Allee 160, 23538 Lübeck, Germany
a suitable MRA technique depends on the technical equipment of the MR scanner, the vascular region of interest, the ratio of technical and temporal expense and of the clinical tasks. For instance protocols for hyperacute stroke diagnosis in emergency cases might differ from those for perfect vessel analysis in investigation of ischemic stroke in principle.
The terms 2D and 3D have different meanings, whether they are used for data acquisition techniques (i. e. pulse sequences) or for image display, respectively. 2D acquisition means for MR angiography that, for a a relatively short period of time, either a primary projection image of vessels from a thick volume [for instance in phase contrast MRA (PC-MRA)] or a single thin slice is produced. The sequential acquisition of a series of multiple thin slices with or without gaps is also termed 2D in this sense (for instance in sequential 2D TOF-MRA). In pulse sequences for 3D data acquisition, which are chosen in the majority of MRA purposes, so-called 3D Fourier transformation (3DFT) algorithms are applied, which allow the simultaneous acquisition of three-dimensionally defined volume data from a thick slab by use of a second phase encoding HF gradient. The image data are, however, also displayed primarily as thin, gapless subslices (partitions). In 3D measurements, image data for every single voxel of the volume are collected over the entire measurement time, which lasts up to several minutes. 3D measurements provide an improved signal-to-noise ratio and thus allow a better spatial resolution in a given time. Despite the 2D or 3D acquisition mode, the source images can be viewed and analyzed separately as single slices or after adequate postprocessing procedures (see Sect. 5.1.5) as three-dimension- ally reconstructed projection images.
The MRA techniques discussed in the following base on gradient echo sequences and can generally be divided into flow-dependent and flow-indepen- dent ones . The main flow dependent techniques are: time-of-flight MRA (TOF-MRA) and phase contrast MRA. CE-MRA, in contrast, is blood flow-indepen- dent, although flow phenomena can still influence
78 |
D. Petersen and S. Gottschalk |
image quality. Flow-dependent high resolution MRA acquisition techniques normally require several minutes for data acquisition while flow-independent measurements can be performed within (and up to approximately 30) seconds. The higher the gradient system capability, the faster data acquisition is. The gradient system power on the other hand is limited by safety considerations in order to avoid stimulation effects in patients.
Very fast flow-independent MRA techniques require the intravenous application of MR contrast agents using extremely exact timing protocols. The same contrast media can be used for parenchymal and angiographic imaging. The choice of a contrast agent is mainly determined by its relaxation and viscosity parameters (Friese et al. 2001b). A group of specific contrast media with a prolonged intravenous circulation (blood pool agents) provide advantages for MRA with high spatial resolution but they are not yet commonly used (van Bemmel et al. 2003) for cerebral vessels.
Clinical MR tomographs work mostly with magnetic field strengths from 0.5 to 1.5 T. High field 3-T machines have also been used in recent years. They are characterized by a higher signal-to-noise ratio which enables an improvement of spatial resolution in order to depict smaller intracranial vessels (Al Kwifi et al. 2002). For MRA with inflow methods, the stronger saturation effect on stationary tissue improves the vessel signal-to-noise ratio. T1 shortening due to contrast agents, on the other hand, is less effective at higher field strengths.
For the examinations of intracranial vessels the same coil systems are used as for conventional MRI of the skull. For a combined examination of intracranial and cervical vessels specially integrated coil systems are needed which can receive signals from the circle of Willis down to the aortic arch. Improvements of coil design and high frequency (HF) capabilities allow remarkable reduction in acquisition times by the use of parallel acquisition techniques (Tintera et al. 2004).
5.1.1 Time-of-Flight MRA
Time-of-flight MRA is based on gradient echo sequences with very short repetition times (Laub and Kaiser 1988). The repeated HF excitations cause a relative spin saturation – i. e. signal reduction – in stationary tissue, while inflowing unsaturated blood is depicted with high signal. A saturation
pulse cranially to the acquisition volume is usually applied to suppress the signal of venous downward flow, so that intracranial and cervical arteries can be depicted selectively within certain limits.
After the spins have entered the acquisition slab, the inflow-related high blood signal gradually decreases due to spin saturation according to the time period or number of excitations, respectively, rather than flow direction. Variations of the flip angle over the acquisition volume reduce saturation effects of moving blood protons (TONE = tilted optimized nonsaturating excitation). This homogenizes vessel contrast and elevates the signal in distal vessel segments. Despite TONE, however, the imaging of distal vessel segments is impaired. This limits the thickness of acquisition volumes and is a well known disadvantage of TOF-MRA. For the acquisition of larger volumes, the technique of multiple overlapping slice acquisition (MOTSA) was developed (Davis et al. 1993). This technique needs additional measurement time but can alternatively be used to enhance the signal in distal vessels.
Theoretically, 3D TOF-MRA can reach a spatial resolution of up to 0.2 mm voxels. With 1- to 1.5- T magnets this would not provide an acceptable signal-to-noise ratio and therefore in clinical routine the spatial resolution is realistically in a range of approximately 0.5 mm. 3D TOF-MRA is widely accepted as a standard for depiction of intracranial stenosis (Dagirmanjian et al. 1995; Oelerich et al. 1998). Intracranial TOF-MRA should depict the ves-
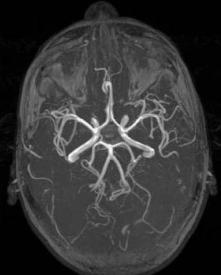
Fig. 5.1. Typical TOF-MRA (three overlapping slabs) of basal intracranial arteries. Maximum intensity projection. Slightly bright signal from fat tissue (orbits, skin)
Vascular Anatomy and Pathology |
79 |
sels from V4 vertebral artery segment through the M3 segments of the MCA (Fig. 5.1). Limitations of TOF-MRA in the assessment of stenoses are mainly caused by two factors: turbulence and slow or recirculating blood flow. These conditions can lead to overestimation of the stenosis grade, as well as of the length of an arterial stenosis. In patients with even physiologic vessel tortuosity (Fig. 5.2) or high flow velocities (children) non-existing stenoses can be simulated, so that a reliable quantification of stenosis remains problematic. The negative predictive value of a TOF-MRA, however, is high.
In maximum intensity projections of TOF-MRAs, typical overlaps of short T1 tissue (fat or subacute hemorrhages) can occur and affect diagnostic accuracy. Hematomas or thrombus material with short T1 have a high signal which can not be suppressed in TOF sequences (Fig. 5.3), but would not be signal intensive in PC-MRA. Specific excitation pulses can suppress the fatty high signal in bone marrow or within the orbits. So-called water excitation pulse sequences can provide an excellent fat signal suppression, but they are sensitive to typical artifacts
due to susceptibility effects. This, for instance, leads to depiction of pseudostenosis, when the internal carotid artery comes close to the air in the sphenoid sinus (Fig. 5.4) (Gizewski et al. 2005). Certain regions with high fat signal such as the orbits can also be interactively removed before secondary reconstruction and then do not impair interpretation.
5.1.2
Phase Contrast MRA
Moving along a magnetic field gradient, spins experience a shift of the transverse magnetization. In phase contrast angiography, the phase shift of flowing blood is determined in several measurements in three directions in space and the vector of the differences is displayed as an image. The vector is proportional to velocity as long as the maximally expected flow velocity of blood is in a range that would cause phase shifts of less than 180º. If these conditions are fulfilled, the phase contrast can be assigned to
a
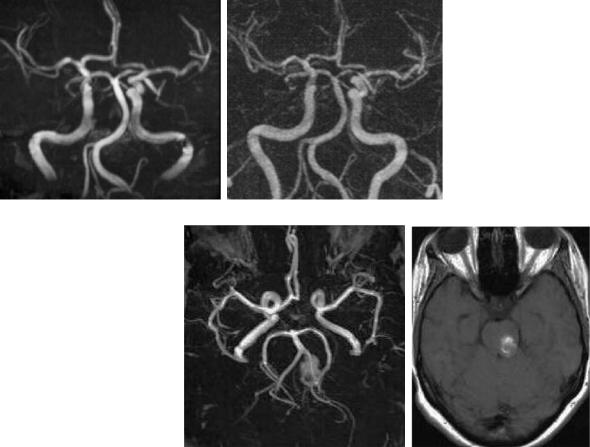
Fig. 5.3a,b. Bright pontine lesion on 3D reconstructed (MIP) TOFMRA (a). T1-weighted precontrast spin echo reveals methemoglobin in a cavernous hemangioma as the source of bright signal (b)
Fig. 5.2a,b. Pseudostenosis due to turbulent flow. Signal loss at the sharp bending
of the left ICA entering the carotid canal on TOF image (a), smooth vessel enhancement on CE-MRA (b)
b
a |
b |
80 |
D. Petersen and S. Gottschalk |
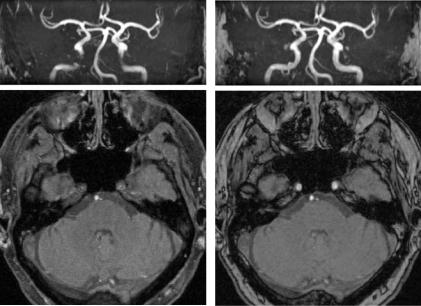
Fig. 5.4a,b. Susceptibility artifacts: due to the vicinity of air in the sphenoid sinus the flow signal of ICA is lowered symmetrically on the TOF images
(a), when a fat-signal suppressing water excitation pulse sequence was used. The conventional TOF/ TONE sequence shows no false vessel extinction, but a higher background signal from fat tissue (b)
a |
b |
a velocity encoding (VENC). Due to different flow velocities, arteries and veins are depicted with different contrast according to the selected VENC.
Drawbacks of PC-MRA are seen in its susceptibility for patient movements and its impairment by pulsatile or turbulent flow patterns. The diagnostic sensitivity of 3D PC-MRA in intracranial stenosis is markedly lower than with 3D TOF-MRA (Oelerich et al. 1998). Advantages are the good suppression of stationary tissue signal with the lack of interference with short T1 tissues, and the depiction of large volumes without limitations due to spin saturation effects.
Clinically, PC-MRA is often used for laminar flow with few pulsations as for example in the cerebral venous sinuses. Many users apply it as a thick slab 2D technique with short acquisition times and primary projective vessel depiction. 3D PC-MRA demands relatively long measurement times for data acquisition and is somewhat sensitive to patient movements. Principally, phase contrast methods additionally enable a quantification of blood flow velocity and the assessment of flow directions.
5.1.3 Contrast-Enhanced MRA
To overcome known drawbacks of TOF-MRA, fast contrast-enhanced 3D MRA was developed. Application of a paramagnetic contrast agent reduces spin saturation phenomena in large examination volumes
but deals with the disadvantage of unwanted venous contrast overlap if measurement times exceed arteriovenous transit time. The development of very powerful gradient systems, however, enable application of strongly T1-weighted 3D gradient echo sequences with short acquisition times. Very short repetition times (TR) significantly reduce the signal of stationary tissue even more than in TOF-MRA. The native signal of flowing blood is also reduced. Intravenous application of a paramagnetic contrast agent bolus then produces a very strong intraluminal enhancement during the first pass, which is used for the depiction of vessels. If there is strong background signal, subtractions of preand post-contrast images make it possible to eliminate that signal almost entirely (Fig. 5.5). CE-MRA does not depict complex flow phenomena such as in TOF-MRA or PC-MRA but the intravascular blood itself, which provides a very short T1 due to a relatively high concentration of contrast agent during its first pass. To avoid the overlap of arterial and venous contrast, short data acquisition times must be maintained. Since 6–8 s of arteriovenous transit time would not be sufficient for the acquisition of high resolution 3D data sets in large volumes, only that portion of raw data is collected during the critical 6- to 8-s time period, which is most relevant for image contrasts. The portions of data most relevant for edge resolution are collected afterwards and do not count for venous signal. The very accurately performed individual timing of intravenous contrast agent application is mandatory for a perfect CE-MRA. It can be achieved by measuring
Vascular Anatomy and Pathology |
81 |
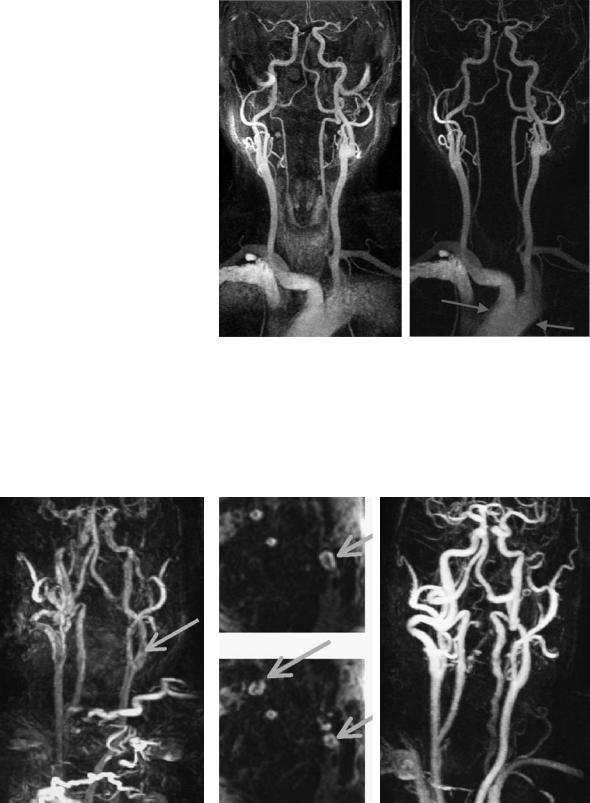
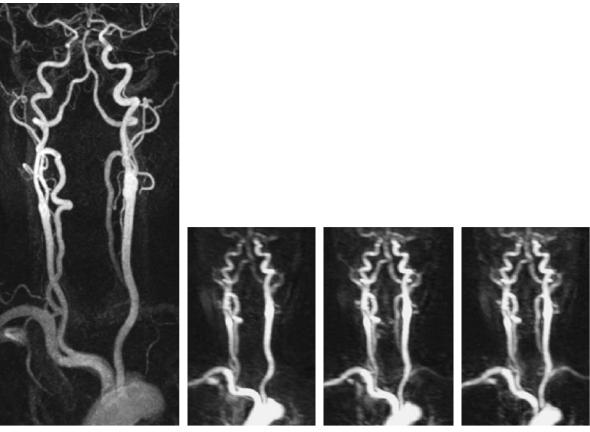
Fig. 5.5a,b. Image postprocessing: subtraction of prefrom post-contrast high resolution CE-MRA improves signal suppression from stationary tissue. Notice a mild blurring (smoothing) of the edges of the carotid arch and the proximal subclavian arteries, due to respiration and pulsations
a |
b |
the individual bolus arrival time using a test bolus or by using fluoroscopic bolus control and automated start of data acquisition. Failed bolus timing even in the range of 1–2 s does not only cause unsatisfactory vessel contrast but sometimes produces bizarre artifacts (Fig. 5.6) which can severely obviate correct interpretation.
Acquisition times of CE-MRA are determined by the desired spatial resolution. Given the physiologic arteriovenous transit time of approximately 8 s the use of an adequate read-out technique allows a total acquisition time of 25–30 s without impairment due to venous contrast. This leads to a maximum spatial resolution of 0.5–0.8 mm with partition thicknesses below 1 mm.
b
a |
c |
d |
Fig. 5.6a–d. CE-MRA: failed bolus timing resulted not only in a weak artery signal, but also artificial enhancement of vessel walls (ringing artifacts), similar to intraluminal thrombus. Examination was repeated and revealed normal vessel enhancement
82 |
D. Petersen and S. Gottschalk |
CE-MRA is currently the most used MRA technique for cervical carotids and other extracranial vessels of the body (Carr et al. 2002; Remonda et al. 2002). With 1.5-T magnets, however, the spatial resolution is still markedly inferior compared with TOF-MRA, since the time for data collection can not be extended over minutes. CE-MRA is increasingly used for intracranial indications as well (see below). The advantages are seen in a low sensitivity for signal loss due to turbulence (Fig. 5.2) or velocity displacements of streaming blood. This affords an opportunity to assess stenoses more reliably than with TOF or PC-MRA (Gottschalk et al. 2002), as long as sufficient anatomic resolution is provided.
CE-MRA also allows repetitive measurements to follow the passage of contrast bolus. Reduction in the number of slices and of in-plane resolution admits sequential measurements with a temporal resolution of less than 1 s (Krings and Hans 2004). In combination with high resolution measurements, thus dynamic processes in arteriovenous shunts or for instance in steal phenomena can be studied (Fig. 5.7).
5.1.4
Black Blood Angiography and Vessel Wall Imaging
While arterial flow causes an increase of signal in gradient echo sequences due to inflow effects (see Sect. 5.1.1), it leads to signal loss in spin echo sequences, known as flow void (Bradley, Jr. et al. 1984). The amount of signal loss is dependent on presaturation and on velocity of inflowing blood. Vessel lumens are homogeneously black when the presaturation is excellent. The high image contrast between vessel lumen, vessel wall, and surrounding tissue makes it possible to depict vessels as so-called black blood angiography (Edelman et al. 1990). The method did not become widely accepted in the first instance since spatial resolution and pre-saturation were often unsatisfactory to outline vessel contours sufficiently. Meanwhile the construction of specifically dedicated HF coils provided the preconditions for improved high resolution black blood MR studies of arteriosclerotic plaques in the carotid artery (Hayes et al. 1996). Studies now show that with the use of adequate
Fig. 5.7a–d. Time resolved sequential MRA. On high resolution CE-MRA (a), the left vertebral and left subclavian arteries are not fully enhanced. Selected images from a time-resolving sequence (b–d) with one frame per second demonstrate top-down contrast filling of the left vertebral artery and delayed enhancement of the left subclavian artery. Note low spatial resolution of sequential images
a |
b |
c |
d |
Vascular Anatomy and Pathology
HF coils and optimized MR sequences a characterization of plaque structure can successfully be performed that possibly could help to predict the risk of plaque rupture (Figs. 5.8, 5.9) (Yuan et al. 2001).
a
b
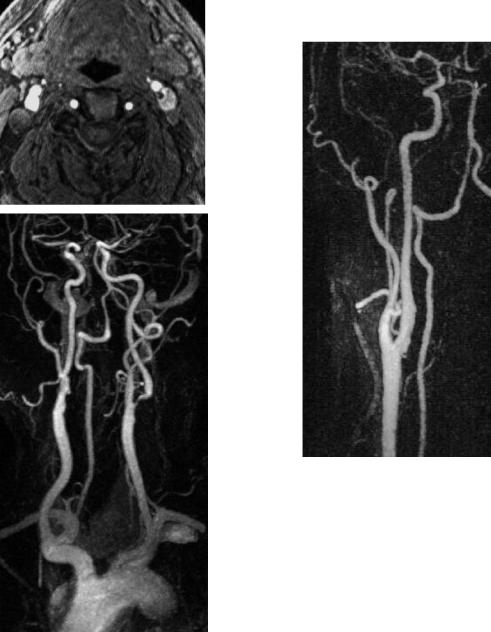
Fig. 5.8a,b. Assumed signal intense plaque (a). Source image of TOF-MRA at the level of the carotid bulb displays bright material, ultrasound showed no evidence of a thrombus. On CEMRA there is a short eccentric stenosis of the left ICA (b)
83
 a
a
b
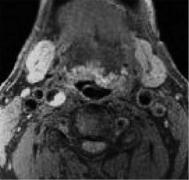
Fig. 5.9a,b.Subacute wall-adherent thrombus (a).After embolic infarction of the middle cerebral artery ultrasound has identified an echolucent structure within the ICA, highly suggestive of thrombus. T1-weighted spin echo image with fat saturation confirms an intraluminal thrombus (a) with a mild stenosis (a, b), gradually resolving over weeks
5.1.5
Postprocessing of MRA
MRA data sets typically consist of multiple (60–100) partitions, containing a large amount of detailed information. To achieve an overview, 3D vessel images are calculated from these data by the use
84 |
D. Petersen and S. Gottschalk |
of different reconstruction algorithms. Maximum intensity projection (MIP) is the standard method. Signal intense vessels emerge from low signal background. MIP does not depend on a threshold value. Very small vessels, however, may have overly low contrast against background noise. In these cases a selective restriction of the volume of interest before MIP calculation can improve vessel depiction. Occasionally a diagnosis can be made from original source images alone which are optimally viewed on adequate postprocessing workstations. Multiplanar 2D reconstructions facilitate the evaluation of details in complex anatomic regions, while the overview is given by 3D reconstructions.
Alternatively, 3D images of MR angiographies can be calculated using volume rendering techniques (VRT) or shaded surface display (SSD). Both methods, however, depend on threshold values and therefore they carry the risk of unwanted manipulation. They are less suitable for the depiction of stenoses and are commonly used for aneurysms and other vascular malformations.
5.2
Vascular Anatomy
5.2.1
Supraaortic Vessels
The ascending aorta is approximately 5 cm long and merges smoothly into the aortic arch in the mediastinum. Under normal conditions, the truncus brachiocephalicus, the common carotid artery (CCA) and the left subclavian artery originate from the aortic arch. The right and left vertebral arteries have their origin in the proximal segment of the corresponding subclavian arteries. The aortic arch offers numerous variants:
The truncus brachiocephalicus and the left CCA show a combined origin from the aortic arch in approximately 25% of cases. The left vertebral artery rarely arises directly from the arch proximal to the subclavian artery. Infrequently an aberrant right subclavian artery leaves the aorta distal to the left subclavian artery and crosses the mediastinum dorsal to the esophagus and is then called the arteria lusoria (Fig. 5.10). Elongations and ectasias of the aortic arch and supraaortal vessels, which can impair the imaging quality of the vessels, are often seen in elderly patients.
a
b |
c |
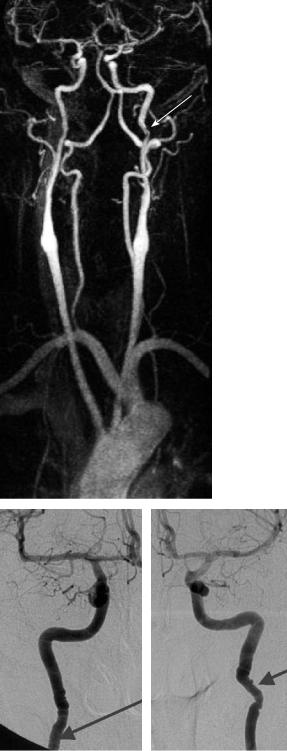
Fig. 5.10a-c. Fibromuscular dysplasia. CE-MRA (a) after right hemispheral TIA is suggestive of distal vessel wall irregularities (arrows). Diagnosis was made by DSA (b, c), showing bilateral ‘string of beads’ sign typical for FMD. As a variant, also note the aberrant course of the right subclavian artery with its origin distal of the left arteria lusoria
Vascular Anatomy and Pathology |
85 |
MR angiography of the aortic arch is provided in high quality by CE-MRA. Free projections and selective volume restrictions enable elaborate single vessels. Respiration movements can typically smooth the outlines of the arch (Fig. 5.5). This effect can be minimized by breath-hold techniques (Carr et al. 2002). Strong pulsations, however, also lead to blurred vascular outlines and can cause signal voids in tiny origins such as the vertebral arteries (Leclerc et al. 2000). ECG-triggered sequences can compensate pulsation artifacts in MRA (Arpasi et al. 2000) but they require shortened acquisition times which imply limited anatomic resolution.
The carotid bifurcation can be seen in 80% of the adult population at the level of cervical vertebrae 3– 5. Distal to the physiologic dilatation of the carotid bulb the internal carotid artery (ICA) proceeds dorsally to the external carotid artery (ECA) into the petrous bone. Entering the bony carotid canal, it describes a sharp bend and thus causes turbulent flow patterns with somewhat typically symmetrical signal loss on TOF-MRA, which should not be misinterpreted as real stenoses (Fig. 5.2).
5.2.2
Intracranial Vessels
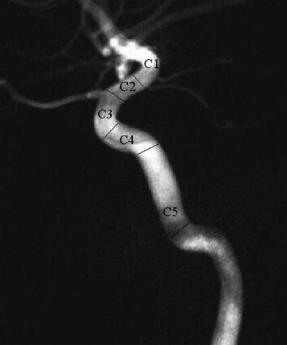
The internal carotid artery is anatomically divided into segments. Fischer (1938) primarily defined five intracranial segments (Fig. 5.11) beginning at the carotid T. A modern classification by Bouthillier et al. (1996) names seven segments instead of five which are counted in an anatomically reverse order in flow direction. In the following we use Fischer’s nomenclature which is also still used in the ultrasound literature. The segments C2–C4 form the carotid siphon, which offers considerable variants in shape. It can resemble a “v” or an omega, or even a double siphon. Elongations of the siphon lead to artificial signal voids in flow-dependent MRA sequences, which express flow displacement effects (Pipe 2001).
Anomalies of the ICA are infrequent, and aplasia of the ICA is a rarity (Van de Perre et al. 2004). In hypoplasia, the vessel tapers off behind a normal proximal segment and can sometimes be followed up to the circle of Willis. Occasionally differential diagnosis is difficult against an arterial dissection or a very high grade stenosis with a collapsing distal lumen (pseudoocclusion). In cases of doubt, the CT shows the hypoplastic osseous carotid canal (Chen et al. 1998). An aberrant lateral course of ICA
Fig. 5.11. Carotid segments according to Fischer (1938)
through the tympanum has no impact on the diagnosis of stenoses.
Small hypophyseal and meningeal branches of the ICA are not visible in MR angiographies. The first originating vessel is the ophthalmic artery from the C3 segment. Distally the posterior communicating artery and subsequently the anterior choroidal artery arise from the ICA. A direct origin of the posterior cerebral artery from the ICA is referred to as embryonic type.
The posterior communicating artery offers significant variations in size and is often not sufficiently visible in MRA. If it is utilized for a collateral circulation, it can increase in signal and size, but lacking detection in MR angiography in patients with proximal stenosis does not permit an assessment of the lack of collateral flow (Hartkamp et al. 1999; Hoksbergen et al. 2003).
The anterior choroidal artery is mostly detectable only on source images, not on MIP of a TOFMRA (Wiesmann et al. 2001), because of its very small size. Consequently, definite statements about pathology can not be made.
The middle cerebral artery (MCA) is divided into four segments. The horizontal M1 segment reaches laterally to the bifurcation or trifurcation, the insular segments within the Sylvian fissure are named