

Книги по МРТ КТ на английском языке / Magnetic Resonance Imaging in Ischemic Stroke - K Sartor R 252 diger von Kummer Tobias Back
.pdf138 |
|
|
|
|
|
S. Wegener et al. |
|
necrosis |
apoptosis |
|
cavitation |
|
|
Ischemia |
|
|
||||
inflammation |
gliosis |
|
cyst formation |
|
||
|
|
|
|
|
(cyst) |
|
|
|
|
|
|
|
|
|
|
|
|
|
|
Fig. 8.3. Schematic overview of T2- |
|
|
|
|
|
|
weighted MRI changes and blood–brain |
|
|
|
|
|
(no |
barrier (BBB) opening after experimen- |
|
|
|
|
|
tal ischemia. The x-axis reflects the |
|
|
|
|
|
|
cyst) |
|
|
|
|
|
|
|
evolution of events over time while the |
|
|
|
|
|
|
y-axis illustrates relative intensity of the |
hours |
days |
1 week |
2 weeks |
4 weeks |
||
|
|
|
|
|
|
variable under investigation. tMCAO, |
|
|
|
|
|
|
|
|
|
|
|
|
|
transient middle cerebral artery (MCA) |
|
|
|
T2 |
|
|
|
|
|
|
|
|
occlusion; pMCAO, permanent MCA |
|
|
|
|
BBB (tMCAO) |
|
|
|
|
|
|
BBB (pMCAO) |
|
|
occlusion |
More likely, the “state” of water as “free” or “bound” or other macromolecular restructuring processes in the tissue early after ischemia must be assumed to cause the observed parameter changes. The rise in relaxation times was more pronounced in the caudate putamen than in the cortex. In concert with absolute relaxation time values, lesion areas on T1 and T2 maps grew during the observation period.
Depending on the experimental setting, different groups reported different time points of initial changes in relaxation times after ischemia, ranging from minutes (Brant-Zawadzki et al. 1986, Kavec et al. 2004) up to about 4 h, rarely later (Bose et al. 1988; Helpern et al. 1993; Knight et al. 1991, 1994; Loubinoux et al. 1997). T1 has been found to increase after T2, and changes to a lesser degree (Bose et al. 1988; van Bruggen et al. 1994).
In a photothrombotic stroke model, in which thrombosis of cortical microvessels is initiated by a laser beam through the intact skull activating rose bengal, a substance that damages endothelial cells and leads to microvascular occlusion, T2 values were elevated at the lesion already 15 min after light exposure (Pierpaoli et al. 1993). However, this procedure, even though leading to permanent vascular occlusion, is governed by different pathophysiological mechanisms that make it difficult to compare to MCAO approaches: the direct endothelium damage in this model leads to rapid disturbance of the BBB, thus explaining the fast T2 relaxation time increase. There is general agreement about the following steady rise in T1 and T2 times, until a peak is reached between 24–72 h (Bose et al. 1988; Helpern et al. 1993; Knight et al. 1991, 1994; Loubinoux et al. 1997; Quast et al. 1993; van Bruggen et al. 1994). Over the following 1–2 weeks, this maximum in relaxation time values gradually declines, but
values remain above control levels (Helpern et al. 1993; Knight et al. 1991; Quast et al. 1993). Proton density was found to increase in a study by Knight and colleagues (1991) after pMCAO, but “lagged behind” T1 and T2 times (rise after 24 h, maximum at 96 h, return to control levels at 168 h). The same group reported similar delayed increases in PD in some rat brain regions (e.g., primary somatosensory cortex), but no changes in other areas (e.g., medial portion of caudate putamen) in a later work (Knight et al. 1994). Correspondingly, relaxation times rose to a different degree and at different time points, depending on the region of interest under investigation. In addition to a region-specific macromolecular structure of brain tissue, such as lipid-rich myelin sheaths within subcortical areas, the degree of ischemic severity may well vary within the brain.
Using 2,3,5-triphenyltetrazolium chloride (TTC) stain for the mapping of tissue viability, Bose and colleagues (1988) demonstrated a good correlation of relaxation times with loss of TTC stain (which matches loss of metabolic cell viability in vasogenic edema) earlier than with neuropathological signs of cell damage. Histologically determined brain swelling was estimated with high accuracy from T2-w images in another study at early time points (1–3 days) after pMCAO (Barone et al. 1991; Loubinoux et al. 1997). Nevertheless, there is also data suggesting that the MR parameters T1 and T2 do not reliably reflect histological tissue status after pMCAO (Knight et al. 1994). The appearance of large numbers of shrunken, dark-stained eosinophilic neurons (indicative of irreversible damage) corresponded with peak T1 and T2 values, but no significant correlation was found between histologic score and MR parameter at any time point (Knight et al. 1994).
Ischemic Edema and Necrosis
8.2.2.2
Transient Occlusion Models
Temporary occlusion of an artery offers important insights into the phenomenon of reperfusion. Although transient MCAO (tMCAO) by a thread or clip is a common approach, the injection of blood clots and the consecutive attempt of a successful clot breakdown with thrombolytic therapy is even closer to the clinical situation (Niessen et al. 2002) (Fig. 8.2). Varying temporary occlusion times have been investigated with regard to histologic outcome and MRI pattern of infarct evolution. The phenomenon of reperfusion injury and secondary energy failure was described on diffusion-weighted images and has drawn attention to more chronic observation time points for the characterization of ischemic injury (Hata et al. 2000; Olah et al. 2000). Furthermore, short-term arterial flow restriction gave rise to the discovery of incomplete infarction and selective neuronal death as injury mechanisms, limited to a subpopulation of neurons, but potentially growing at later time points (Garcia et al. 1996).
In a study by Olah and colleagues (2000), T2 relaxation times were followed for 10-h reperfusion after 1 h of MCAO. Similar to the earlier results on permanent MCAO by the same group (HoehnBerlage et al. 1995), T2 values increased steadily starting within the first hour after reperfusion. While relative T2 values (% preischemic control) did not reach the level of corresponding observation times after permanent occlusion, the amount of early T2 increase in a voxel was predictive of its later chance for recovery. The major factor influencing relaxation time dynamics in transient MCA occlusion is occlusion time. When applying transient MCA occlusion for 20, 30, 45, and 90 min to a distal branch of the MCA, leading to cortical infarctions, van Lookeren-Campagne and colleagues (1999) found that 20 min did not induce MR parameter changes, but that 90 min lead to profound increases in T2 times at 6 h after reperfusion, culminating towards 48 h. The intermediate occlusion times 30 and 45 min lead to a delayed increase in T2 24 h after reperfusion, accompanied by a secondary decline of the ADC on DWI. Infarctions of the 90-min occlusion group were 50% larger compared to the 30or 45-min occlusion group, when assessed histologically after 18 days (van Lookeren Campagne et al. 1999). Other investigators observed time courses of relaxation parameters after tMCAO that can be summarized as follows: early (30 min–4.5 h) T1 and
139
T2 increases follow after longer (1–2.5 h) occlusion times, while late (12–24 h) increases follow after shorter (30–45 min) occlusion times. As in permanent MCAO, peak changes of relaxation time values are reached at around 48 h, after which the values decrease over the following week, only to either remain stable or to rise to a second peak around 2 weeks after ischemia (Fig. 8.3). This secondary increase in T2 was correlated to “tissue liquification” and cyst formation (Ishii et al. 1998; Li et al. 2000; Lin et al. 2002a,b; Neumann-Haefelin et al. 2000; Palmer et al. 2001; van Dorsten et al. 2002; Virley et al. 2000). Proton density maps depicted signal increases in some brain regions (Virley et al. 2000) only at time points (several days) much later than T2. Neumann-Haefelin and colleagues (2000) used contrast agent-enhanced T1-w MRI to detect BBB damage after different occlusion times. Their results demonstrate an early leakage of contrast agent in animals subjected to 2.5 h of MCAO, that was not detected after a short occlusion time of 30 min.
At longer survival times, it was noted by some groups that T2-w MRI underestimated true infarct volume to some extent (Ishii et al. 1998; NeumannHaefelin et al. 2000), while others found a good correlation with histology (Palmer et al. 2001). Factors that could potentially shorten T2 have been discussed: resolution of vasogenic edema and ischemic tissue, accumulation of paramagnetic substances (e.g., iron) in the lesioned area, or increased gliosis. Closer investigation of this so-called MR fogging effect by Lin and colleagues (2002a) revealed that a decrease in water content rather than iron deposits causes this partial T2 normalization. The issue is still under debate, as others have found that T2 is influenced by glial infiltration (Ishii et al. 1998), and own results using T2*-w MRI and histology demonstrate the appearance of iron-loaded macrophages at chronic ischemic lesions with effects on relaxivity (Weber et al. 2005). Since areas of selective neuronal necrosis frequently appear normal (and therefore might be missed) on conventional T1-w and T2- w MRI, application of T2*-w sequences could be a way to reveal inflammatory changes involving iron deposition in these ischemic lesions and facilitate their detection.
Recent fast and quantitative relaxation time studies led to new observations regarding relaxivity parameters after MCAO: within minutes after occlusion a decrease in T2 and an increase in T1 were observed at 8.5 T by Calamante and colleagues (1999), bringing up other causes of relax-
140 |
S. Wegener et al. |
ivity changes, such as flow effects and the amount of oxyand deoxyhemoglobin (deoxyhemoglobin accumulates) in tissue after ischemia. Support for a region-specific lesion evolution, in analogy to pMCAO, was also raised for transient occlusion models (Dijkhuizen et al. 1998).
8.2.2.3
Relaxation Time Changes and Function
In transient MCAO models, T2 relaxation time values and lesion sizes based on T2 changes have been shown to correlate to somatosensory test scores at different time points (Palmer et al. 2001; Virley et al. 2000). This bears great clinical relevance, because the alleviation of a patient’s functional deficits is the primary motivation of experimental stroke studies. However, reliable prediction of functional impairment by MRI is not undisputed. We noted positive striatal T2-w MRI findings in the absence of functional deficits and concluded dissociation between these two diagnostic variables in certain stroke patterns (Wegener et al. 2005).
8.3
Translation of Experimental Results to Human Stroke
Results obtained by MRI and MRS in the setting of experimental stroke have to be translated to human brain ischemia in order to apply new knowledge to clinically important situations. This translation has to take into account that the human cortex is much more complex (e.g., number of gyri, cytoarchitecture of cortical areas etc.) compared to rodent brain or brains of other animal species. There are also considerable differences in the density of neurons per tissue volume and in the vascular anatomy that provides collateral circulation on different levels of the brain-supplying arteries in the case of obstructed perfusion. Animal experiments are frequently carried out in healthy adults whereas stroke patients often suffer from comorbidity (e.g., hypertension, diabetes mellitus) and show signs of chronic and widespread arteriosclerotic changes in various vascular territories including the brain and heart. Therefore, a larger variability of the temporal profile and magnitude of changes visible on MRI may be expected in human stroke pathology.
8.3.1
Correlation of MRI Changes to Human Brain Pathology
In the 1970s and 1980s, many investigations addressed the histopathological changes associated with stroke in man. The histological assessments aimed to characterize the age of recent brain infarcts (Chuaqui and Tapia 1993), to quantify the distribution and frequency of microthromboemboli that were seen also contralaterally to the main site of infarction (Heye and Cervos-Navarro 1996) and to correlate brain pathology to imaging results (Parisi et al. 1988; Nedergaard et al. 1986). A stroke case was reported that showed hyperdensity within the infarct on a second CT scan taken 18 days after the insult. Autopsy revealed no hemorrhage as suspected, but early calcification of infarcted regions (Parisi et al. 1988). A small, but distinct transitional zone between infarct and surrounding unlesioned tissue was described in which necrotic neurons were seen comprising a rim of maximal 10 mm width (Torvik and Svindland 1986). This infarct borderzone was thought to represent regions that had suffered from a lesser degree of ischemia compared to more centrally located infarct areas. The direct comparison of CT findings, tomographic measurement of CBF and neuropathological sections was performed in one case of a small old brain infarct (Nedergaard et al. 1986). A peri-lesional reduction of CBF was described although peri-infarct neuronal density seemed intact.
With the clinical availability of MRI comparisons have been drawn between CT and MRI findings (Barber et al. 1999; Kucinski et al. 2002; Saur et al. 2003; Wardlaw et al. 2004). However, direct comparisons between MRI changes and human brain pathology are lacking. To date, clinicians and researcher take it for granted that hyperintensity on T2-weighted MRI (and/or hypointensity in T1-weighted images) in the chronic phase of stroke would represent destroyed tissue. However, there is no correlative proof of this assumption to the best of our knowledge. There may be good reasons to assume such a relationship, but it remains unclear from which time point post-insult onward this could be valid. Also, it remains to be shown by correlative autopsy studies whether reperfusion alters the correlation of MRI findings to histological changes. It may be expected from animal studies that early reperfusion would reverse by part histological changes, thereby increasing the percentage of scattered neuronal injury in borderzone regions (Back et al. 2002).
Ischemic Edema and Necrosis |
141 |
8.3.2
Temporal Profile of Blood–Brain Barrier Disruption
Several investigators have described the time course of contrast enhancement with gadolinium chelate in patients with ischemic stroke (Crain et al. 1991; Elster 1991; Essig et al. 1996; Karonen et al. 2001; Vo et al. 2003). Contrast-enhanced MRI on days 1, 2 and 7 post-stroke revealed two different patterns, namely intravascular and parenchymal enhancement of the contrast agent. Whereas intravascular enhancement in the infarcted area was detected in 78% of the cases on day 1 and in 30% of cases at 1 week, parenchymal enhancement was observed with increasing frequency over 7 days (Karonen et al. 2001).
The pattern of intravascular enhancement was only seen in larger territorial infarcts that involved regions with good collateral supply, not in regions that are supplied by deep perforating end arteries (Elster 1991). The presence of intravascular enhancement over a larger area than the infarcted core (as seen on DWI) on the first day did not predict infarct growth (Karonen et al. 2001). It is widely accepted that intravascular contrast enhancement is caused by decreased blood flow in arteries surrounding the ischemic tissue and resulting in decreased flow void as a sign of acute ischemia (Essig et al. 1996). Local vasodilation may also contribute to this effect.
Of greater importance for the assessment of the disturbed BBB are the patterns of parenchymal contrast enhancement. CT studies showed that parenchymal enhancement is commonly seen 2–4 weeks after stroke, sometimes already during the first week (Norton et al. 1978). The higher spatial resolution and sensitivity of contrast-enhanced MRI enabled the detailed study of different forms of contrast enhancement during the acute phase of stroke. Disruption of the BBB could be visualized by leakage of contrast material into the brain parenchyma in 26% (day 1), in 56% (day 2) and in 100% of stroke cases at 1 week (Karonen et al. 2001). The changes observed increased not only with regard to their incidence, but also with regard to intensity of enhancement. In a recent MRI study, 3 of 22 stroke patients showed signs of ischemic tissue enhancement within 5 h of symptom onset (Vo et al. 2003). Interestingly, two of the three patients developed large symptomatic hemorrhage after thrombolysis with tissue plasminogen activator. To compare experimental data, breakdown of the BBB could be shown in about half of animals subjected to embolic MCA occlusion and investigated by contrast-enhanced T1-w imag-
ing 3 h following the insult (Neumann-Haefelin et al. 2002). The detection of disrupted BBB prior to thrombolysis predicted the hemorrhagic transformation of infarcts following tPA therapy in those animals. It seems as if very early parenchymal enhancement may be a predictor of increased risk for subsequent symptomatic hemorrhage after thrombolytic therapy, but this notion needs further confirmation.
Also technical aspects may contribute to the variable incidence of parenchymal enhancement in acute human stroke. With double dose contrast medium and a time lag between injection and imaging, every fourth stroke patient showed tissue enhancement within 24 h of stroke onset (Karonen et al. 2001). Widespread parenchymal enhancement in T1-w images seems to gradually develop over the first week when simultaneously the diffusion changes tend to pseudonormalize. Without precise clinical history confounding with tumor enhancement may occur and should be ruled out by observation of the time profile of MR contrast enhancement and DWI.
To summarize, BBB disruption occurs in humans at earlier time points than previously believed, develops progressively over the initial 7 days and, probably, is more dominant in stroke cases of permanent ischemia. It should be regarded as a key event for the development of vasogenic edema.
8.3.3
Temporal Profile of Ischemic Brain Edema
As reviewed in Chap. 4, the ischemic brain edema is a mixture of cytotoxic and vasogenic edema elements. Whereas the cytotoxic edema is not associated with a marked net increase in brain water content, disruption of the BBB triggers the vasogenic component of ischemic edema formation. This involves a gradual increase in brain water content. Depending on the magnitude of the territory affected, edema formation leads to focal occupation of space. The narrowing of CSF-containing compartments of the brain (e.g., ventricles, basal cisterns) adjacent to ischemic lesions is a well recognized sign of this process visible on CT and MR scans. The exact time course of edema formation in large brain infarcts of rats has been determined by MRI showing that edema peaks at 24 h post-occlusion (Hofmeijer et al. 2004). MR studies with quantitative assessment of ischemic edema formation in humans are lacking. However, it is clinically well established that edema formation in territorial brain infarcts peaks
142 |
S. Wegener et al. |
between 3–5 days post-stroke and can be readily detected by MRI.
The development of “malignant” middle cerebral artery infarction associated with a 80% mortality can be regarded as an extreme case of ischemic edema progression. The intracranial space is surrounded by tight bone structures that do not permit expansion, and contains three compartments: brain, blood and CSF (Monro-Kellie doctrine) (Mokri 2001). Since blood and CSF are non-compressible liquids, the volume increase of brain can be compensated for by narrowing of CSF containing spaces. But when those spaces are pressed out, further volume increases lead directly to increased intracranial pressure (ICP) finally resulting in herniation of brain and brain stem compression. Mostly due to the proximal obstruction of the MCA or the carotid T-branch, the occurrence of malignant MCA infarction can be predicted by using quantitative analysis of early DWI and PI. As strong MRI-based predictors the following items were identified: ADC lesion size > 82 ml; severe perfusion deficit size > 162 ml (defined by increases in time-to-peak time > 4 s); low ADC in the infarct core (< 300 m2/s), and relatively small diffusion-perfusion mismatch area (Thomalla et al. 2003). We may deduce that the larger and more severe the perfusion deficit is, the more pronounced the disruption of the BBB and subsequent vasogenic edema formation. As a consequence, midline shift of brain occurs as an important indicator of significant hemispheric swelling. In a rat model of malignant MCA infarction, the drop of contralateral (contralesional) blood flow was observed upon the peak of midline shift at 24 h post-occlusion (Hofmeijer et al. 2004). Therefore, formation of ischemic edema is always associated with compensatory processes that try to minimize an increase in ICP on the expense of the blood or CSF containing compartments. Compression of the capillary bed or larger brain vessels (that both lead to reduced CBF) are sequelae of focal brain edema. In order to interact with this type of pathology, surgical procedures like hemicraniectomy have been performed and been proven useful in experimental settings (Doerfler et al. 1996) and in humans (Schwab et al. 1998).
8.3.4
Probability Approach to Define Irreversible Damage
We have seen that MR parameters like T1, T2, proton density, diffusion-weighting or apparent diffusion
coefficient, and perfusion signals all follow different time profiles of change that reflect different aspects of ischemic injury. Histological correlations are only available from animal experimentation confirming those differential profiles (Helpern et al. 1993). It became clear that there is not one single MR marker specific for tissue necrosis valid at all time points after stroke (see Chaps. 4 and 7). Especially after reversible ischemia, whether prompted by therapy or occurring spontaneously, MRI reveals complicated signal changes that may involve partial reversal as well as the eventual secondary appearance of injury visible on T2-w or DWI. Also, infarct growth as a regular phenomenon of developing territorial stroke (Baird et al. 1997) complicates the prediction of outcome by using early MRI measured within the first hours after onset of symptoms.
If we put all this information together it is conceivable to choose a multiparametric MRI approach in order to predict irreversible damage on the basis of probabilities of various MR signal changes. The simplest strategy would be to start with one MRI modality and look for tissue outcome subsequently. Oppenheim et al. (2001) provide such an approach for the early measurement of ADC within 6 h of stroke onset. Follow-up MRI was performed between day 2 and 4 using fluid attenuated inversion recovery (FLAIR) images to assess final infarct volumes. The authors showed that ADC values gradually increased from the infarct core to the periphery of the ischemic lesion. There were distinct significant differences in mean ADC values as measured within the initial DWI hyperintense lesion (660 m2/s), within the infarct growth area (780 m2/s), and in the oligemic area that remained viable despite initially reduced perfusion (820 m2/s). The latter values were nearly identical to contralateral normal ADC. Of the total cohort of 48 patients, 14 patients had an apparent infarct growth, 29 showed a stable lesion, and the remaining five patients had a partially reversible lesion. Tissue damage could be predicted if the initial ADC was < 750 m2/s, if relative ADC was < 0.91, if local CBF was < 37 ml/100 g/min or if mean transit time MTT was > 16.4 s (Oppenheim et al. 2001) (Fig. 8.4). On the basis of the absolute or relative ADC threshold values, 88% and 95% of the final damage could be correctly predicted, respectively. In this study, ADC-based prediction was more accurate and robust than prediction based on hemodynamic parameters.
A change in the perfusion state of ischemic tissue may alter its response to ischemia as shown previously in this and other chapters (see Chaps. 4, 6
Ischemic Edema and Necrosis |
143 |
Initial DWI |
Initial apMTT map |
Follow-up FLAIR |
|
|
a |
b |
c |
Initial ADC map
DWI 3D ROI
IGR 3D ROI
OLI 3D ROI
d |
e |
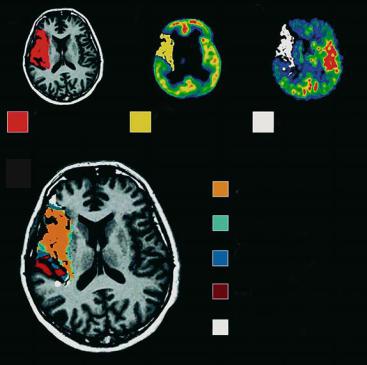
Fig. 8.4a-e. A 4-h post-onset MRI (a, b, and d) and 3-day follow-up FLAIR (c) in a patient with acute right MCA infarction. Initially, the area of reduced perfusion on the apparent mean transit time map (apMTT, b) was larger than the DWI hyperintensity (a) and larger than the final infarct on follow-up FLAIR (c). The large perfusion-diffusion mismatch was divided into an area showing infarct growth (IGR) and an area with oligemia (OLI) and copied onto the initial ADC map (d, e). [Reproduced with permission from Oppenheim et al. (2001)]
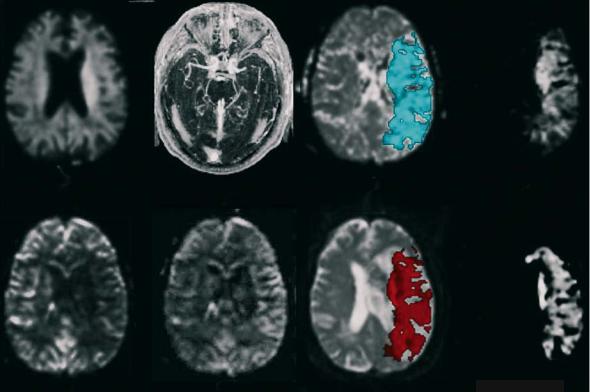
and 7). This is particularly true if reperfusion is initiated rapidly by thrombolytic therapy. Therefore, in an alternative approach both data from DWI and PI have been used to model and estimate stroke evolution (Rose et al. 2001). A novel automated strategy for predicting infarct development was created the validity of which was tested on novel patient data. Regions-of-interest (ROIs) defining the initial diffusion lesion and tissue with abnormal hemodynamic function as defined by the mean transit time abnormality were automatically extracted from DWI/PI maps. Quantitative measures of cerebral blood flow (CBF) and volume (CBV) along with ratio measures defined relative to the contralateral hemisphere (rCBF and rCBV) were calculated for the MTT ROIs (Fig. 8.5). A parametric normal classifier algorithm incorporating these measures was used to predict infarct growth or lesion reversal. The mean rCBF and rCBV values for eventually
infarcted MTT tissue were 0.70 and 1.20, respectively. For recovered tissue the mean values were 0.99 (rCBF) and 1.87 (rCBV), respectively (Rose et al. 2001). Both measures were significantly different in these two regions. Mean absolute measure of CBF for the total infarcted territory was 34 ml/100 g/min and for recovered MTT tissue 42 ml/100 g/min, also being significantly different. Those CBF values correspond to 58% and 71% of control. When testing novel patient data, a sensitivity of 72% and a specificity of 97% was observed.
In this study, the authors state that optimal predictive efficiency was achieved if an eight-dimen- sional model was applied utilizing the metrics of rDWI, DWI, rMTT, MTT, rCBF, CBF, rCBV and CBV (Rose et al. 2001). A quantitative diffusion measure like ADC was not applied and may have further improved prediction if we regard the findings of Oppenheim et al. (2001) as shown above.
144 |
S. Wegener et al. |
a |
b |
c |
d |
e |
f |
g |
h |
Fig. 8.5a-h. Diffusion and perfusion images acquired from a stroke patient 2 h after onset of symptoms. Top, left to right, (a) the DWI scan showing a poorly defined diffusion lesion in the deep white matter in the left hemisphere, (b) the MR angiography showing occlusion of the left middle cerebral artery, (c) the mean transit time (MTT) map with the extracted MTT mask given in blue and (d) the composite MTT map. Bottom left to right, (e) cerebral blood flow map, (f) cerebral blood volume map, (g) the follow-up T2-weighted scan with predicted lesion colored red and (h) the final lesion volume derived by subtraction of the initial T2 image from the follow-up scan. [Reproduced with permission from Rose et al. (2001)]
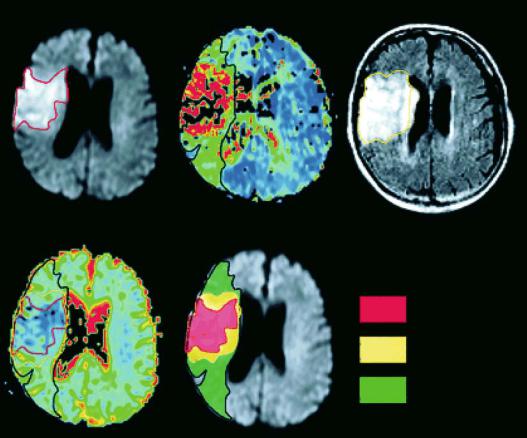
Finally, we would like to draw attention to another approach combining MRI and positron emission tomography (PET) technologies. Heiss et al. (2001) investigated ten acute hemispheric stroke patients by early (within 12 h) PET measurements of CBF and labeled flumazenil (FMZ) that binds as ligand to benzodiazepine receptors and serves as a marker for neuronal integrity (Heiss et al. 2001). Morphological outcome was defined by late T1-w MRI 3 weeks post-insult. ROIs were placed on co-registered maps of CBF, FMZ binding, and T1-w images to identify various subcompartments: a 55% portion of the final infarct showed critically decreased FMZ binding that predicted necrosis. In 21% of the final infarct, CBF was in the penumbral range (< 14 ml/100 g/ min) and FMZ binding above the critical threshold of irreversible damage. Only 13% of the final infarct exhibited neuronal integrity and CBF values above the penumbral range (Heiss et al. 2001) (Fig. 8.6).
Therefore, most of the final infarct is already irreversibly damaged at the time of the first evaluation
(i.e., within 12 h after symptom onset). A much smaller portion is still viable but suffers from insufficient blood supply which may be salvaged by effective reperfusion. Only an even smaller subarea is both viable and sufficiently perfused, but eventually becomes necrotic, mainly owing to delayed mechanisms. It represents the target for neuroprotective drugs or other means that prevent secondary damage.
8.4 Conclusions
Animal studies have substantially added to our understanding of the creation and development of vasogenic edema and necrosis after stroke onset. T2 has emerged as the most commonly applied MR parameter to study this aspect of infarct evolution in animal as well as in human stroke (Warach 2001). Although MRI monitoring of vasogenic edema is
Ischemic Edema and Necrosis
a |
b |
c |
|
|
|
final infarct |
FMZ ≤ 3.4 |
CBF < 14.1 |
d
infarct + FMZ ≤ 3.4 + CBF < 14.1
infarct + FMZ ≤ 3.4
infarct + CBF < 14.1
infarct
no infarct + CBF < 14.1
145
Fig. 8.6a-d. Various subareas within and outside of the final brain infarction as determined by PET measurements of CBF and flumazenil (FMZ) binding on benzodiazepine receptors: extension of final infarct as seen on MRI 3 weeks post-insult (a); subarea with severely decreased FMZ binding (b); subarea with CBF < 14 ml/100 g/min; combination of (a), (b) and (c) showing infarct subareas with decreased FMZ binding and reduced CBF in relation to final infarction. [Reproduced with permission from Heiss et al. (2001)]
possible, there are still open questions as concerns the conclusions about functional and tissue status that can really be drawn from MRI for the individual patient. Multiparametric MRI approaches (e.g., combined diffusionand perfusion-weighted imaging) can be expected to greatly improve the diagnostic value of the method by modeling and predicting infarct evolution.
References
Back T, Schüler OG, Otto D, Culmsee C, Plesnila N, Krieglstein J, Oertel WH, Baethmann A (2002) Early versus delayed thrombolysis in embolic stroke: effects on blood flow, DC potential and infarct morphology. In: Krieglstein J, Klumpp S (eds) Pharmacology of cerebral ischemia. MedPharm Scientific Publishers, Stuttgart, pp 159–169
Baird AE, Benfield A, Schlaug G, Siewert B, Lövblad K-O, Edelman RR, Warach S (1997) Enlargement of human cerebral ischemic lesion volumes measured by diffusion-weighted magnetic resonance imaging. Ann Neurol 41:581–589
Bakay L, Kurland RJ, Parrish RG, Lee JC, Peng RJ, Bartkowski HM (1975) Nuclear magnetic resonance studies in normal and edematous brain tissue. Exp Brain Res 23:241–248
Barber PA, Darby DG, Desmond PM, Gerraty RP, Yang Q, Li T, Jolley D, Donnan GA, Tress BM, Davis SM (1999) Identification of major ischemic change. Diffusion-weighted imaging versus computed tomography. Stroke 30:2059–2065
Barone FC, Clark RK, Feuerstein G, Lenkinski RE, Sarkar SK (1991) Quantitative comparison of magnetic resonance imaging (MRI) and histologic analyses of focal ischemic damage in the rat. Brain Res Bull 26:285–291
Belayev L, Busto R, Zhao W, Ginsberg MD (1996) Quantitative evaluation of blood–brain barrier permeability following middle cerebral artery occlusion in rats. Brain Res 739:88–96
Bose B, Jones SC, Lorig R, Friel HT, Weinstein M, Little JR (1988) Evolving focal cerebral ischemia in cats: spatial correlation of nuclear magnetic resonance imaging, cerebral blood flow, tetrazolium staining, and histopathology. Stroke 19:28–37
Brant-Zawadzki M, Pereira B, Weinstein P, Moore S, Kucharczyk W, Berry I, McNamara M, Derugin N (1986) MR imaging of acute experimental ischemia in cats. Am J Neuroradiol 7:7–11
Calamante F, Lythgoe MF, Pell GS, Thomas DL, King MD, Busza AL, Sotak CH, Williams SR, Ordidge RJ, Gadian DG (1999) Early changes in water diffusion, perfusion, T1, and T2 during focal cerebral ischemia in the rat studied at 8.5 T. Magn Reson Med 41:479–485
Chuaqui R, Tapia J (1993) Histologic assessment of the age of recent brain infarcts in man. J Neuropathol Exp Neurol 52:481–489
Clark RK, Lee EV, Fish CJ, White RF, Price WJ, Jonak ZL, Feuerstein GZ, Barone FC (1993) Development of tissue damage, inflammation and resolution following stroke: an immunohistochemical and quantitative planimetric study. Brain Res Bull 31:565–572
Crain MR, Yuh WT, Greene GM, Loes DJ, Ryals TJ, Sato Y, Hart MN (1991) Cerebral ischemia: evaluation with contrastenhanced MR imaging. Am J Neuroradiol 12:631–639
146
Dijkhuizen RM, Nicolay K (2003) Magnetic resonance imaging in experimental models of brain disorders. J Cereb Blood Flow Metab 23:1383–1402
Dijkhuizen RM, Knollema S, van der Worp HB, Ter Horst GJ, De Wildt DJ, Berkelbach van der Sprenkel JW, Tulleken KA, Nicolay K (1998) Dynamics of cerebral tissue injury and perfusion after temporary hypoxia-ischemia in the rat: evidence for region-specific sensitivity and delayed damage. Stroke 29:695–704
Dirnagl U, Iadecola C, Moskowitz MA (1999) Pathobiology of ischaemic stroke: an integrated view. Trends Neurosci 22:391–397
Doerfler A, Forsting M, Reith W, Staff C, Heiland S, Schabitz WR, von Kummer R, Hacke W, Sartor K (1996) Decompressive craniectomy in a rat model of “malignant” cerebral hemispheric stroke: experimental support for an aggressive therapeutic approach. J Neurosurg 85:853–859
Elster AD (1991) MR contrast enhancement in brainstem and deep cerebral infarction. Am J Neuroradiol 12:1127–1132 Endres M, Dirnagl U (2002) Ischemia and stroke. Adv Exp Med
Biol 513:455–473
Essig M, von Kummer R, Egelhof T, Winter R, Sartor K (1996) Vascular MR contrast enhancement in cerebrovascular disease. Am J Neuroradiol 17:887–894
Ewing JR, Jiang Q, Boska M, Zhang ZG, Brown SL, Li GH, Divine GW, Chopp M (1999) T1 and magnetization transfer at 7 Tesla in acute ischemic infarct in the rat. Magn Reson Med 41:696–705
Garcia JH, Yoshida Y, Chen H, Li Y, Zhang ZG, Lian J, Chen S, Chopp M (1993) Progression from ischemic injury to infarct following middle cerebral artery occlusion in the rat. Am J Pathol 142:623–635
Garcia JH, Lassen NA, Weiller C, Sperling B, Nakagawara J (1996) Ischemic stroke and incomplete infarction. Stroke 27:761–765
Go KG (1997) The normal and pathological physiology of brain water. Adv Tech Stand Neurosurg 23:47–142
Hata R, Maeda K, Hermann D, Mies G, Hossmann KA (2000) Evolution of brain infarction after transient focal cerebral ischemia in mice. J Cereb Blood Flow Metab 20:937–946
Hatashita S, Hoff JT (1990) Brain edema and cerebrovascular permeability during cerebral ischemia in rats. Stroke 21:582–588
Heiss WD, Kracht LW, Thiel A, Grond M, Pawlik G (2001) Penumbral probability thresholds of cortical flumazenil binding and blood flow predicting tissue outcome in patients with cerebral ischaemia. Brain 124:20–29
Helpern JA, Dereski MO, Knight RA, Ordidge RJ, Chopp M, Qing ZX (1993) Histopathological correlations of nuclear magnetic resonance imaging parameters in experimental cerebral ischemia. Magn Reson Imaging 11:241–246
Heye N, Cervos-Navarro J (1996) Microthromboemboli in acute infarcts: analysis of 40 autopsy cases. Stroke 27:431–434 Hoehn-Berlage M, Eis M, Back T, Kohno K, Yamashita K (1995)
Changes of relaxation times (T1, T2) and apparent diffusion coefficient after permanent middle cerebral artery occlusion in the rat: temporal evolution, regional extent, and comparison with histology. Magn Reson Med 34:824–834
Hofmeijer J, Veldhuis WB, Schepers J, Nicolay K, Kappelle LJ, Bar PR, van der Worp HB (2004) The time course of ischemic damage and cerebral perfusion in a rat model of space-occupying cerebral infarction. Brain Res 1013:74–82
S. Wegener et al.
Horikawa Y, Naruse S, Tanaka C, Hirakawa K, Nishikawa H (1986) Proton NMR relaxation times in ischemic brain edema. Stroke 17:1149–1152
Hossmann KA (1998) Experimental models for the investigation of brain ischemia. Cardiovasc Res 39:106–120
Huang ZG, Xue D, Preston E, Karbalai H, Buchan AM (1999) Biphasic opening of the blood–brain barrier following transient focal ischemia: effects of hypothermia. Can J Neurol Sci 26:298–304
Ishii H, Arai T, Morikawa S, Inubushi T, Tooyama I, Kimura H, Mori K (1998) Evaluation of focal cerebral ischemia in rats by magnetic resonance imaging and immunohistochemical analyses. J Cereb Blood Flow Metab 18:931–934
Karonen JO, Partanen PL, Vanninen RL, Vainio PA, Aronen HJ (2001) Evolution of MR contrast enhancement patterns during the first week after acute ischemic stroke. Am J Neuroradiol 22:103–111
Kavec M, Grohn OHJ, Kettunen MI, Silvennoinen MJ, Garwood M, Kauppinen RA (2004) Acute cerebral ischemia in rats studied by Carr-Purcell spin-echo magnetic resonance imaging: assessment of blood oxygenation level-dependent and tissue effects on the transverse relaxation. Magn Reson Med 51:1138-1146
Klatzo I (1967) Presidental address. Neuropathological aspects of brain edema. J Neuropathol Exp Neurol 26:1–14
Knight RA, Ordidge RJ, Helpern JA, Chopp M, Rodolosi LC, Peck D (1991) Temporal evolution of ischemic damage in rat brain measured by proton nuclear magnetic resonance imaging. Stroke 22:802–808
Knight RA, Dereski MO, Helpern JA, Ordidge RJ, Chopp M (1994) Magnetic resonance imaging assessment of evolving focal cerebral ischemia. Comparison with histopathology in rats. Stroke 25:1252–1261
Kucinski T, Vaterlein O, Glauche V, Fiehler J, Klotz E, Eckert B, Koch C, Rother J, Zeumer H (2002) Correlation of apparent diffusion coefficient and computed tomography density in acute ischemic stroke. Stroke 33:1786–1791
Kuroiwa T, Ting P, Martinez H, Klatzo I (1985) The biphasic opening of the blood-brain barrier to proteins following temporary middle cerebral artery occlusion. Acta Neuropathol (Berl) 68:122–129
Kuroiwa T, Ueki M, Chen Q, Ichinose S, Okeda R (1994a) Is the swelling in brain edema isotropic or anisotropic? Acta Neurochir Suppl (Wien) 60:155–157
Kuroiwa T, Ueki M, Chen Q, Suemasu H, Taniguchi I, Okeda R (1994b) Biomechanical characteristics of brain edema: the difference between vasogenic-type and cytotoxic-type edema. Acta Neurochir Suppl (Wien) 60:158–161
Li F, Liu KF, Silva MD, Omae T, Sotak CH, Fenstermacher JD, Fisher M, Hsu CY, Lin W (2000) Transient and permanent resolution of ischemic lesions on diffusion-weighted imaging after brief periods of focal ischemia in rats : correlation with histopathology. Stroke 31:946–954
Lin SP, Schmidt RE, McKinstry RC, Ackerman JJ, Neil JJ (2002a) Investigation of mechanisms underlying transient T2 normalization in longitudinal studies of ischemic stroke. J Magn Reson Imaging 15:130–136
Lin TN, Sun SW, Cheung WM, Li F, Chang C (2002b) Dynamic changes in cerebral blood flow and angiogenesis after transient focal cerebral ischemia in rats. Evaluation with serial magnetic resonance imaging. Stroke 33:2985–2991
Loubinoux I, Volk A, Borredon J, Guirimand S, Tiffon B, Seylaz
Ischemic Edema and Necrosis
J, Meric P (1997) Spreading of vasogenic edema and cytotoxic edema assessed by quantitative diffusion and T2 magnetic resonance imaging. Stroke 28:419-426; discussion 426–417
Mokri B (2001) The Monro-Kellie hypothesis: applications in CSF volume depletion. Neurology 56:1746–1748
Naruse S, Horikawa Y, Tanaka C, Hirakawa K, Nishikawa H, Yoshizaki K (1982) Proton nuclear magnetic resonance studies on brain edema. J Neurosurg 56:747–752
Nedergaard M, Vorstrup S, Astrup J (1986) Cell density in the borderzone around old small human brain infarcts. Stroke 17:1129–1137
Nelson CW, Wei EP, Povlishock JT, Kontos HA, Moskowitz MA (1992) Oxygen radicals in cerebral ischemia. Am J Physiol 263:H1356–1362
Neumann-Haefelin T, Kastrup A, de Crespigny A, Yenari MA, Ringer T, Sun GH, Moseley ME (2000) Serial MRI after transient focal cerebral ischemia in rats: dynamics of tissue injury, blood-brain barrier damage, and edema formation. Stroke 31:1965–1972; discussion 1972–1963
Neumann-Haefelin C, Brinker G, Uhlenkuken U, Pillekamp F, Hossmann KA, Hoehn M (2002) Prediction of hemorrhagic transformation after thrombolytic therapy of clot embolism: an MRI investigation in rat brain. Stroke 33:1392–1398
Neumar RW (2000) Molecular mechanisms of ischemic neuronal injury. Ann Emerg Med 36:483–506
Niessen F, Hilger T, Hoehn M, Hossmann KA (2002) Thrombolytic treatment of clot embolism in rat: comparison of intra-arterial and intravenous application of recombinant tissue plasminogen activator. Stroke 33:2999–3005
Nordborg C, Sokrab TE, Johansson BB (1994) Oedema-related tissue damage after temporary and permanent occlusion of the middle cerebral artery. Neuropathol Appl Neurobiol 20:56–65
Norton GA, Kishore PR, Lin J (1978) CT contrast enhancement in cerebral infarction. Am J Roentgenol 131:881–885
Olah L, Wecker S, Hoehn M (2000) Secondary deterioration of apparent diffusion coefficient after 1-hour transient focal cerebral ischemia in rats. J Cereb Blood Flow Metab 20:1474–1482
Oppenheim C, Grandin C, Samson Y, Smith A, Duprez T, Marsault C, Cosnard G (2001) Is there an apparent diffusion coefficient threshold in predicting tissue viability in hyperacute stroke? Stroke 32:2486–2491
Ordidge RJ, Helpern JA, Knight RA, Qing ZX, Welch KM (1991) Investigation of cerebral ischemia using magnetization transfer contrast (MTC) MR imaging. Magn Reson Imaging 9:895–902
Palmer GC, Peeling J, Corbett D, Del Bigio MR, Hudzik TJ (2001) T2-weighted MRI correlates with long-term histopathology, neurology scores, and skilled motor behavior in a rat stroke model. Ann NY Acad Sci 939:283–296
Parisi J, Place C, Nag S (1988) Calcification in a recent cerebral infarct-radiologic and pathologic correlation. Can J Neurol Sci 15:152–155
Persson L, Hardemark HG, Bolander HG, Hillered L, Olsson Y (1989) Neurologic and neuropathologic outcome after middle cerebral artery occlusion in rats. Stroke 20:641– 645
Pierpaoli C, Righini A, Linfante I, Tao-Cheng JH, Alger JR, Di Chiro G (1993) Histopathologic correlates of abnormal
147
water diffusion in cerebral ischemia: diffusion-weighted MR imaging and light and electron microscopic study. Radiology 189:439–448
Quast MJ, Huang NC, Hillman GR, Kent TA (1993) The evolution of acute stroke recorded by multimodal magnetic resonance imaging. Magn Reson Imaging 11:465–471
Reichardt M (1904) Zur Entstehung des Hirndrucks. Dtsch Z Nervenheilkd 28:306
Rose SE, Chalk JB, Griffin MP, Janke AL, Chen F, McLachan GJ, Peel D, Zelaya FO, Markus HS, Jones DK, Simmons A, O’Sullivan M, Jarosz JM, Strugnell W, Doddrell DM, Semple J (2001) MRI based diffusion and perfusion predictive model to estimate stroke evolution. Magn Reson Imaging 19:1043–1053
Rosenberg GA, Navratil M, Barone F, Feuerstein G (1996) Proteolytic cascade enzymes increase in focal cerebral ischemia in rat. J Cereb Blood Flow Metab 16:360–366
Rosenberg GA, Estrada EY, Dencoff JE (1998) Matrix metalloproteinases and TIMPs are associated with blood-brain barrier opening after reperfusion in rat brain. Stroke 29:2189–2195
Rubin LL, Staddon JM (1999) The cell biology of the bloodbrain barrier. Annu Rev Neurosci 22:11–28
Runge VM, Price AC, Wehr CJ, Atkinson JB, Tweedle MF (1985) Contrast enhanced MRI. Evaluation of a canine model of osmotic blood-brain barrier disruption. Invest Radiol 20:830–844
Saur D, Kucinski T, Grzyska U, Eckert B, Eggers C, Niesen W, Schoder V, Zeumer H, Weiller C, Rother J (2003) Sensitivity and interrater agreement of CT and diffusion-weighted MR imaging in hyperacute stroke. Am J Neuroradiol 24:878–885
Schuier FJ, Hossmann KA (1980) Experimental brain infarcts in cats. II. Ischemic brain edema. Stroke 11:593–601
Schwab S, Steiner T, Aschoff A, Schwarz S, Steiner HH, Jansen O, Hacke W (1998) Early hemicraniectomy in patients with complete middle cerebral artery infarction. Stroke 29:1888–1893
Snider BJ, Gottron FJ, Choi DW (1999) Apoptosis and necrosis in cerebrovascular disease. Ann NY Acad Sci 893:243–253 Thomalla GJ, Kucinski T, Schoder V, Fiehler J, Knab R, Zeumer H, Weiller C, Rother J (2003) Prediction of malignant middle cerebral artery infarction by early perfusionand diffusion-weighted magnetic resonance imaging. Stroke
34:1892–1899
Torvik A, Svindland A (1986) Is there a transitional zone between brain infarcts and the surrounding brain? A histological study. Acta Neurol Scand 74:365–370
Uyama O, Okamura N, Yanase M, Narita M, Kawabata K, Sugita M (1988) Quantitative evaluation of vascular permeability in the gerbil brain after transient ischemia using Evans blue fluorescence. J Cereb Blood Flow Metab 8:282–284
Van Bruggen N, Roberts TP, Cremer JE (1994) The application of magnetic resonance imaging to the study of experimental cerebral ischaemia. Cerebrovasc Brain Metab Rev 6:180–210
Van Dorsten FA, Olah L, Schwindt W, Grune M, Uhlenkuken U, Pillekamp F, Hossmann KA, Hoehn M (2002) Dynamic changes of ADC, perfusion, and NMR relaxation parameters in transient focal ischemia of rat brain. Magn Reson Med 47:97–104