

Книги по МРТ КТ на английском языке / Magnetic Resonance Imaging in Ischemic Stroke - K Sartor R 252 diger von Kummer Tobias Back
.pdfDisturbed Proton Diffusion |
127 |
of tissue injury is not uniform within DWI lesions (Nicoli et al. 2003).
Clinically, assessment of tissue viability is most important in acute stroke patients who are potential candidates for thrombolysis. In this context, a relatively common problem for stroke physicians is the patient presenting in a time window acceptable for thrombolysis, but with a large diffusion lesion. Is it justified to treat these patients with extensive DWI lesions with thrombolysis? Here, it would be crucial to know the true extent of irreversible tissue damage within the diffusion lesion. However, as mentioned above, assessing tissue viability within DWI lesions and predicting tissue fate is not possible with certainty yet. Nevertheless, several parameters may be taken into consideration to make a rational guess:
(1) time from symptom onset, (2) degree of ADC decline (or the brightness of the DWI signal) and
(3) severity of the perfusion abnormality. For example, the chances of reversing a faint DWI lesion with an ADC decline to 85% 1 h after symptom onset are much better than those of reversing an ADC lesion with reductions to 50%–60% at 5 h after onset. Although MR algorithms for selecting patients for thrombolysis need to be evaluated more systematically in the future, these rough guidelines may already be helpful in current patient management.
7.3.5
DWI as Part of Integrated MR Examinations in Acute Stroke
In addition to DWI, integrated stroke examinations typically consist of perfusion imaging (PI), T2*- or susceptibility-weighted imaging (=bleed screen), T2-weighted imaging and MR angiography. DWI covering the whole brain can be performed in less than 1 min, and complete stroke MRI examinations take about 10–15 min on modern machines.
Although DWI is nearly always used in combination with other sequences, DWI alone will reveal at least one lesion in the majority of acute stroke patients, even in the first hours after symptom onset. A low ADC identifies the acute (and often clinically relevant) lesion and allows differentiation from older infarcts.
Lesion conspicuity is often better on DWI than on ADC maps, which is the reason why DWI images are preferred by many neuroradiologists for clinical image interpretation. DWI alone may be sufficient in most cases, but differentiation from T2 shinethrough effects can be difficult, particularly with
lesions located in white matter. From a practical point of view, primary interpretation of DWI images followed by analysis of ADC maps in cases of doubt is probably the most convenient approach.
DWI has been shown to yield clinically relevant information in a substantial number of patients even at subacute time points (i.e., after the first 6 h), which are not apparent on standard MRI. In a careful study on the additional benefit of DWI over standard MRI, Albers and colleagues (2000) investigated how often the following three combinations of findings, which were viewed as being clinically relevant, occurred in patients imaged between 6 and 48 h after stroke onset: (1) the acute symptomatic lesion could be identified only on DWI and it was in a different vascular territory than expected clinically; (2) DWI alone identified acute ischemic lesions in multiple vascular territories suggestive of a proximal source of embolism; or (3) DWI demonstrated that a lesion, thought to be acute on conventional MRI, was not acute. In this study, DWI demonstrated the symptomatic lesion in a different vascular territory than suspected clinically or by conventional MRI in seven patients (18%) and showed acute lesions in multiple vascular distributions in five patients (13%). In eight patients (20%), DWI clarified that lesions thought to be acute on conventional MRI were actually old. Clearly, although most of the benefit of DWI is believed to be due to the increased sensitivity in the first hours after symptom onset, the information obtained in the subacute period may also change patient management.
7.3.6
DWI Negative Stroke
DWI is a very sensitive technique for the detection of ischemia. However, in a minority of patients presenting with stroke-like deficits, normal DWI scans are obtained, even though the clinical deficits are (still) present. Ay et al. (1999) found DWI negative studies in ~ 3.5% (n = 27/782) of consecutively investigated patients with stroke-like deficits; the best final diagnosis in 63% of these patients was “cerebral vascular event” including both reversible ischemic attacks and stroke.
DWI negative scans can be obtained in one of three pathophysiological situations:
i)Hypoperfusion is present and can be detected by PI, but is not severe enough to cause diffusion changes. This situation represents a lesion that consists of an isolated “mismatch” without
128 |
T. Neumann-Haefelin |
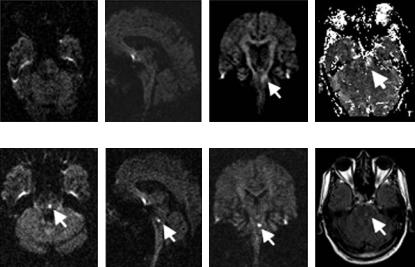
DWI acute |
PI acute |
DWI 6 days |
FLAIR 6 days |
Fig. 7.9. Lacunar brain stem stroke. Typical example of a lacunar brain stem stroke that would be missed if only transverse DWI images were obtained (“DWI negative stroke”). In this case, a faint DWI lesion was seen on coronal sections at the acute time point, but both transverse and sagittal planes did not show an unequivocal lesion. PI, on the other hand, showed a clear-cut perfusion deficit in the brain stem. Follow-up images confirmed a small infarct in the brain stem. (Images were acquired in collaboration with P. Sterzer, Neurology, Frankfurt, and R. du Mesnil de Rochemont, H. Lanfermann, Neuroradiology, Frankfurt)
a diffusion core. Probably, this is the underlying pathophysiology in many patients with TIA (although diffusion changes have also been found in a relevant number of TIA patients [Kidwell et al. 1999]). At the time an “isolated mismatch” is revealed by MRI, symptoms usually already persist for longer than 60 min (which is the maximum duration of TIAs according to a recent definition), and the fate of these regions is hard to predict. Both spontaneous resolution of perfusion changes with tissue recovery as well as progression to infarction may occur.
ii)Hypoperfusion is present, but DWI and PI fail to detect it. This situation is rare and is most often encountered in brain stem lacunar stroke. Due to susceptibility artifact, the brain stem may be difficult to assess on EPI images. Occasionally, coronal DWI images may help to identify small brain stem lacunar strokes that were missed on standard axial sections (pseudo-negative DWI; see Fig. 7.9). These brain stem lacunes may or may not be associated with perfusion deficits on PI.
iii)Finally, the stroke-like deficits are due to a non-ischemic cause (i.e., a stroke mimic, see Chap. 19). In most cases no DWI or PI deficit is seen, although PI deficits may be found in some stroke mimics such as migraine with aura.
Thus, PI is a particularly important tool in DWI negative vascular events and non-ischemic strokelike episodes and may, indeed, clarify the underlying pathology. The majority of patients with DWI negative scans can be classified correctly based on PI as suffering from a cerebrovascular event or from a stroke mimic. Negative DWI and PI studies should intensify the search for non-ischemic conditions. However, in the majority of stroke patients DWI will reveal the clinically relevant lesion and has now become the centerpiece of integrated stroke MRI examinations.
References
Albers GW, Lansberg MG, Norbash AM, Tong DC, O’Brien MW, Woolfenden AR, Marks MP, Moseley ME (2000) Yield of dif- fusion-weighted MRI for detection of potentially relevant findings in stroke patients. Neurology 54:1562–1567
Ay H, Buonanno FS, Rordorf G, Schaefer PW, Schwamm LH, Wu O, Gonzalez RG, Yamada K, Sorensen GA, Koroshetz WJ (1999) Normal diffusion-weighted MRI during stroke-like deficits. Neurology 52:1784–1792
Back T, Hoehn-Berlage M, Kohno K, Hossmann KA (1994) Diffusion nuclear magnetic resonance imaging in experimental stroke. Correlation with cerebral metabolites. Stroke 25:494–500
Disturbed Proton Diffusion
Baird AE, Benfield A, Schlaug G, Siewert B, Lovblad KO, Edelman RR, Warach S (1997) Enlargement of human cerebral ischemic lesion volumes measured by diffusion-weighted magnetic resonance imaging. Ann Neurol 41:581–589
Baird AE, Warach S (1998) Magnetic resonance imaging of acute stroke. J Cereb Blood Flow Metab 18:583–609
Bammer R (2003) Basic principles of diffusion-weighted imaging. Eur J Radiol 45:169–184
Bammer R, Acar B, Moseley ME (2003) In vivo MR tractography using diffusion imaging. Eur J Radiol 45:223–234
Basser PJ (1995) Inferring microstructural features and the physiological state of tissues from diffusion-weighted images. NMR Biomed 8:333–344
Basser PJ, Jones DK (2002) Diffusion-tensor MRI: theory, experimental design and data analysis – a technical review. NMR Biomed 15:456–467
Beauchamp NJ Jr, Barker PB,Wang PY, van Zijl PC (1999) Imaging of acute cerebral ischemia. Radiology 212:307–324 Beaulieu C (2002) The basis of anisotropic water diffusion
in the nervous system – a technical review. NMR Biomed 15:435–455
Benveniste H, Hedlund LW, Johnson GA (1992) Mechanism of detection of acute cerebral ischemia in rats by diffu- sion-weighted magnetic resonance microscopy. Stroke 23:746–754
Busch E, Hoehn-Berlage M, Eis M, Gyngell ML, Hossmann KA (1995) Simultaneous recording of EEG, DC potential and diffusion-weighted NMR imaging during potassium induced cortical spreading depression in rats. NMR Biomed 8:59–64
Busza AL, Allen KL, King MD, van Bruggen N, Williams SR, Gadian DG (1992) Diffusion-weighted imaging studies of cerebral ischemia in gerbils. Potential relevance to energy failure. Stroke 23:1602–1612
Calamante F, Gadian DG, Connelly A (2002) Quantification of perfusion using bolus tracking magnetic resonance imaging in stroke: assumptions, limitations, and potential implications for clinical use. Stroke 33:1146–1151
Darquie A, Poline JB, Poupon C, Saint-Jalmes H, Le Bihan D (2001) Transient decrease in water diffusion observed in human occipital cortex during visual stimulation. Proc Natl Acad Sci USA 98:9391–9395
De Crespigny AJ, Rother J, Beaulieu C, Moseley ME, Hoehn M (1999) Rapid monitoring of diffusion, DC potential, and blood oxygenation changes during global ischemia. Effects of hypoglycemia, hyperglycemia, and TTX. Stroke 30:2212–2222
De Crespigny AJ, Rother J, Beaulieu C, Neumann-Haefelin T, Moseley ME (2001) Comparison of diffusion, blood oxygenation, and blood volume changes during global ischemia in rats. Magn Reson Med 45:10–16
Duong TQ, Ackerman JJ, Ying HS, Neil JJ (1998) Evaluation of extraand intracellular apparent diffusion in normal and globally ischemic rat brain via 19F NMR. Magn Reson Med 40:1–13
Fiehler J, Fiebach JB, Gass A, Hoehn M, Kucinski T, NeumannHaefelin T, Schellinger PD, Siebler M, Villringer A, Rother J (2002a) Diffusion-weighted imaging in acute stroke-a tool of uncertain value? Cerebrovasc Dis 14:187–196
Fiehler J, Foth M, Kucinski T, Knab R, von Bezold M, Weiller C, Zeumer H, Rother J (2002b) Severe ADC decreases do not predict irreversible tissue damage in humans. Stroke 33:79–86
129
Fiehler J, Knudsen K, Kucinski T, Kidwell CS, Alger JR, Thomalla G, Eckert B, Wittkugel O, Weiller C, Zeumer H, Rother J (2004) Predictors of apparent diffusion coefficient normalization in stroke patients. Stroke 35:514–519
Flacke S, Wullner U, Keller E, Hamzei F, Urbach H (2000) Reversible changes in echo planar perfusionand diffu- sion-weighted MRI in status epilepticus. Neuroradiology 42:92–95
Gillard JH, Papadakis NG, Martin K, Price CJ, Warburton EA, Antoun NM, Huang CL, Carpenter TA, Pickard JD (2001) MR diffusion tensor imaging of white matter tract disruption in stroke at 3 T. Br J Radiol 74:642–647
Grandin CB, Duprez TP, Smith AM, Oppenheim C, Peeters A, Robert AR, Cosnard G (2002) Which MR-derived perfusion parameters are the best predictors of infarct growth in hyperacute stroke? Comparative study between relative and quantitative measurements. Radiology 223:361–370
Guadagno JV, Warburton EA, Aigbirhio F, Smielewski P, Fryer T, Day D, Price CJ, Gillard JH, Carpenter A, Baron J-C (2004) Understanding the metabolic counterpart of the DWI lesion in acute ischemic stroke: a combined MR / PET study. Cerebrovasc Dis 17:1127
Gyngell ML, Back T, Hoehn-Berlage M, Kohno K, Hossmann KA (1994) Transient cell depolarization after permanent middle cerebral artery occlusion: an observation by dif- fusion-weighted MRI and localized 1H-MRS. Magn Reson Med 31:337–341
Hasegawa Y, Formato JE, Latour LL, Gutierrez JA, Liu KF, Garcia JH, Sotak CH, Fisher M (1996) Severe transient hypoglycemia causes reversible change in the apparent diffusion coefficient of water. Stroke 27:1648–1655; discussion 1655–1646
Hoehn-Berlage M, Norris DG, Kohno K, Mies G, Leibfritz D, Hossmann KA. (1995) Evolution of regional changes in apparent diffusion coefficient during focal ischemia of rat brain: the relationship of quantitative diffusion NMR imaging to reduction in cerebral blood flow and metabolic disturbances. J Cereb Blood Flow Metab 15:1002–1011
Hossmann K-A, Hoehn-Berlage M (1995) Diffusion and perfusion MR imaging of cerebral ischemia. Cerebrovasc Brain Metab Rev 7:187–217
Huisman TA (2003) Diffusion-weighted imaging: basic concepts and application in cerebral stroke and head trauma. Eur Radiol 13:2283–2297
Jansen O, Schellinger P, Fiebach J, Hacke W, Sartor K (1999) Early recanalisation in acute ischaemic stroke saves tissue at risk defined by MRI Lancet 353:2036–2037
Kidwell CS, Alger JR, di Salle F, Starkman S, Villablanca P, Bentson J, Saver JL (1999) Diffusion MRI in patients with transient ischemic attacks. Stroke 30:1174–1180
Kidwell CS, Saver JL, Mattiello J, Starkman S, Vinuela F, Duckwiler G, Gobin YP, Jahan R, Vespa P, Kalafut M, Alger JR (2000) Thrombolytic reversal of acute human cerebral ischemic injury shown by diffusion/perfusion magnetic resonance imaging. Ann Neurol 47:462–469
Kidwell CS, Saver JL, Starkman S, Duckwiler G, Jahan R, Vespa P, Villablanca JP, Liebeskind DS, Gobin YP, Vinuela F, Alger JR (2002) Late secondary ischemic injury in patients receiving intraarterial thrombolysis. Ann Neurol 52:698–703
Kidwell CS, Alger JR, Saver JL (2003) Beyond mismatch: evolving paradigms in imaging the ischemic penumbra with multimodal magnetic resonance imaging. Stroke 34:2729– 2735
130
Kohno K, Hoehn-Berlage M, Mies G, Back T, Hossmann KA (1995) Relationship between diffusion-weighted MR images, cerebral blood flow, and energy state in experimental brain infarction. Magn Reson Imaging 13:73–80
Lansberg MG, O’Brien MW, Norbash AM, Moseley ME, Morrell M, Albers GW (1999) MRI abnormalities associated with partial status epilepticus. Neurology 52:1021–1027
Lansberg MG, Thijs VN, O’Brien MW, Ali JO, de Crespigny AJ, Tong DC, Moseley ME, Albers GW (2001) Evolution of apparent diffusion coefficient, diffusion-weighted, and T2-weighted signal intensity of acute stroke. AJNR Am J Neuroradiol 22:637–644
Latour LL,Warach S (2002) Cerebral spinal fluid contamination of the measurement of the apparent diffusion coefficient of water in acute stroke. Magn Reson Med 48:478–486
Latour LL, Svoboda K, Mitra PP, Sotak CH (1994) Time-depen- dent diffusion of water in a biological model system. Proc Natl Acad Sci USA 91:1229–1233
Le Bihan D (1995) Molecular diffusion, tissue microdynamics and microstructure. NMR Biomed 8:375–386
Le Bihan D (2003) Looking into the functional architecture of the brain with diffusion MRI. Nat Rev Neurosci 4:469–480 Le Bihan D, van Zijl P (2002) From the diffusion coefficient to
the diffusion tensor. NMR Biomed 15:431–434
Le Bihan D, Mangin JF, Poupon C, Clark CA, Pappata S, Molko N, Chabriat H (2001) Diffusion tensor imaging: concepts and applications. J Magn Reson Imaging 13:534–546
Li F, Han SS, Tatlisumak T, Liu KF, Garcia JH, Sotak CH, Fisher M (1999) Reversal of acute apparent diffusion coefficient abnormalities and delayed neuronal death following transient focal cerebral ischemia in rats. Ann Neurol 46:333– 342
Li F, Liu KF, Silva MD, Omae T, Sotak CH, Fenstermacher JD, Fisher M, Hsu CY, Lin W (2000a) Transient and permanent resolution of ischemic lesions on diffusion-weighted imaging after brief periods of focal ischemia in rats: correlation with histopathology. Stroke 31:946–954
Li F, Silva MD, Sotak CH, Fisher M (2000b) Temporal evolution of ischemic injury evaluated with diffusion-, perfusion-, and T2-weighted MRI. Neurology 54:689–696
Li F, Liu KF, Silva MD, Meng X, Gerriets T, Helmer KG, Fenstermacher JD, Sotak CH, Fisher M (2002) Acute postischemic renormalization of the apparent diffusion coefficient of water is not associated with reversal of astrocytic swelling and neuronal shrinkage in rats. AJNR Am J Neuroradiol 23:180–188
Lie C, Hirsch JG, Rossmanith C, Hennerici MG, Gass A (2004) Clinicotopographical correlation of corticospinal tract stroke: a color-coded diffusion tensor imaging study. Stroke 35:86–92
Lin W, Lee JM, Lee YZ, Vo KD, Pilgram T, Hsu CY (2003) Temporal relationship between apparent diffusion coefficient and absolute measurements of cerebral blood flow in acute stroke patients. Stroke 34:64–70
Marks MP, de CA, Lentz D, Enzmann DR, Albers GW, Moseley ME (1996) Acute and chronic stroke: navigated spin-echo diffusion-weighted MR imaging (published erratum appears in Radiology 1996, 200:289). Radiology 199:403–408
Mori S, van Zijl PC (2002) Fiber tracking: principles and strategies – a technical review. NMR Biomed 15:468–480
Moseley ME, Butts K (1999) Diffusion and perfusion. In: Stark D, Bradley WG (eds) Magnetic resonance imaging. Mosby, St Louis, pp 1515–1538
T. Neumann-Haefelin
Moseley ME, Cohen Y, Mintorovitch J, Chileuitt L, Shimizu H, Kucharczyk J, Wendland MF, Weinstein PR (1990a) Early detection of regional cerebral ischemia in cats: comparison of diffusionand T2-weighted MRI and spectroscopy. Magn Reson Med 14:330–346
Moseley ME, Kucharczyk J, Mintorovitch J, Cohen Y, Kurhanewicz J, Derugin N, Asgari H, Norman D (1990b) Diffusionweighted MR imaging of acute stroke: correlation with T2-weighted and magnetic susceptibility-enhanced MR imaging in cats. AJNR Am J Neuroradiol 11:423–429
Neumann-Haefelin T, Wittsack HJ, Wenserski F, Siebler M, Seitz RJ, Modder U, Freund HJ (1999) Diffusionand per- fusion-weighted MRI: the DWI/PWI mismatch region in acute stroke. Stroke 30:1591–1597
Neumann-Haefelin T, Kastrup A, de Crespigny A, Yenari MA, Ringer T, Sun GH, Moseley ME (2000a) Serial MRI after transient focal cerebral ischemia in rats: dynamics of tissue injury, blood-brain barrier damage, and edema formation. Stroke 31:1965–1973
Neumann-Haefelin T, Moseley ME, Albers GW (2000b) New magnetic resonance imaging methods for cerebrovascular disease: emerging clinical applications. Ann Neurol 47:559–570
Neumann-Haefelin T, Moseley ME (2003) MRI in acute stroke. In: Hennerici M (ed) Imaging in stroke. Remedica, London, pp 43-62
Neumann-Haefelin T, du Mesnil de Rochemont R, Fiebach JB, Gass A, Nolte C, Kucinski T, Rother J, Siebler M, Singer OC, Szabo K, Villringer A, Schellinger PD (2004) Effect of incomplete (spontaneous and postthrombolytic) recanalization after middle cerebral artery occlusion: a magnetic resonance imaging study. Stroke 35:109–114
Nicholson C, Sykova E (1998) Extracellular space structure revealed by diffusion analysis. Trends Neurosci 21:207– 215
Nicolay K, Braun KP, Graaf RA, Dijkhuizen RM, Kruiskamp MJ (2001) Diffusion NMR spectroscopy. NMR Biomed 14:94–111
Nicoli F, Lefur Y, Denis B, Ranjeva JP, Confort-Gouny S, Cozzone PJ (2003) Metabolic counterpart of decreased apparent diffusion coefficient during hyperacute ischemic stroke: a brain proton magnetic resonance spectroscopic imaging study. Stroke 34:e82–e87
Olah L, Wecker S, Hoehn M (2000) Secondary deterioration of apparent diffusion coefficient after 1-hour transient focal cerebral ischemia in rats. J Cereb Blood Flow Metab 20:1474–1482
Olah L, Wecker S, Hoehn M (2001) Relation of apparent diffusion coefficient changes and metabolic disturbances after 1 hour of focal cerebral ischemia and at different reperfusion phases in rats. J Cereb Blood Flow Metab 21:430–439
O’Sullivan M, Summers PE, Jones DK, Jarosz JM, Williams SC, Markus HS (2001) Normal-appearing white matter in ischemic leukoaraiosis: a diffusion tensor MRI study. Neurology 57:2307–2310
O’Sullivan M, Morris RG, Huckstep B, Jones DK, Williams SC, Markus HS (2004) Diffusion tensor MRI correlates with executive dysfunction in patients with ischaemic leukoaraiosis. J Neurol Neurosurg Psychiatry 75:441–447
Pillekamp F, Grune M, Brinker G, Franke C, Uhlenkuken U, Hoehn M, Hossmann K (2001) Magnetic resonance prediction of outcome after thrombolytic treatment. Magn Reson Imaging 19:143–152
Disturbed Proton Diffusion
Prichard JW, Zhong J, Petroff OA, Gore JC (1995) Diffusionweighted NMR imaging changes caused by electrical activation of the brain. NMR Biomed 8:359–364
Ringer TM, Neumann-Haefelin T, Sobel RA, Moseley ME, Yenari MA (2001) Reversal of early diffusion-weighted magnetic resonance imaging abnormalities does not necessarily reflect tissue salvage in experimental cerebral ischemia. Stroke 32:2362–2369
Roberts TP, Rowley HA (2003) Diffusion weighted magnetic resonance imaging in stroke. Eur J Radiol 45:185–194 Rordorf G, Koroshetz WJ, Copen WA, Cramer SC, Schaefer
PW, Budzik RF Jr, Schwamm LH, Buonanno F, Sorensen AG, Gonzalez G (1998) Regional ischemia and ischemic injury in patients with acute middle cerebral artery stroke as defined by early diffusion-weighted and perfusionweighted MRI. Stroke 29:939–943
Rother J, de CA, D’Arceuil H, Iwai K, Moseley ME (1996) Recovery of apparent diffusion coefficient after ischemiainduced spreading depression relates to cerebral perfusion gradient. Stroke 27:980–986
Schellinger PD, Fiebach JB, Jansen O, Ringleb PA, Mohr A, Steiner T, Heiland S, Schwab S, Pohlers O, Ryssel H, Orakcioglu B, Sartor K, Hacke W (2001) Stroke magnetic resonance imaging within 6 hours after onset of hyperacute cerebral ischemia. Ann Neurol 49:460–469
Schlaug G, Siewert B, Benfield A, Edelman RR, Warach S (1997) Time course of the apparent diffusion coefficient (ADC) abnormality in human stroke. Neurology 49:113–119
Silva MD, Omae T, Helmer KG, Li F, Fisher M, Sotak CH (2002) Separating changes in the intraand extracellular water apparent diffusion coefficient following focal cerebral ischemia in the rat brain. Magn Reson Med 48:826–837
Sorensen AG, Buonanno FS, Gonzalez RG, Schwamm LH, Lev MH, Huang-Hellinger FR, Reese TG, Weisskoff RM, Davis TL, Suwanwela N, Can U, Moreira JA, Copen WA, Look RB, Finklestein SP, Rosen BR, Koroshetz WJ (1996) Hyperacute stroke: evaluation with combined multisection diffusionweighted and hemodynamically weighted echo-planar MR imaging. Radiology 199:391–401
Sotak CH (2002) The role of diffusion tensor imaging in the evaluation of ischemic brain injury - a review. NMR Biomed 15:561–569
131
Stejskal EO, Tanner JE (1965) Spin diffusion measurements: spin-echo in the presence of a time dependent field gradient. J Chem Phys 42:288–292
Sykova E, Svoboda J, Polak J, Chvatal A (1994) Extracellular volume fraction and diffusion characteristics during progressive ischemia and terminal anoxia in the spinal cord of the rat. J Cereb Blood Flow Metab 14:301–311
Van der Toorn A, Dijkhuizen RM, Tulleken CA, Nicolay K (1996a) Diffusion of metabolites in normal and ischemic rat brain measured by localized 1H MRS. Magn Reson Med 36:914–922
Van der Toorn A, Sykova E, Dijkhuizen RM,Vorisek I,Vargova L, Skobisova E, van Lookeren Campagne M, Reese T, Nicolay K (1996b) Dynamic changes in water ADC, energy metabolism, extracellular space volume, and tortuosity in neonatal rat brain during global ischemia. Magn Reson Med 36:52–60
Van Gelderen P, de Vleeschouwer MH, DesPres D, Pekar J, van Zijl PC, Moonen CT (1994) Water diffusion and acute stroke. Magn Reson Med 31:154–163
Verheul HB, Balazs R, Berkelbach van der Sprenkel JW, Tulleken CA, Nicolay K, Tamminga KS, van Lookeren Campagne M (1994) Comparison of diffusion-weighted MRI with changes in cell volume in a rat model of brain injury. NMR Biomed 7:96–100
Warach S (2001) Tissue viability thresholds in acute stroke: the 4-factor model. Stroke 32:2460–2461
Warach S, Chien D, Li W, Ronthal M, Edelman RR (1992) Fast magnetic resonance diffusion-weighted imaging of acute human stroke. Neurology 42:1717–1723
Warach S, Gaa J, Siewert B, Wielopolski P, Edelman RR (1995) Acute human stroke studied by whole brain echo planar diffusion-weighted magnetic resonance imaging. Ann Neurol 37:231–241
Warach S, Dashe JF, Edelman RR (1996a) Clinical outcome in ischemic stroke predicted by early diffusion-weighted and perfusion magnetic resonance imaging: a preliminary analysis. J Cereb Blood Flow Metab 16:53–59
Warach S, Mosley M, Sorensen AG, Koroshetz W (1996b) Time course of diffusion imaging abnormalities in human stroke (letter; comment). Stroke 27:1254–1256
Wheatley DN (1985) Mini-review. On the possible importance of an intracellular circulation. Life Sci 36:299–307

Ischemic Edema and Necrosis |
133 |
8Ischemic Edema and Necrosis
Susanne Wegener, Mathias Hoehn, and Tobias Back
CONTENTS
8.1Vasogenic Edema and Necrosis Formation:
Pathophysiology 133
8.1.1The Blood Brain–Barrier and Brain Edema Subtypes 133
8.1.2Vasogenic Edema and Necrosis after Cerebral Ischemia 134
8.1.3Temporal Profile of Vasogenic Edema Formation
|
in Experimental Ischemia 135 |
|
8.1.3.1 |
Permanent Occlusion Models |
135 |
8.1.3.2 |
Transient Occlusion Models |
136 |
8.2Correlation of MRI Parameter Changes
to the Formation of Vasogenic Edema in Animal Models 136
8.2.1MRI Parameters with Sensitivity to Vasogenic
Edema and Necrosis 136
8.2.2MRI Changes Corresponding to Vasogenic Edema
|
after Experimental Brain Ischemia 137 |
|
8.2.2.1 |
Permanent Occlusion Models |
137 |
8.2.2.2 |
Transient Occlusion Models |
139 |
8.2.2.3 |
Relaxation Time Changes and Function 140 |
|
8.3Translation of Experimental Results to Human
Stroke 140
8.3.1Correlation of MRI Changes to Human Brain Pathology 140
8.3.2Temporal Profile of Blood–Brain Barrier
Disruption 141
8.3.3 Temporal Profile of Ischemic Brain Edema 141
8.3.4Probability Approach to Define Irreversible Damage 142
8.4Conclusions 144 References 145
S. Wegener, MD
In-vivo NMR Laboratory, Max Planck Institute for Neurological Research, Gleueler Strasse 50, 50931 Cologne, Germany
M. Hoehn, PhD
In-vivo NMR Laboratory, Max-Planck Institute for Neurological Research, Gleueler Strasse 50, 50931 Cologne, Germany
T. Back, MD
Department of Neurology, University Hospital Mannheim, Ruprecht-Karls University Heidelberg, Theodor-Kutzer-Ufer 1–3, 68167 Mannheim, Germany
8.1
Vasogenic Edema and Necrosis Formation: Pathophysiology
8.1.1
The Blood Brain–Barrier and Brain Edema Subtypes
Ischemic injury of the brain initiates a cascade of events that involves formation of brain edema and culminates in tissue destruction (Endres and Dirnagl 2002). Brain edema is defined as swelling of the brain tissue due to an increase in water content. In 1967, Klatzo classified edema based on the localization and biochemical features of fluid as either cytotoxic (intracellular, plasma ultrafiltrate) or vasogenic (extracellular, plasma filtrate including serum proteins) edema (Klatzo 1967). Disruption of blood flow to the brain results in energy depletion and consecutive ion pump failure at the cell membranes resulting in disturbance of ion and water homeostasis, which in consequence leads to cell swelling (for more details see Chap. 7). This cytotoxic edema develops within minutes after the ischemic onset and has emerged as the hallmark of stroke due to its early detectability in diffusionweighted MRI (DWI).
Vasogenic edema occurs after various brain injuries besides ischemia, such as in trauma, hemorrhage, encephalitis, and tumors. It is preceded by an increase in permeability of the blood–brain barrier (BBB). Specialized endothelial cells located on the luminal side of capillaries constitute the BBB (Go 1997; Rubin and Staddon 1999). These cells are characterized by very few endocytotic vesicles and so called tight junctions, composed of five-layered structures tightly occluding the intercellular clefts. Under normal, physiological conditions, the BBB prevents passage of substances from the blood circulation into the brain, and thereby governs influx and efflux of fluids and solutes between the vascular system and the brain parenchyma. While gases and small (especially lipophilic) molecules pass the
134 |
S. Wegener et al. |
BBB easily, molecules with a molecular weight above 500 Dalton are kept outside the barrier. Some ions and particles needed for cell metabolism, such as glucose, are actively shuttled through the BBB via respective transporters. The amount of water and other molecules crossing the BBB depends on the cerebral blood flow (CBF) and hydrostatic as well as osmotic forces.
8.1.2
Vasogenic Edema and Necrosis after Cerebral Ischemia
After ischemia, the BBB breaks down and plasma constituents enter the brain parenchyma through the opened tight junctions. Up regulation of matrix metalloproteinases (MMPs), zinc-contain- ing enzymes directly degrading components of the vascular basement membrane, and the thrombolytic enzyme endogenous tissue-type plasminogen activator (tPA) appear to be involved in the early steps of BBB opening (Rosenberg et al. 1996; Yepes et al. 2003). The brain tissue, swollen
because of the edema fluid, contains more water with a higher Na+ and a lower K+ ion concentration. Due to the presence of plasma proteins, the edema fluid has a high colloid-oncotic pressure. It spreads within the intercellular tissue space, preferentially along fiber structures in white matter. Unlike the cytotoxic edema, the vasogenic edema distributes anisotropically (i.e., parallel to the fiber tracts) and leads to an increased compliance of edematous white matter, probably the correlate of the moist and soft macroscopic appearance of the “Hirnödem” described by Reichardt in 1904 (Kuroiwa et al. 1994a,b; Reichardt 1904). This excessive extracellular fluid can be cleared by reuptake into capillaries or glial cells, or drained into CSF and the lymphatic system (Klatzo 1967).
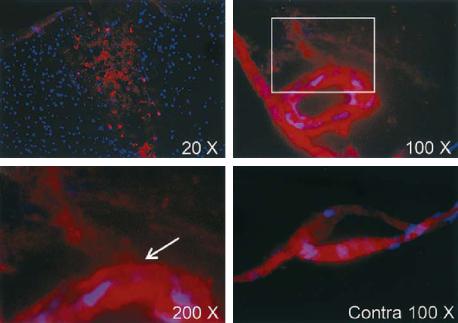
Experimentally, the BBB disruption can be assessed by the administration of dyes (e.g., Evans blue, Fluorescein) or radioactive tracers (e.g., [14C] sucrose) and visualization or measurement of their distribution in the brain parenchyma on tissue sections (Fig. 8.1). To estimate brain water content, the weight of a brain is determined with the “wet-and- dry-weight method”, i.e., weighing the tissue speci-
a |
b |
c |
d |
Fig. 8.1a-d. Evans blue extravasation 6 h after permanent middle cerebral artery occlusion (MCAO) in Sprague-Dawley rats. Evans blue extravasation is shown in red and cell nuclei in blue labeled by 4’-6-diamidino-2-phenylindole (DAPI), a compound that binds to DNA. (a) A low-magnification view of the entire ischemic area. (b) Evans blue extravasation from a vessel located in the area adjacent to the ischemic area. (c) Electronic magnification of the box in (b) (arrow is pointing at a leakage of Evans blue from the vessel). (d) No extravasation of Evans blue is seen in a vessel from the same section seen in (b) and (c) but located in the corresponding region of the contralateral hemisphere Contra, contralateral. [Reproduced with permission from Yepes et al. (2003)]
Ischemic Edema and Necrosis |
135 |
men before and after drying in an oven at 90–100°C (Hatashita and Hoff 1990; Uyama et al. 1988).
When cerebral blood flow drops below a critical threshold for a longer period of time (e.g., 10 ml/100 mg/min for more than 30 min in animal models of cortical ischemia), necrosis is the consequence (Neumar 2000). Necrosis refers to the “accidental” form of cell death. It is characterized by initial cellular and organelle swelling, membrane disruption, and disintegration of nuclear structure and cytoplasmatic organelles, ending up with extrusion of cell contents into the extracellular space. Necrosis develops from 6 h up to 4 days following ischemia and is further aggravated by inflammatory processes such as secretion of toxic substances by activated inflammatory cells and obstruction of microvessels by these cells (Dirnagl et al. 1999; Garcia et al. 1993; Persson et al. 1989) (see Chap. 4). For selective destruction of neurons after mild cerebral ischemia the term “selective neuronal necrosis” has been coined (Garcia et al. 1996), while in pannecrosis all cell types (neuronal, glial, endothelial) are irreversibly damaged.
More recently, apoptosis has been described as a mechanism of cell death, especially after mild ischemia and in the lesion borderzone (Dirnagl et al. 1999; Snider et al. 1999). In this form of programmed cell death cell bodies are phagocytosed by macrophages and therefore do not enter the extracellular space, thus minimizing deleterious effects on surrounding tissue. Both forms of cell death may be found in coexistence.
During the days following the focal ischemic event, macrophages and glial cells infiltrate the lesion. After about 1–2 weeks, a loose connective tissue matrix is formed along the infarct borders. The necrotic cells have completely resolved 2 weeks later, with macrophages remaining in the tissue adjacent to the infarcted area (Clark et al. 1993).
8.1.3
Temporal Profile of Vasogenic Edema Formation in Experimental Ischemia
A number of animal models have been developed to mimic cerebral ischemia experimentally. They can be roughly categorized into global (bilateral arterial occlusion) and focal (unilateral arterial occlusion) cerebral ischemia models. Probably the widest applied method is the middle cerebral artery occlusion (MCAO), performed by transiently blocking the arterial blood flow with a removable thread or
clip, or by permanently occluding the artery (e.g., by ligation or electrical cauterization of the vessel) (Hossmann 1998). Further factors influencing the development of tissue injury are animal strain and age as well as surgical procedure and duration of the ischemic impact.
With respect to brain edema formation, differentiation between transient and permanent vascular occlusion models is very important. In the latter approach blood flow into the ischemic area remains cut off, while reperfusion is restored in the former, similar to the clinical setting of successful thrombolysis or spontaneous reperfusion. Early reperfusion can salvage tissue at risk of infarction (ischemic penumbra). However, when tissue damage has progressed further, reperfusion can have detrimental effects because more water drains from the circulation through the damaged BBB into the already edematous tissue. In consequence, the vasogenic edema develops with a different temporal profile and to a different degree in these cerebral ischemia models.
8.1.3.1
Permanent Occlusion Models
Already 1 h after the onset of permanent ischemia, activity of tPA increases in the ischemic territory, particularly in the perivascular tissue within the penumbra (Yepes et al. 2003). This then activates a cascade of molecular events that finally lead to an increase in permeability of the BBB. In an elaborate study, Hatashita and Hoff (1990) investigated changes in BBB function after permanent ischemia in rats. They found that edema fluid, as estimated by the wet to dry weight method, is significantly elevated already 1 h after MCAO, with an intermittent plateau at day 1, only to rise further to its maximum after 3 days. From there it gradually decreases again. They confirmed earlier findings by Schuier and Hossmann (1980) in the cat MCA occlusion model. It is of importance to note that the early phase of ischemic brain edema is not an isolated shift of water from the extracellular space into neurons. A net uptake of water is observed in brain regions with CBF below 10 ml/100 g/ min. Such a net uptake of water can be regarded as a marker for irreversibly injured brain tissue. Extravasation of the micromolecular dye sodium fluorescein was first observed at 6 h, while Evans blue, a dye that binds to plasma molecules and indicates escape of larger molecules, was first noted
136 |
S. Wegener et al. |
in the extracellular space at 12 h after MCAO. To analyze BBB permeability quantitatively, [I125]- labeled bovine serum albumin (125I-BSA) and [C14]-labeled sucrose (14C-sucrose) were applied, and transfer indices were calculated (radioactivity of brain tissue divided by that of blood). This allowed estimation of serum protein (125I-BSA) or small molecular (14C-sucrose) extravasation. Both transfer indices started to increase 12 h after ischemia onset and reached a maximal value around day 8. These findings indicate that despite an early increase in water content, the BBB remains impermeable to serum proteins for at least several hours after MCAO. Permeability becomes maximal only after the peak of edema fluid levels has already been reached.
8.1.3.2
Transient Occlusion Models
In contrast to the gradually increasing BBB permeability in permanent ischemia, transient MCAO has been reported to result in a biphasic opening of the BBB (Kuroiwa et al. 1985). Kuriowa and colleagues found leakage of Evans blue in cats subjected to 1 h of focal occlusion promptly (within minutes) after reperfusion, but only in animals with a severe CBF reduction during ischemia (CBF below 15 ml/100 g/min) and pronounced increase in blood flow after reperfusion (Kuroiwa et al. 1985). A “refractory period” in which no extravasation of dye was observed, was followed by a second BBB opening at about 5 h after ischemia. Time to barrier opening appears to depend on the duration of vascular occlusion. Other groups suggested other time frames, employing 2-h MCA occlusion [3 h and 48–50 h after reperfusion (Belayev et al. 1996; Rosenberg et al. 1998), or 30 min and 22–48 h after reperfusion (Huang et al. 1999)]. The first phase of BBB disturbance has been ascribed to reactive hyperemia or damage through oxygen free radicals after reperfusion. For the delayed, second phase of BBB disturbance inflammatory processes have been implicated, but mechanisms remain to be elucidated (Kuroiwa et al. 1985; Nelson et al. 1992).
It was noted in spontaneously hypertensive rats, subjected either to permanent or transient (2-h) MCAO that vasogenic edema and gliosis, as visualized immunohistochemically, were more widespread after transient occlusion although infarctions were larger after permanent occlusion (Nordborg et al. 1994).
8.2
Correlation of MRI Parameter Changes to the Formation of Vasogenic Edema in Animal Models
8.2.1
MRI Parameters with Sensitivity to Vasogenic Edema and Necrosis
MRI can provide valuable information on the progression of vasogenic edema and necrosis in the living organism. “Free” and “bound” water (e.g., water in the ventricles vs. water bound to cellular structures) can be discriminated based on different T1 and T2 relaxation times (Bakay et al. 1975; Naruse et al. 1982). Typical T1 and T2 relaxation times of normal rat brain at 4.7 T are 869+145 ms and 72+2 ms (caudate putamen) and 928+117 ms and 73+2 ms (cortex), while more liquid structures such as edematous tissue, cysts or CSF will lead to significantly elevated T1 and T2 relaxation times (Hoehn-Berlage et al. 1995).
In consequence, such increases in free, extracellular water can be picked up on T1and T2-weighted (T1-w, T2-w) images (Dijkhuizen and Nicolay 2003; Horikawa et al. 1986). Proton density images (PD) reflect the concentration of water protons in tissue, and therefore indicate regions with a high water content, such as in edema. When paramagnetic contrast agents such as gadolinium chelates are injected, their T1-shortening effect is used to visualize BBB damage on T1-w MRI: signal enhancement on these images indicates leakage of the tracer into the brain parenchyma (Runge et al. 1985) (Fig. 8.2). Magnetization transfer imaging (MT-MRI) is based on magnetization exchange between “free” and “bound” water protons. The broad resonance of bound protons is saturated using a prolonged offresonance RF pulse, and only the free proton magnetization is observed. The increase in interstitial water and breakdown of macromolecular structures as it occurs in cerebral ischemia with vasogenic edema are characterized by a reduction in the MT ratio (ratio between free and bound proton pools) (Ewing et al. 1999; Ordidge et al. 1991). The reason for only very few MT-MRI studies lies in the required long RF pulse which causes the risk of unacceptably high RF power deposits into the tissue. Diffusionweighted imaging (DWI), the “classical” MR parameter to follow the cytotoxic edema after stroke, may also indicate the areas of vasogenic edema by the increased water diffusivity in the larger pools of free water (Fig. 8.2). These regions display increased
Ischemic Edema and Necrosis |
|
137 |
1 hour |
7 hours |
|
PI |
|
|
|
|
PI |
|
0 |
50000 aU |
ADC |
|
|
|
|
ADC |
|
0 |
1200 µm2/s |
T2 |
|
T2 |
0 |
120 ms |
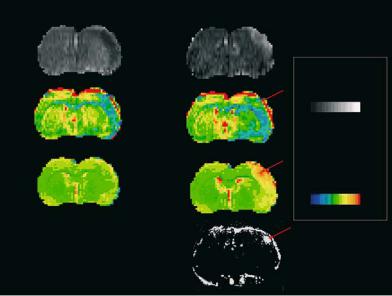
Gd-enhanced T1
Fig. 8.2. Coronal perfusion images (PI) and quantitative ADC and T2 relaxation time maps of rat brain at 1 h after embolic stroke (left column) and 7 h after onset of tPA lysis (right column). Note the perfusion deficit in the early ischemic phase which is reversed into a hyperperfusion by the thrombolytic treatment. The maps of the apparent diffusion coefficient show the lesion as decreased ADC value in the right hemisphere (depicted in blue). The lesion persists despite the successful recanalization and tissue reperfusion. The T2 parameter map is insensitive to the ischemic alteration in the early phase. At later times (7 h after embolic stroke) a clear, pronounced increase in T2 is observed across the ischemic territory (as determined on ADC maps). At 7 h, a subtraction image of T1-weighted images after and before Gd-DTPA application (Gd-enhanced) shows an area of BBB disturbance (arrow) as a strong hyperintensity in the right parietal cortex. Note that this area sticks out in the T2 map with the highest T2 rise (arrow). The same region on the ADC map at the later time point is characterized by a pseudo-normalization (arrow): the increasing water content of the vasogenic edema counteracts the ADC decrease caused by the cytotoxic edema, thus leading to a re-increase from the early ADC minimum
values of the apparent diffusion coefficient (ADC) (please see Chap. 7 for a closer description of DWI). When effects of cytotoxic and vasogenic edema are coexisting (at subacute timepoints), DWI may be less conclusive because of the two counteracting mechanisms (Fig. 8.2).
8.2.2
MRI Changes Corresponding to Vasogenic Edema after Experimental Brain Ischemia
Earliest proof of an ischemic situation on MRI can be obtained within seconds after stroke onset by perfusion imaging (PI), depicting the area of reduced cerebral blood flow (Fig. 8.2; see also Chap. 6). This is followed within minutes by a rapid delineation of the early ischemic injury (cytotoxic edema) on DWI. Focus of this chapter will be on data acquired in animal ischemia models, using PD-w, T1-w, and T2-w MRI, and their correlation with histopathology.
As discussed above, due to the influence of reperfusion, vasogenic edema develops differently in
permanent and transient ischemia models. Therefore, we will also discuss MRI findings in these two models separately (Fig. 8.3).
8.2.2.1
Permanent Occlusion Models
Hoehn-Berlage and colleagues (1995) investigated changes in T1, T2, and proton density in comparison to DWI at an acute time period after permanent occlusion. They demonstrated elevated T1and T2-values in the ischemic area as early as 2 h after permanent MCAO (pMCAO), which continued to rise during the observation period of 7 h, leading to 29±20% (T1) and 51±41% (T2) above control. This was not paralleled by significant changes in PD, although small increases were detectable in individual animals. Together with the early rise in T1 and T2 relaxation times, before Evans blue leakage demonstrates BBB disruption in histological studies, the unchanged PD argues against vasogenic edema as the source of relaxation time increase at this time.