

Книги по МРТ КТ на английском языке / Magnetic Resonance Imaging in Ischemic Stroke - K Sartor R 252 diger von Kummer Tobias Back
.pdf96 |
D. Petersen and S. Gottschalk |
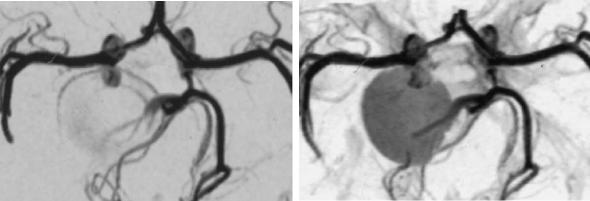
Fig. 5.26a–c. Vasculitis. After an atypical frontal hemorrhage, TOF projections (a,b) are slightly superimposed by short T1 blood, and they depict some vessel irregularities of the A3 segments. Due to limited spatial resolution a diagnosis cannot be made. DSA (c) reveals the findings of vasculitis with narrowed and widened vessel lumen and a small dissecting aneurysm on the callosomarginal artery
a
b |
c |
vicinity around the circle of Willis or far distally on peripheral segments. Although proximal spasms can be detected with high sensitivity by MRA (Grandin et al. 2000), this technique is – especially in the scope of bedside ultrasound facilities – of secondary importance due to its limited ability to objectively quantify flow obstructions. If an exact definition of stenosis and of the pattern of spasms is needed in order to schedule endovascular therapeutical measures, DSA still should be performed. The advantage of noninvasive MRI techniques on the other hand is rather seen in perfusion measurements (Hertel et al. 2005).
Some congenital diseases such as Marfan syndrome or Ehlers Danlos syndrome (type 4) can cause arteriopathies of cranial cervical vessels. In Ehlers Danlos syndrome, elongations, dissections, dilatation and aneurysms, as well as fistula in large and mid-size arteries, are found. Cystic medial necrosis (Ueda et al. 1999) leads to aortic dissections which can include supraaortic vessels (Fig. 5.27)
Cervical irradiations can yield carotid wall damage as an important delayed complication of
tumor treatment. This would result in arterial sclerotic alterations with stenosis or vessel wall necrosis. Significant high grade stenosis, bilateral carotid stenoses and carotid occlusions have been described (Steele et al. 2004). The angiographic image itself is not specific, but the localization of stenoses is relevant since they correlate with the irradiation fields (Fig. 5.28). CE-MRA can be used as the primary method as in atherosclerotic stenosis.
5.3.7
MRA in Clinical Protocols
As shown above, MRA techniques are susceptible to artificial effects. High resolution time consuming measurements such as TOF-MRA are usually not suitable for the agitated patient suffering from acute stroke. Very fast and robust measurements, on the other hand, might be less detailed. In acute stroke with suspected arterial occlusion, the question of localization in the anterior or posterior circulation is of particular significance.

Vascular Anatomy and Pathology
a
While theoretically CE-MRA could be the method of choice, there are currently no sufficient studies relating to MRA in acute vertebrobasilar occlusion. The emergency situation and the difficult management of patients with impaired consciousness still cause many examiners to begin their diagnostic investigations with DSA. If the therapeutic decision depends on a non-invasive method, then CT angiography might be preferred as less susceptible to artifacts, robust and an extremely fast method. On the other hand MR parenchymal imaging including diffusion and perfusion parameters provides relevant information rather than angiography.
For the acute occlusion in the anterior circulation, no large comparative studies have been carried out to date to validate MRA, perhaps because therapeutic decisions were not dependent on evidence of an arterial occlusion or from its exact localization
97
Fig. 5.27a,b. Cystic medial necrosis. Due to the high grade proximal stenoses, test bolus measurement prior to CE-MRA failed in this case, leading to superimposition of venous contrast (a). Evaluation is nevertheless possible on original source slices (b), showing stenoses and aneurysms along the proximal supraaortic vessels (arrows)
b
Fig. 5.28. Radiogenic carotid stenosis. CE-MRA depicts atypically located proximal high grade stenosis of the right common carotid artery
98 |
D. Petersen and S. Gottschalk |
within the anterior circulation (Hacke et al. 1999; Hacke et al. 2004). Liu et al. (2004) applied 2D PCMRA as a fast technique in acute stroke cases. The lack of flow signal in the MCA correlated well with impaired diffusion and perfusions, but the authors did not prove the validity of arterial occlusion using other diagnostic modalities. Schellinger et al. (2005) transferred the CT characteristics of the “arterial hyperdense media sign” (Tomsick et al. 1996; von Kummer et al. 1996) to MRI and defined an “early MR imaging vessel sign in hyperacute stroke”. These vessel signs correlated in MRA with occlusion of the middle cerebral artery, but they could not predict the clinical outcome, eventual recanalization, nor the incidence of cerebral hemorrhage. The accuracy of MRA in this regard has not been tested.
5.3.8
Limitations and Pitfalls of MRA
Although MRA projection images may look much like classic DSA, they are based upon completely different facts. MRA provides a wide variety of examination techniques for different diagnostic purposes. Evaluation and interpretation require experience in the physical basics of the respective method in order to understand potentialities and limitations of MRA. It is particularly important to understand the origin of typical pitfalls and artifacts, which have been pointed out above.
Compared with DSA, spatial and dynamic information is also limited. Flow phenomena, however, influence vessel depiction markedly and lead to overestimation or even false positive depiction of stenoses. If the contrast bolus in CE-MRA does not exactly match the timing of the particular readout technique, false contrasts are generated at anatomic edges, which can simulate intraluminal thrombus (see Fig. 5.6). It is mandatory to recognize the technical origin of a finding like this and rather to repeat the examination than to trust imperfect images. While TOF-MRA depicts intramural short T1 hematoma in arterial dissections with high signal intensity, CE-MRA shows only the luminal abnormality in these cases and hematoma signal often does not differ from that of surrounding tissue even on single slices (Fig. 5.23). In clinically or radiologically suspicious cases, additional spin echo or TOF images are indispensable. One of the main problems with 3D inflow-MRA is spin saturation, which affects not only slow flow, but also recirculating flow. Large aneurysms for instance, whether saccular or fusiform, present with multiple recirculations of intraaneurysmal blood and appear therefore often largely obscured in TOF-MRA. Contrast agent administration makes the full extent of these aneurysms visible (Fig. 5.29). The high sensitivity of TOF sequences for short T1 tissue, on the other hand, also brings with it the risk of misdiagnosis, when intravascular signal due to thrombus is taken for inflow signal (Fig. 5.30).
a |
b |
Fig. 5.29a,b. Giant aneurysm of the posterior communicating artery in an infant. Due to recirculating blood, there is marked spin saturation within the aneurysm on unenhanced TOF-MRA (a). The entire aneurysm is visualized after contrast enhancement (b)

Vascular Anatomy and Pathology |
99 |
Fig. 5.30a–d. TOF-MRA pitfall. Although the TOF projection (a) could erroneously be taken for a distal intracranial stenosis of the left ICA, the correct diagnosis is complete occlusion of this vessel. High signal intensity of the vessel is not caused by inflow, but is due to short T1 of the subacute inravascular thrombus. Note the similar signal of inflow and short T1 thrombus on TOF source image (c) and respectively the flow void of the right artery on spin echo image (d). CE-MRA proves complete occlusion of the vessel (b)
a |
b |
|
|
c |
d |
References
Al Kwifi O, Emery DJ, Wilman AH (2002) Vessel contrast at three Tesla in time-of-flight magnetic resonance angiography of the intracranial and carotid arteries. Magn Reson Imaging 20:181–187
Anderson CM, Lee RE, Levin DL et al. (1994) Measurement of internal carotid artery stenosis from source MR angiograms. Radiology 193:219–226
Andrews J, Al Nahhas A, Pennell DJ et al. (2004) Non-invasive imaging in the diagnosis and management of Takayasu’s arteritis. Ann Rheum Dis 63:995–1000
Arpasi PJ, Bis KG, Shetty AN et al. (2000) MR angiography of
the thoracic aorta with an electrocardiographically triggered breath-hold contrast-enhanced sequence. Radiographics 20:107–120
Begelman SM, Olin JW (2000) Fibromuscular dysplasia. Curr Opin Rheumatol 12:41–47
Benjamin MS, Gillams AR, Carter AP (1997) Carotid MRA
– what advantages do the turbo field-echo and 3D phasecontrast sequences offer? Neuroradiology 39:469–473
Bogousslavsky J, Pierre P (1992) Ischemic stroke in patients under age 45. Neurol Clin 10:113–124
Bouthillier A, van Loveren HR, Keller JT (1996) Segments of the internal carotid artery: a new classification. Neurosurgery 38:425–432
100
Bradley WG Jr, Waluch V, Lai KS et al. (1984) The appearance of rapidly flowing blood on magnetic resonance images. AJR Am J Roentgenol 143:1167–1174
Cappendijk VC, Cleutjens KB, Kessels AG et al. (2005) Assessment of human atherosclerotic carotid plaque components with multisequence MR imaging: initial experience. Radiology 234:487–492
Carr JC, Ma J, Desphande V et al. (2002) High-resolution breath-hold contrast-enhanced MR angiography of the entire carotid circulation. AJR Am J Roentgenol 178:543– 549
Carriero A, Scarabino T, Magarelli N et al. (1998) High-reso- lution magnetic resonance angiography of the internal carotid artery: 2D vs 3D TOF in stenotic disease. Eur Radiol 8:1370–1372
Cavagna E, Berletti R, Schiavon F (2001) In vivo evaluation of intravascular stents at three-dimensional MR angiography. Eur Radiol 11:2531–2535
Chen CJ, Chen ST, Hsieh FY et al. (1998) Hypoplasia of the internal carotid artery with intercavernous anastomosis. Neuroradiology 40:252–254
Chiu D, Shedden P, Bratina P et al. (1998) Clinical features of moyamoya disease in the United States. Stroke 29:1347– 1351
Cosottini M, Calabrese R, Puglioli M et al. (2003) Contrastenhanced three-dimensional MR angiography of neck vessels: does dephasing effect alter diagnostic accuracy? Eur Radiol 13:571–581
Dagirmanjian A, Ross JS, Obuchowski N et al. (1995) High resolution, magnetization transfer saturation, variable flip angle, time-of-flight MRA in the detection of intracranial vascular stenoses. J Comput Assist Tomogr 19:700–706
Davis WL, Warnock SH, Harnsberger HR et al. (1993) Intracranial MRA: single volume vs. multiple thin slab 3D time-of- flight acquisition. J Comput Assist Tomogr 17:15–21
Edelman RR, Mattle HP, Wallner B et al. (1990) Extracranial carotid arteries: evaluation with “black blood” MR angiography. Radiology 177:45–50
Fischer E (1938) Die Lageabweichungen der vorderen Hirnarterie im Gefaessbild. Zentralbl Neurochir 3:300–313
Friese S, Krapf H, Fetter M et al. (2001a) Ultrasonography and contrast-enhanced MRA in ICA-stenosis: is conventional angiography obsolete? J Neurol 248:506–513
Friese S, Krapf H, Fetter M et al. (2001b) [Contrast enhanced MR-angiography (CE-MRA): do contrast media with higher T1 relaxation improve imaging of carotid stenoses?]. Rofo 173:542–546
Fujita N, Hirabuki N, Fujii K et al. (1994) MR imaging of middle cerebral artery stenosis and occlusion: value of MR angiography. AJNR Am J Neuroradiol 15:335–341
Giroud M, Lemesle M, Madinier G et al. (1997) Stroke in children under 16 years of age. Clinical and etiological difference with adults. Acta Neurol Scand 96:401–406
Gizewski ER, Ladd ME, Paul A et al. (2005) Water excitation: a possible pitfall in cerebral time-of-flight angiography. AJNR Am J Neuroradiol 26:152–155
Gottschalk S, Gaebel C, Haendler G et al. (2002) [Contrastenhanced intracranial 3 D MR angiography (CE-MRA) in assessing arterial stenoses and aneurysms]. Röfo 174:704– 713
Grandin CB, Cosnard G, Hammer F et al. (2000) Vasospasm after subarachnoid hemorrhage: diagnosis with MR angiography. AJNR Am J Neuroradiol 21:1611–1617
D. Petersen and S. Gottschalk
Guillon B, Levy C, Bousser MG (1998) Internal carotid artery dissection: an update. J Neurol Sci 153:146–158
Hacke W, Brott T, Caplan L et al. (1999) Thrombolysis in acute ischemic stroke: controlled trials and clinical experience. Neurology 53:S3–14
Hacke W, Donnan G, Fieschi C et al. (2004) Association of outcome with early stroke treatment: pooled analysis of ATLANTIS, ECASS, and NINDS rt-PA stroke trials. Lancet 363:768–774
Hartkamp MJ, van Der GJ, van Everdingen KJ et al. (1999) Circle of Willis collateral flow investigated by magnetic resonance angiography. Stroke 30:2671–2678
Hayes CE, Mathis CM, Yuan C (1996) Surface coil phased arrays for high-resolution imaging of the carotid arteries. J Magn Reson Imaging 6:109–112
Heiserman JE, Drayer BP, Fram EK et al. (1992) MR angiography of cervical fibromuscular dysplasia. AJNR Am J Neuroradiol 13:1454–1457
Hertel F, Walter C, Bettag M et al. (2005) Perfusion-weighted magnetic resonance imaging in patients with vasospasm: a useful new tool in the management of patients with subarachnoid hemorrhage. Neurosurgery 56:28–35
Hoksbergen AW, Majoie CB, Hulsmans FJ et al. (2003) Assessment of the collateral function of the circle of Willis: threedimensional time-of-flight MR angiography compared with transcranial color-coded duplex sonography. AJNR Am J Neuroradiol 24:456–462
Hurst RW (1996) Angiography of non-atherosclerotic occlusive cerebrovascular disease. Neuroimaging Clin N Am 6:651–678
Krings T, Hans F (2004) New developments in MRA: timeresolved MRA. Neuroradiology 46 Suppl 2:s214–s222
Laub GA, Kaiser WA (1988) MR angiography with gradient motion refocusing. J Comput Assist Tomogr 12:377–382 Leclerc X, Nicol L, Gauvrit JY et al. (2000) Contrast-enhanced
MR angiography of supraaortic vessels: the effect of voxel size on image quality. AJNR Am J Neuroradiol 21:1021– 1027
Levy C, Laissy JP, Raveau V et al. (1994) Carotid and vertebral artery dissections: three-dimensional time-of-flight MR angiography and MR imaging versus conventional angiography. Radiology 190:97–103
Link J, Steffens JC, Muller-Hulsbeck S et al. (1996) [MR angiography in fibromuscular dysplasia of the cervical arteries]. Röfo 164:201–205
Liu Y, Karonen JO, Vanninen RL et al. (2004) Acute ischemic stroke: predictive value of 2D phase-contrast MR angiog- raphy–serial study with combined diffusion and perfusion MR imaging. Radiology 231:517–527
Lucas C, Leclerc X, Pruvo JP et al. (2000) [Vertebral artery dissections: follow-up with magnetic resonance angiography and injection of gadolinium]. Rev Neurol (Paris) 156:1096–1105
Mettinger KL, Ericson K (1982) Fibromuscular dysplasia and the brain. I. Observations on angiographic, clinical and genetic characteristics. Stroke 13:46–52
Oelerich M, Lentschig MG, Zunker P et al. (1998) Intracranial vascular stenosis and occlusion: comparison of 3D time- of-flight and 3D phase-contrast MR angiography. Neuroradiology 40:567–573
Oelerich M, Stogbauer F, Kurlemann G et al. (1999) Craniocervical artery dissection: MR imaging and MR angiographic findings. Eur Radiol 9:1385–1391
Vascular Anatomy and Pathology
Osborn AG, Anderson RE (1977) Angiographic spectrum of cervical and intracranial fibromuscular dysplasia. Stroke 8:617–626
Ozsarlak O, Van Goethem JW, Maes M et al. (2004) MR angiography of the intracranial vessels: technical aspects and clinical applications. Neuroradiology 46:955–972
Pipe JG (2001) Limits of time-of-flight magnetic resonance angiography. Top Magn Reson Imaging 12:163–174
Rasanen HT, Manninen HI, Vanninen RL et al. (1999) Mild carotid artery atherosclerosis: assessment by 3-dimen- sional time-of-flight magnetic resonance angiography, with reference to intravascular ultrasound imaging and contrast angiography. Stroke 30:827–833
Remonda L, Senn P, Barth A et al. (2002) Contrast-enhanced 3D MR angiography of the carotid artery: comparison with conventional digital subtraction angiography. AJNR Am J Neuroradiol 23:213–219
Scarabino T, Carriero A, Magarelli N et al. (1998) MR angiography in carotid stenosis: a comparison of three techniques. Eur J Radiol 28:117–125
Schellinger PD, Chalela JA, Kang DW et al. (2005) Diagnostic and prognostic value of early MR Imaging vessel signs in hyperacute stroke patients imaged <3 hours and treated with recombinant tissue plasminogen activator. AJNR Am J Neuroradiol 26:618–624
Schievink WI, Puumala MR, Meyer FB et al. (1996) Giant intracranial aneurysm and fibromuscular dysplasia in an adolescent with alpha 1-antitrypsin deficiency. J Neurosurg 85:503–506
Sherman D (2002) Long-term Anticoagulation Therapy in Prevention of Stroke. Curr Treat Options Neurol 4:411–416 Steele SR, Martin MJ, Mullenix PS et al. (2004) Focused high-
risk population screening for carotid arterial stenosis after radiation therapy for head and neck cancer. Am J Surg 187:594–598
Stehling MK, Niedermeyer M, Laub G (1997) [Contrast medium enhanced magnetic resonance angiography. Theory, technique and practical implementation]. Radiologe 37:501–507
Sundgren PC, Sunden P, Lindgren A et al. (2002) Carotid artery stenosis: contrast-enhanced MR angiography with two different scan times compared with digital subtraction angiography. Neuroradiology 44:592–599
Teng MM, Tsai F, Liou AJ et al. (2004) Three-dimensional con- trast-enhanced magnetic resonance angiography of carotid artery after stenting. J Neuroimaging 14:336–341
Tintera J, Gawehn J, Bauermann T et al. (2004) New partially
101
parallel acquisition technique in cerebral imaging: preliminary findings. Eur Radiol 14:2273–2281
Tomsick T, Brott T, Barsan W et al. (1996) Prognostic value of the hyperdense middle cerebral artery sign and stroke scale score before ultraearly thrombolytic therapy. AJNR Am J Neuroradiol 17:79–85
Trivedi RA, King-Im JM, Graves MJ et al. (2004) Noninvasive imaging of carotid plaque inflammation. Neurology 63:187–188
Uchino A, Sawada A, Takase Y et al. (2003) Variations of the superior cerebellar artery: MR angiographic demonstration. Radiat Med 21:235–238
Ueda T, Shimizu H, Aeba R et al. (1999) Prognosis of Marfan and non-Marfan patients with cystic medial necrosis of the aorta. Jpn J Thorac Cardiovasc Surg 47:73–78
van Bemmel CM, Wink O, Verdonck B et al. (2003) Blood pool contrast-enhanced MRA: improved arterial visualization in the steady state. IEEE Trans Med Imaging 22:645–652
van de Perre S, Vanhoenacker FM, Van Breusegem L et al. (2004) Congenital agenesis of the internal carotid artery. JBR -BTR 87:258
von Kummer R, Holle R, Gizyska U et al. (1996) Interobserver agreement in assessing early CT signs of middle cerebral artery infarction. AJNR Am J Neuroradiol 17:1743–1748
Wetzel S, Bongartz G (1999) MR angiography: supra-aortic vessels. Eur Radiol 9:1277–1284
Wetzel SG, Haselhorst R, Bilecen D et al. (2001) Preliminary experience with dynamic MR projection angiography in the evaluation of cervicocranial steno-occlusive disease. Eur Radiol 11:295–302
Wiesmann M, Yousry I, Seelos KC et al. (2001) Identification and anatomic description of the anterior choroidal artery by use of 3D-TOF source and 3D-CISS MR imaging. AJNR Am J Neuroradiol 22:305–310
Willig DS, Turski PA, Frayne R et al. (1998) Contrast-enhanced 3D MR DSA of the carotid artery bifurcation: preliminary study of comparison with unenhanced 2D and 3D time-of- flight MR angiography. Radiology 208:447–451
Younger DS (2004) Vasculitis of the nervous system. Curr Opin Neurol 17:317–336
Yuan C, Mitsumori LM, Beach KW et al. (2001) Carotid atherosclerotic plaque: noninvasive MR characterization and identification of vulnerable lesions. Radiology 221:285– 299
Zimmerman R, Leeds NE, Naidich TP (1977) Carotid-cavern- ous fistula associated with intracranial fibromuscular dysplasia. Radiology 122:725–726

Disturbed Brain Perfusion |
103 |
6Disturbed Brain Perfusion
Sabine Heiland
CONTENTS
6.1Introduction 103
6.2Perfusion Measurements with the Dynamic
Susceptibility Contrast-Enhanced Method 103
6.3Sequences for Dynamic Susceptibility Contrast-Enhanced Imaging 104
6.4Postprocessing of Dynamic Susceptibility Contrast-Enhanced Data 105
6.4.1Semiquantitative Parameters 106
6.4.2Quantification 108
6.5 |
Diagnosis of Cerebrovascular Diseases with DSC 109 |
6.6 |
Practical Issues for DSC Imaging 111 |
6.6.1Contrast Agent 111
6.6.2Time Resolution 112
6.6.3Data Postprocessing 112
6.7Perfusion Measurements with Arterial Spin Labeling 113
References 114
6.1 Introduction
Blood flow in the vascular network, particularly within the capillaries, may be severely disturbed as a result of an occluded cerebral artery, but may also be impaired in case of hemodynamic infarction caused by high grade stenosis of cervical arteries. Up to the early 1990s, it was not possible to determine such changes in cerebral blood flow on the basis of radiological imaging techniques in clinical routine, despite the fact that Axel had developed a technique in 1980 using iothalamate sodium as contrast agent and computed tomography (CT) for visualization of the contrast agent bolus (Axel 1980; Norman et al. 1981). This method has not become a routine technique before multislice CT was developed, but
S. Heiland, PhD
Division of Experimental Neuroradiology, Department of Neuroradiology, Ruprecht-Karls University of Heidelberg, Im Neuenheimer Feld 400, 69120 Heidelberg, Germany
it has constituted the methodological basis for the development of dynamic susceptibility contrastenhanced (DSC) MRI, which is often falsely referred to as perfusion weighted MRI (PWI), but is better designated as MR perfusion imaging (PI).
6.2
Perfusion Measurements with the Dynamic Susceptibility Contrast-Enhanced Method
After the advent of MR systems with powerful gradient hardware, dynamic scans with a repetition rate of at least one image or image stack per 2 s have become possible. By use of such sequences it has become feasible to visualize the transit of a bolus of paramagnetic or superparamagnetic contrast agent through the brain (Moseley et al. 1990; Rosen et al. 1990). For DSC, the bolus is injected intravenously.
In contrast to conventional MR imaging, the contrast agent is not visualized on the basis of the T1 signal change, because the signal alteration in T1-weighted images is rather small in brain tissue with intact blood–brain barrier (BBB). This is due to the fact that T1 relaxation of water molecules is only changed, if a contrast agent molecule is present in the immediate vicinity. This means that water molecules in the extravascular compartment do not “see” the contrast agents in the case of intact BBB; only intravascular water molecules, which are about 3%–5% of the total tissue water, contribute to the T1 signal change.
A much larger signal change can be observed during contrast agent passage, if T2*-weighted (T2*w) sequences are used. The concentration difference between intravascular and extravascular
contrast agent (concintr > 0, concextr = 0 for intact BBB) leads to local magnetic field gradients, which
in turn results in a decrease of T2* signal. Therefore, in T2w sequences a distinct signal drop can be seen during bolus passage through the capillaries (Fisel et al. 1991).
104 |
S. Heiland |
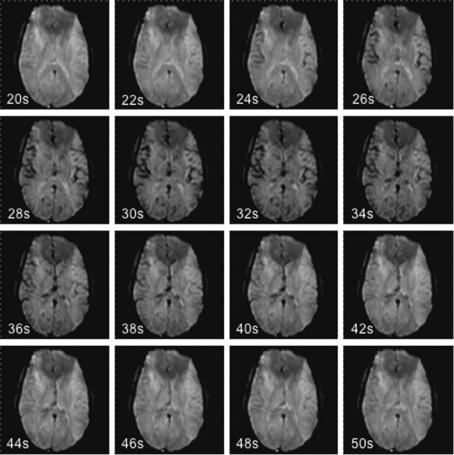
The signal decrease in brain tissue largely depends on the perfused cerebral blood volume: The signal drop in gray matter (GM) exceeds that of white matter (WM). Therefore WM is hyperintense relatively to GM on the image data set acquired during the bolus maximum (Fig. 6.1). In ischemic tissue, where only a small amount of contrast agent passes the capillaries, the signal intensity during bolus maximum passage is even brighter than normally perfused WM. If perfusion has dropped completely, the signal during bolus passage equals the pre-con- trast signal (Fig. 6.2).
6.3
Sequences for Dynamic Susceptibility Contrast-Enhanced Imaging
For PI, basically all fast and strongly T2*w sequences can be used. In the early days of PI, measurements were performed using fast, T2*w gradient-echo sequences, particularly the fast low angle shot
(FLASH) sequences. A small flip angle should be chosen (10–20°) to reduce flow effects. Furthermore, echo time (TE) should exceed 20 ms to ensure strong T2*-weighting, whereas repetition time (TR) should not exceed 30 ms to enable a high image repetition rate. This sequence type, however, has the disadvantage, that with a required minimum image repetition rate of one image per 2 s it is limited to the acquisition of one slice only; even in-plane resolution has to be reduced to meet the demands of high time resolution.
Nowadays, echo planar imaging (EPI) sequences are widely used for DSC imaging. The general advantage of this sequence type over FLASH sequences is their ability to acquire multi-slice datasets within the required time resolution. They do, however, require an advanced gradient hardware with a maximum gradient of > 25 mT/m and a slew rate of > 50 mT/m/ ms. There are basically two types of EPI sequences using different RF excitation schemes: gradient-echo EPI sequences and spin-echo EPI sequences. Gradi- ent-echo EPI sequences are strongly T2*-weighted and therefore produce the highest signal drop for a
Fig. 6.1. Source images of a dynamic susceptibility contrast-enhanced series in a healthy volunteer, acquired 20–50 s after bolus injection: during the bolus passage the signal decrease in gray matter is more prominent than that in white matter. After the bolus passage, the signal returns to normal
Disturbed Brain Perfusion |
105 |
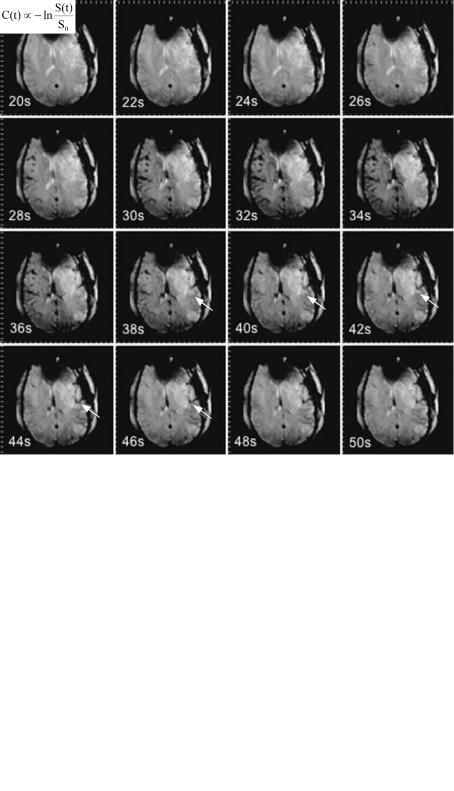
Fig. 6.2. Source images of a dynamic susceptibility contrast-enhanced series in a patient with focal cerebral ischemia, acquired 20–50 s after bolus injection: within the ischemic territory in the left hemisphere the
signal decreases later and less than in the normal tissue (arrows)
given contrast agent concentration within the vessels (Heiland et al. 1998). This sequence type, however, is sensitive to contrast agent in both capillaries and larger vessels. The T2*-weighting of spin-echo EPI sequences is less than that of gradient-echo EPI sequences; spin-echo EPI sequences are predominantly T2-weighted. The signal-time course therefore shows a much smaller signal drop compared to that of gradient-echo EPI; this signal drop is, however, largely related to contrast agent molecules in capillaries, whereas contrast agent in larger vessels produces much less signal changes (Speck et al. 2000). Therefore spin-echo EPI sequences are well suited to study perfusion selectively in capillaries. The TR of EPI sequences equals the time resolution of the dynamic scan and should not exceed 2 s. To ensure a high sensitivity for the contrast agent and a reasonable signal-noise ratio (SNR) echo time should be chosen between 50 and 70 ms in case of gradient-echo EPI, whereas for spin-echo EPI it should be slightly longer (70–100 ms) (Boxerman et al. 1997).
6.4
Postprocessing of Dynamic Susceptibility Contrast-Enhanced Data
The visual analysis of the dynamic signal change gives the radiologist initial information about the existence of focal alterations in cerebral perfusion; tissue with very low or no perfusion, in particular, can be well distinguished from normal tissue. If one needs more detailed information about the cerebrovascular parameters, however, some mathematical operations need to be done. At first, from the signal- time-course – either determined in a user-defined region of interest (ROI) or on a pixel-by-pixel basis (Fig. 6.3) – the time course of the (relative) contrast agent concentration is calculated by
,
where C(t) is the relative concentration of the contrast agent within the ROI or the respective voxel, S(t) is the signal intensity and S0 is the mean signal
106
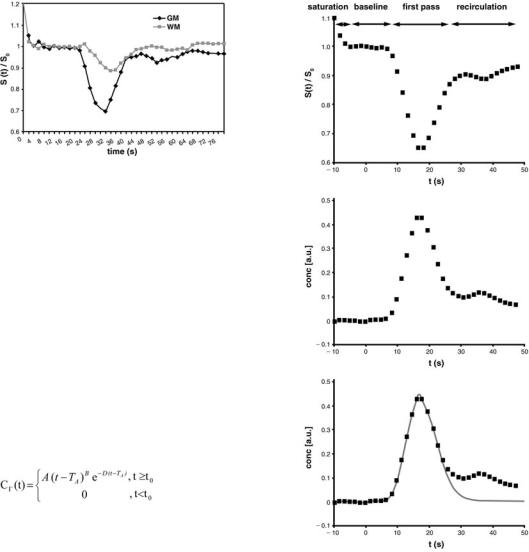
Fig. 6.3. Signal-time course in normally perfused gray and white matter: The signal drop of gray matter is larger than that of white matter
intensity before the bolus appears within the region of interest. This equation has been proposed by numerical simulation (Fisel et al. 1991) and verified by in vivo measurements (Rosen et al. 1990).
In the concentration time curve the first pass of the bolus appears after the pre-contrast baseline (Fig. 6.4a). After the first pass, concentration does not return to zero, but remains increased (Fig. 6.4b). This effect is due to contrast agent molecules remaining within the capillary network and to second pass effects. One way to avoid these effects is to fit a gamma-variate function to the measured values of contrast agent concentration (Belliveau et al. 1991; Thompson et al. 1964) (Fig. 6.4c):
S. Heiland
a
b
The parameters A, B, D and TA are determined using a least squares fitting procedure. While A, B, and D are phenomenological parameters, TA equals the so-called time to arrival which is the time between contrast agent injection and appearance of the first contrast agent molecules within the ROI.
Some MR manufacturers use numerical algorithms to process the concentration-time curves. In such algorithms, user interaction is mandatory for definition of the end of the first pass. The numerical algorithms, however, are much faster than algorithms based on curve fitting, because they avoid the time-consuming non-linear fitting procedure.
c
Fig. 6.4a–c. Postprocessing of the signal-time curve. a The baseline is determined from the signal before bolus arrival. During first pass, there is a sharp signal decrease. The first pass is often followed by a second pass, with a signal decrease that is less steep than in the first pass. b From the signal-time curve, the time course of the relative contrast agent concentration is calculated. c A gamma variate function is fitted to the curve to avoid effects of persistent contrast agent and of the second pass
6.4.1
Semiquantitative Parameters
From the time course of relative contrast agent concentration several cerebrovascular parameters can be calculated. They reflect different physiological
parameters and make it possible to diagnose and monitor pathophysiological processes. Figure 6.5 visualizes how these parameters are calculated from the concentration-time curve.
Indicator-dilution theory (Axel 1980; Rosen et al. 1989) leads to the formula for calculation of the relative regional cerebral blood volume (rrCBV)