

Книги по МРТ КТ на английском языке / Magnetic Resonance Imaging in Ischemic Stroke - K Sartor R 252 diger von Kummer Tobias Back
.pdf168
with leukoaraiosis (Lee et al. 2002) and with chronic hypertension (Lee et al. 2004).
The incidence of these lesions among the healthy elderly population varies from 3.1% (Tsushima et al. 2002) to 6.4% (Roob et al. 1999). Among patients with ICH, MBs have a frequency of 30%–80% (Tsushima et al. 2003). MBs generally coexist with moderate-to-severe white matter changes (Kwa et al. 1998), which is explained by the fact that both leukoaraiosis and MBs have small vessel disease as a common denominator. MBs are found mainly in the basal ganglia, corona radiata, centrum semiovale, brainstem and cerebellum. Cerebral amyloid angiopathy (CAA) is another possible etiology of MBs (Fazekas et al. 1999; Kinoshita et al. 2000). CAA-related MBs are located in the cortex and the immediately subcortical white matter. The clinical importance of MBs is that they may identify patients prone to develop spontaneous ICH (Lee et al. 2004), and especially patients at higher risk of ICH after thrombolysis (Kidwell et al. 2002) or during chronic treatment with aspirin (Wong et al. 2003) or oral anticoagulants.
MBs appear as small sharply defined signal loss on T2*-weighted GRE sequences. They can also be demonstrated by T2-weighted SE sequences, albeit inconstantly and mainly at high field. Echo-planar T2*-weighted sequences can demonstrate MBs within seconds (Kinoshita et al. 2000), but they may fail to detect MBs at the basal regions of cerebral hemispheres and in the posterior fossa, due to susceptibility artifacts (Tsushima et al. 2003). T1-weighted images are insensitive to MBs, as they contain only hemosiderin and not other hemoglobin breakdown products.
References
Adams HP Jr, Kassell NF, Turner JC et al (1983) CT and clinical correlation in recent aneurysmal subarachnoid hemorrhage: a report of the cooperative aneurysm study. Neurology 33:981–988
Alemany Ripoll M, Stenborg A, Sonninen P et al (2004) Detection and appearance of intraparenchymal haematomas of the brain at 1.5 T with spin-echo, FLAIR and GE sequences: poor relationship to the age of the haematoma. Neuroradiology 46:435–443
Allkemper T, Tombach B, Schwindt W et al (2004) Acute and subacute intracerebral hemorrhages: comparison of MR imaging at 1.5 and 3.0 T. Initial experience. Radiology 232:874–881
Anzai Y, Ishikawa M, Shaw DW et al (2004) Paramagnetic effect of supplemental oxygen on CSF hyperintensity on fluid-attenuated inversion recovery MR images. AJNR Am J Neuroradiol 25:274–279
T. Krishnamoorthy and M. Fiorelli
Bakshi R, Kamran S, Kinkel PR et al (1999) MRI in cerebral intraventricular hemorrhage: analysis of 50 consecutive cases. Neuroradiology 41:401–409
Barkovich AJ, Atlas SW (1988) Magnetic resonance imaging of intracranial hemorrhage. Radiol Clin North Am 26:801–820 Bradley WG Jr (1993) MR appearance of hemorrhage in the
brain. Radiology 189:15–26
Broderick JP, Adams HP Jr, Barsan W et al (1999) Guidelines for the management of spontaneous intracerebral hemorrhage: a statement for healthcare professionals from a special writing group of The Stroke Council, American Heart Association. Stroke 30:905–915
Brooks RA, Di Chiro G, Patronas N et al (1989) MR imaging of cerebral hematomas at different field strengths: theory and applications. J Comput Assist Tomogr 13:194–206
Brott T, Broderick JP, Kothari R et al (1997) Early hemorrhage growth in patients with intracerebral hemorrhage. Stroke 28:1–5
Carhuapoma JR, Barker PB, Hanley DF et al (2002) Human brain hemorrhage: quantification of perihematoma edema by use of diffusion-weighted MR imaging. AJNR Am J Neuroradiol 23:1322–1326
Clark RA, Watanabe AT, Bradley WG Jr et al (1990) Acute hematomas: effects of deoxygenation, hematocrit and fibrin-clot formation and retraction on T2 shortening. Radiology 175:201–206
Del Zoppo GJ, von Kummer R, Hamann GF (1998) Ischemic damage of brain microvessels: inherent risks for thrombolytic treatment in stroke. J Neurol Neurosurg Psychiatry 65:1–9
DeLaPaz RL, New PF, Buonanno FS et al (1984) NMR imaging of intracranial hemorrhage. J Comput Assist Tomogr 8:599–607
Deliganis AV, Fisher DJ, Lam AM et al (2001) Cerebrospinal fluid signal intensity increase on FLAIR MR images in patients under general anesthesia: the role of supplemental oxygen. Radiology 218:152–156
Fazekas F, Kleinert R, Roob G et al (1999) Histopathologic analysis of foci of signal loss on gradient-echo T2*- weighted MR images in patients with spontaneous intracerebral hemorrhage: evidence of microangiopathy related microbleeds. AJNR Am J Neuroradiol 20:637–642
Feinberg DA, Oshio K (1991) GRASE (Gradient and SpinEcho) MR imaging: a new fast clinical imaging technique. Radiology 181:597–602
Fiebach JB, Schellinger PD, Geletneky K et al (2004) MRI in acute subarachnoid haemorrhage; findings with a standardised stroke protocol. Neuroradiology 46:44–48
Filippi CG, Ulu AM, Lin D et al (2001) Hyperintense signal abnormality in subarachnoid spaces and basal cisterns on MR images of children anesthetized with propofol: new fluid-attenuated inversion recovery finding. AJNR Am J Neuroradiol 22:394–399
Fobben ES, Grossman RI, Atlas SW et al (1989) MR characteristics of subdural hematomas and hygromas at 1.5 T. AJNR Am J Neuroradiol 10:687–693
Fogelholm R, Heiskanen O, Waltimo O (1975) Chronic subdural hematoma in adults. Influence of patient’s age on symptoms, signs, and thickness of hematoma. J Neurosurg 42:43–46
Gomori JM, Grossman RI, Goldberg HI et al (1985) Intracranial hematomas: imaging by high-field MR. Radiology 157:87–93
Gomori JM, Grossman RI, Yu-Ip C et al (1987) NMR relaxation
MR Detection of Intracranial Hemorrhage
times of blood: dependence on field strength, oxidation state and cell integrity. J Comput Assist Tomogr 11:684–690
Hart RG, Easton JD (1986) Hemorrhagic infarcts. Stroke 17:586–589
Hayman LA, Taber KH, Ford JJ et al (1991) Mechanisms of MR signal alteration by acute intracerebral blood: old concepts and new theories. AJNR Am J Neuroradiol 12:899–907
Hermier M, Nighoghossian N, Derex L et al (2001) MRI of acute post-ischemic cerebral hemorrhage in stroke patients: diagnosis with T2*- weighted gradient - echo sequence. Neuroradiology 43:809–815
Hornig CR, Dorndorf W, Agnoli AL (1986) Hemorrhagic cerebral infarction. A prospective study. Stroke 17:179–185 Huckman MS, Weinberg PE, Kim KS et al (1970) Angiographic
and clinico-pathologic correlates in basal ganglionic hemorrhage. Radiology 95:79–92
Imaizumi T, Chiba M, Honma T et al (2003a) Detection of hemosiderin deposition by T2*-weighted MRI after subarachnoid hemorrhage. Stroke 34:1693–1698
Imaizumi T, Horita Y, Honma T et al (2003b) Association between a black band on the inner membrane of a chronic subdural hematoma on T2*-weighted magnetic resonance images and enlargement of the hematoma. J Neurosurg 99:824–830
Kidwell CS, Saver JL, Villablanca JP et al (2002) Magnetic resonance imaging detection of microbleeds before thrombolysis: an emergency application. Stroke 33:95–98
Kidwell CS, Chalela JA, Saver JL et al (2004) Comparison of MRI and CT for detection of acute intracerebral hemorrhage. JAMA 292:1823–1830
Kinoshita T, Okudera T, Tamura H et al (2000) Assessment of lacunar hemorrhage associated with hypertensive stroke by echo-planar gradient-echo T2*-weighted MRI. Stroke 31:1646–1650
Küker W,Thiex R,Block F (1999) Hyperacute perimesencephalic subarachnoid hemorrhage: demonstration of blood extravasation with MRI. J Comput Assist Tomogr 23:521–523
Kwa VH, Franke CL, Verbeeten B Jr et al (1998) Silent intracerebral microhemorrhages in patients with ischemic stroke. Ann Neurol 44:372–377
Lee SK, Terbrugge KG (2003) Cerebral venous thrombosis in adults: the role of imaging evaluation and management. Neuroimag Clin North Am 13:139–152
Lee SH, Bae HJ, Yoon BW et al (2002) Concentration of serum total cholesterol is associated with multifocal signal loss lesions on gradient-echo magnetic resonance imaging. Analysis of risk factors for multifactorial signal loss lesions. Stroke 33:2845–2849
Lee SH, Bae HJ, Kwon SJ et al (2004) Cerebral microbleeds are regionally associated with intracerebral hemorrhage. Neurology 62:72–76
Linfante I, Linas RH, Caplan LR et al (1999) MRI features of intracranial hemorrhage within 2 hours from symptom onset. Stroke 30:2263–2267
Macdonald RL, Stoodley M, Weir B (2001) Intracranial aneurysms. Neurosurg Qtly 11:181–198
Markwalder TM (1981) Chronic subdural hematomas: a review. J Neurosurg 54:637–645
Mitchell P, Wilkinson ID, Hoggard N et al (2001) Detection of subarachnoid hemorrhage with magnetic resonance imaging. J Neurol Neurosurg Psychiatry 70:205–211
Mrita N, Harada M, Yoneda K et al (2002) A characteristic feature of acute hematomas in the brain on echo-planar diffusion weighted imaging. Neuroradiology 44:907–911
169
Noguchi K, Ogawa T, Seto H et al (1997) Subacute and chronic subarachnoid hemorrhage: diagnosis with fluid-attenuated inversion recovery MR imaging. Radiology 203:257–262
Noguchi K, Seto H, Kamisaki Y et al (2000) Comparison of fluid-attenuated inversion-recovery MR imaging with CT in a simulated model of acute subarachnoid hemorrhage. AJNR Am J Neuroradiol 21:923–927
Qureshi AI, Tuhrim S, Broderick JP et al (2001) Spontaneous intracerebral hemorrhage. N Engl J Med 344:1450–1460 Rabinstein AA, Pittock SJ, Miller GM et al (2003) Pseudosub-
arachnoid haemorrhage in subdural haematoma. J Neurol Neurosurg Psychiatry 74:1131–1132
Roob G, Schmidt R, Kapeller P et al (1999) MRI evidence of past cerebral microbleeds in a healthy elderly population. Neurology 52:991–994
Rosenberg GA, Mun-Bryce S, Wesley M et al (1990) Collagenaseinduced intracerebral hemorrhage in rats. Stroke 21:801–807
Rumboldt Z, Kalousek M, Castillo M (2003) Hyperacute subarachnoid hemorrhage on T2-weighted MR images. AJNR Am J Neuroradiol 24:472–475
Sudlow C, Warlow CP (1997) Comparable studies of the incidence of stroke and its pathological types: results from an international collaboration. Stroke 28:491–499
Tsushima Y, Tanizaki Y, Aoki J et al (2002) Detection of microhemorrhage in neurologically healthy adults. Neuroradiology 44:31–36
Tsushima Y, Aoki J, Endo K (2003) Brain microhemorrhages detected on T2*-weighted gradient-echo MR images. AJNR Am J Neuroradiol 33:88–96
Tsutsumi K, Maeda K, Iijima A et al (1997) The relationship of preoperative magnetic resonance imaging findings and closed system drainage in the recurrence of chronic subdural hematoma. J Neurosurg 87:870–875
Van Gijn J, Rinkel GJ (2001) Subarachnoid hemorrhage. Diagnosis, causes and management. Brain 124:249–278
Van Gijn J, van Dongen KJ (1982) The time course of aneurysmal hemorrhage on computed tomograms. Neuroradiology 23:153–156
Wardlaw JM, Keir SL, Dennis MS (2003) The impact of delays in computed tomography of the brain on the accuracy of diagnosis and subsequent management in patients with minor stroke. J Neurol Neurosurg Psychiatry 74:77–81
Wiesmann M, Mayer TE, Yousry I et al (2002) Detection of hyperacute subarachnoid hemorrhage of the brain by using magnetic resonance imaging. J Neurosurg 96:684–689
Wintermark M, Maeder P, Reichart M et al (2002) MR pattern of hyperacute cerebral hemorrhage. J Magn Reson Imaging 15:705–709
Wong KS, Chan YL, Liu JY (2003) Asymptomatic microbleeds as a risk factor for aspirin-associated intracerebral hemorrhages. Neurology 60:511–513
Woodcock RJ Jr, Short J, Do HM et al (2001) Imaging of acute subarachnoid hemorrhage with a fluid-attenuated inversion recovery sequence in an animal model: comparison with non-contrast-enhanced CT. AJNR Am J Neuroradiol 22:1698–1703
Zazulia AR, Diringer MN, Videen TO et al (2001) Hypoperfusion without ischemia surrounding acute intracerebral hemorrhage. J Cereb Blood Flow Metab 21:801–810
Zhu XL, Chan MS, Poon WS (1997) Spontaneous intracranial hemorrhage: which patients need diagnostic cerebral angiography? A prospective study of 206 cases and review of the literature. Stroke 28:1406–1409
MR Spectroscopy in Stroke |
171 |
11 MR Spectroscopy in Stroke
Heinrich Lanfermann and Ulrich Pilatus
CONTENTS
11.11H-MR Spectroscopy in Stroke – Insight into
|
Pathobiochemistry of Ischemic Brain 171 |
11.2 |
Introduction to MRS 172 |
11.31H-MRS Methodology 172
11.3.1Single-Volume 1H-MRS Versus 1H-MR Spectroscopic Imaging 172
11.3.2 |
Impact of Fast Spectroscopic Imaging 173 |
|
11.3.3 |
Partial Volume Effects Due to Low Resolution |
174 |
11.3.4 |
Evaluation of Metabolite Concentrations 175 |
|
11.3.5 |
Artifacts in Metabolite Maps 176 |
|
11.4 |
Biochemical Alterations in Cerebral Infarcts |
177 |
11.5Clinical Impact of 1H-MR Spectroscopic Imaging 178
11.6 |
Limitations of 1H-MR Spectroscopic Imaging 180 |
11.7 |
Future of 1H-MR Spectroscopic Imaging 180 |
|
References 180 |
11.1
1H-MR Spectroscopy in Stroke – Insight into Pathobiochemistry of Ischemic Brain
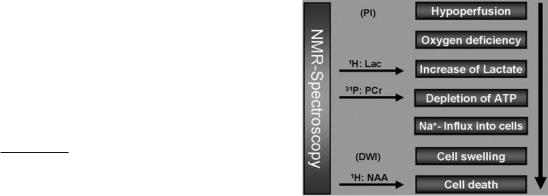
Only few of the complex pathophysiological and pathobiochemical processes during acute hypoperfusion of the brain can be accurately monitored by imaging techniques. The initial step in stroke can be monitored by mapping of the hypoperfused areas with perfusion MR imaging (PI). Resulting from the interception in nutrition supply, a cascade of biochemical events (Fig. 11.1) will finally cause cell swelling (cytotoxic edema) in the affected areas. The concomitant increase in the apparent water diffusion coefficient (ADC) can be exploited to visualize this area with diffusion weighted MR imaging (DWI). Thus, two advanced MR imaging methods are available to monitor either the initial or a rather late phase of stroke, but these methods, which are
based on the water proton signal, can not resolve biochemical and physiological processes in between. In contrast, MR spectroscopy, which detects signals from water soluble metabolites provides information on concentration changes of key metabolites involved in ischemia (Beauchamp et al. 1999). Oxygen depletion will induce anaerobic glycolysis leading to an increase in lactate production which will accumulate especially in the presence of hypoperfusion. Lactate can be observed with MRS providing a sensitive biochemical marker for oxygen depletion due to hypoperfusion. Lactate accumulation and persisting lack in energy supply will cause drop in ATP and pH, both parameters are accessible by 31P MRS. The following failure of Na+-K+-ATPase activity leads to Na+ influx which in principle can be monitored by 23Na MRS (Hilal et al. 1983). Since this is causing the cytotoxic edema, it can also be visualized by the above mentioned diffusion sensitive MRI method. Finally, monitoring the neuronal marker NAA with 1H MRS will probe for integrity of neurons providing information on the last phase of infarcted tissue, the death of severely damaged cells.
The two MRI methods are already part of an advanced routine MRI stroke-protocol. At least, the 1H MRS study could be performed in the framework of such a protocol without further equipment. As
H. Lanfermann, MD
Institute for Neuroradiology, Goethe University of Frankfurt, Schleusenweg 2–16, 60590 Frankfurt am Main, Germany
U. Pilatus, MD
Institute for Neuroradiology, Goethe University of Frankfurt, Schleusenweg 2–16, 60528 Frankfurt am Main, Germany
Fig. 11.1. Physiological and metabolic changes in stroke which can be targeted with 1H-MR spectroscopy
172 |
H. Lanfermann and U. Pilatus |
will be discussed below, modern MRS methods are now available, which allow the completion of such an MRS study in less than 10 min, which makes the examination acceptable even in the situation of acute stroke. The aim of this article is to describe the available methodology and discuss the benefits of such an examination for the pathophysiological analysis of stroke.
11.2
Introduction to MRS
Magnetic resonance imaging (MRI) depends on the signal of water protons (1H nuclei) in the presence of magnetic field gradients, which, together with phase encoding, provides the localization. MRS detects water soluble metabolites thus presenting a method for in vivo monitoring of metabolic changes. Spectroscopy can be performed on all nuclei with a spin, leaving 23Na, 15N, 13C, 31P, and 1H as main potential targets for biological applications. 15N and 13C are at low natural abundance and must be administered as labeled compounds. At clinical magnetic field strength, only the 1H nuclei show sufficient sensitivity to be detectable in small volumes (< 4 ml) within reasonable acquisition time. However, measuring 1H spectra requires efficient suppression of the dominant water signal which exceeds the metabolite signals by approximately 104. This can be achieved by selective saturation of the water. The first in vivo 1H spectra of rat brain were recorded in 1983 using a surface coil in vertical bore high resolution NMRspectrometer at 8 T (Behar et al. 1983). Human brain spectra were obtained in 1985 by Bottomley et al., which clearly demonstrated the superior sensitivity of 1H nuclei compared to 31P nuclei.
The first in vivo spectra were recorded with surface coils which detect signal from the entire region in the vicinity of the coil. For application to pathological lesions, it is required to obtain spectra from a targeted region of the brain (e.g. the DWI lesion). This can be achieved by pulse sequences with selective excitation of three orthogonal slabs resulting into spectra from single cuboid volume element localized at the intersection of the slabs (single voxel spectroscopy, SVS). Two methods are available, either PRESS (Bottomley 1987; Ordidge and van de Vyver 1985) or STEAM (Frahm et al. 1989a), each having their advantages and disadvantages as described by Moonen et al. (1989). The potential of measuring spatially resolved spectroscopic information (i.e. obtaining a matrix of
spectra as demonstrated in Fig. 11.5) by combining spectroscopy with gradient phase encoding (spectroscopic imaging, SI or MRSI) was first demonstrated by Brown et al. (1982) for the 31P nucleus. Maudsley et al. (1983) applied the same method to 23Na which enabled Hilal et al. (1983) to map sodium increase in ischemic cat brains. One of the first applications in 1H MRS in humans was focused on brain ischemia. The first SVS 1H spectrum of stroke in humans was presented in 1988 (Berkelbach van der Sprenkel et al. 1988) whereas Duijn et al. (1992) showed first 1H spectroscopic images of stroke patients in 1992. Especially with the development of thrombolytic therapies (Hacke et al. 1995; NINDS Stroke-Trial 1995) there is a high demand for a thorough analysis of the infarcted area. The concentration of key metabolites could play a pivotal role. Since MR spectroscopy can provide this information non-invasively in acute stroke, a considerable amount of effort was put in incorporating MRS into the MR examination protocol of acute stroke. However, technical demands and physical limits have prevented a real breakthrough of the method until today.
In the near future the signal to noise ratio (S/N) will gain by increased field strength (from 1.5 to 3.0 T) for clinical scanners. Also, implementation of fast SI techniques can reduce the acquisition time by more than a factor of two, which would turn SI to an applicable tool in a routine MRI protocol for stroke.
11.3
1H-MRS Methodology
11.3.1
Single-Volume 1H-MRS Versus 1H-MR Spectroscopic Imaging
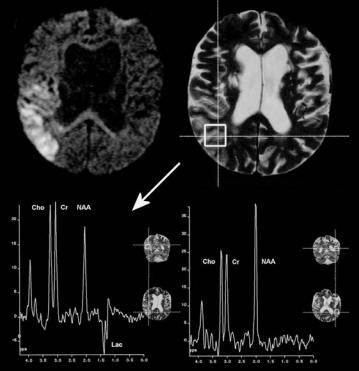
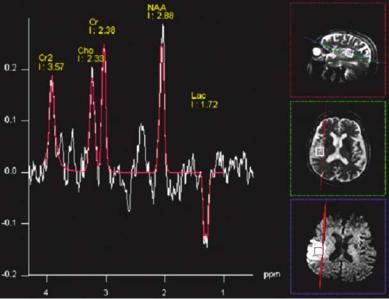
Metabolic information of infarcted tissue can be retrieved by selecting a single cuboid volume of the pathological area for the spectroscopic examination using one of the above described SVS spectroscopy sequences. Results from an SVS MRS examination at 1.5 T with the PRESS sequence applying a TE of 144 ms are shown in Fig. 11.2. As expected, the infarcted area shows lactate which is visible as two inverted peaks (doublet) around 1.33 ppm while the contralateral tissue exhibits the spectrum of a healthy white matter. To achieve sufficient S/N for quantifiable SVS data from a 3 ml volume (approximately 1.5×1.5×1.5 cm3), the data acquisition time will take approximately 4 min. This leads to a rather
MR Spectroscopy in Stroke |
173 |
long total measurement time since more representative voxels are required to characterize the infarcted area in size and severity, e.g. in Fig. 11.2 the area in the vicinity of the diffusion lesion would be of special interest. For 31P MRS the S/N is even worse, which leaves this method – despite the expected high diagnostic impact of the detectable parameters like pH values, phosphocreatine and ATP concentration
– less applicable for acute stroke.
With the lack of other methods to obtain sufficient information for a qualified choice of the position of the spectroscopic voxel, spectroscopic imaging (SI) techniques should be the method of choice. In SI all spectra of a selected slice are acquired simultaneously applying encoding gradients between the excitation pulse and the acquisition period. After spatial Fourier transformation the spectroscopic image is obtained as a matrix of the dimension A×B, where A and B denote the number of phase encoding steps in each direction within the slice. Each matrix element consists of a spectrum. A spectroscopic image can be visualized as a grid overlay on the anatomical image. The anatomical image, which should be recorded with a field of view (FOV), angulations and slice selection identical to the SI sequence, is divided by the grid in A×B voxels each carrying the respective spectroscopic information (Fig. 11.3). Such a map of spectra provides a retrospective defi-
Fig. 11.2. 1H single voxel MR spectroscopy of stroke. Data from a 60-year-old male were obtained at 1.5 T with 144 ms echo time. Respective volumes of interest are marked on T2-weighted image. Left spectrum, infarcted area. Right spectrum, contralateral healthy tissue. Note the appearance of lactate (two negative peaks at 1.3 ppm) as the most significant difference
nition of the center and the extension of infarcted tissue, while at the same time reference spectra are available from regular non-infarcted tissue. The spatial distribution of biochemical changes within the infarcted area can be exploited to discriminate irreversible damaged tissue from tissue at risk. Since Lac and NAA play a pivotal role for this discrimination, 1H MRSI is already capable of adding important information to the conventional imaging techniques. SI can go down to resolution of 0.75×0.75×1.00 cm3, but requires phase encoding of the respective matrix. Consequently, acquisition of a data set with conventional CSI technique takes more than 15 min (see below) which, in most cases, is not tolerated by acute stroke patients especially when performed in addition to the other modalities routinely applied in the MR examination of stroke. We will discuss modifications of the basic CSI sequence that can significantly reduce the data acquisition time and details of biochemical and clinical aspects of metabolic changes.
11.3.2
Impact of Fast Spectroscopic Imaging
For an in plane resolution of 7.5×7.5 mm2, the 32×32 matrix shown in Fig. 11.3 had to be recorded at a
174 |
H. Lanfermann and U. Pilatus |
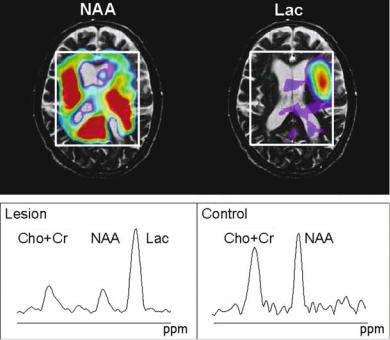
Fig. 11.3. Spectroscopic imaging of stroke. Data from a 71- year-old male were obtained at 3 T using conventional CSI with 144 ms echo time (17 min acquisition time). Metabolite intensities are plotted as color-coded overlay on diffusionweighted images. Intensities of SI maps of NAA and lactate were obtained by time domain data fit using jMRUI. Representative spectra and fit results (red line) are shown in the lower part of the figure. The arrows indicate the position of the respective voxels. Low Lac values and persistent NAA signals in the posterior part of the area with increased signal on the DWI image may be caused by early reperfusion of an M3 branch of the middle cerebral artery and consecutive washout of Lac
240 mm2 FOV. Acquisition of the entire k-space at a repetition time of 1.5 s would take 1024×1.5 s or 26 min. Together with the preparation period (extensive shimming, adjustments for water suppression), the MRS examination may add another 45 min to the conventional imaging examination. Sometimes, our early studies needed even 70 min in addition to the MRS protocol. Usually, patients with acute or subacute stroke are severely sick and not very compliant. Frequently, head movement during the MRS occurred, which will corrupt data, spoiling or at least complicating a reasonable evaluation. Reduc-
tion of measurement time and optimized automatic adjustments for the preparation period are therefore essential for a successful MRS protocol. The latter has been addressed in the modern scanners by use of image guided shimming procedures and implementations of routines for automatic adjustments of water suppression. These tools can reduce the preparation time to less then 5 min.
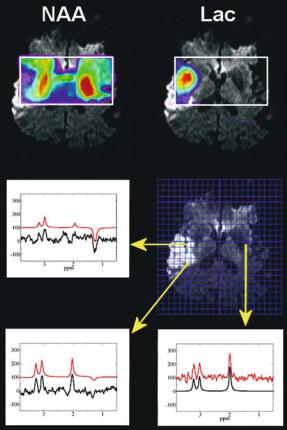
The rather extensive acquisition times required for the complete k-space can also be reduced. Without significant loss in spatial resolution, a 28×28 matrix can be recorded and extrapolated to 32×32 by adding zeroes before Fourier transformation, which will reduce the total acquisition time to 20 min. Selection of a circular (elliptical in case of rectangular FOV) k-space area centered around the origin, will save another 25% of acquisition time without seriously affecting the spatial resolution (Maudsley et al. 1994). The use of a rectangular FOV could also save up to 30% (Golay et al. 2002) resulting in a total acquisition time between 10 and 15 min. Further reduction in acquisition time can be achieved with fast imaging techniques like echo planar spectroscopic imaging (EPSI) (Posse et al. 1995) or multiple spin-echo spectroscopic imaging (MSESI) (Duyn et al. 1995; Duyn and Moonen 1993). These techniques scan more than one phase encoding step for a single excitation pulse, providing the respective acceleration factors. In a recent study (Stengel et al. 2004), our group could show that quantification of NAA and Lac concentrations can be obtained with 0.75×0.75×1.00 cm3 resolution with a total acquisition time of 6 min using MSESI. A typical result of such an examination is shown in Fig. 11.4. Please note that due to the short sampling period at 144 ms echo repetition time the spectral resolution is rather limited, allowing detection of separate signals only for NAA and lactate. However, these metabolites are carrying the most valuable information about the infarcted area.
11.3.3
Partial Volume Effects Due to Low Resolution
Even with the application of the above mentioned fast imaging techniques, the spatial resolution is still limited by the minimum S/N which can be achieved in the time reserved for the spectroscopic examination. We feel that with the currently available instrumentation the maximum resolution should be around 0.6 cm3. Representative spectra obtained with this resolution at 3 T magnetic field strength
MR Spectroscopy in Stroke |
175 |
are shown in Fig. 11.3. Metabolite concentrations from lesion smaller than the grid resolution will be affected by the concentration in the surrounding tissue and changes may be masked, i.e. Lac will be underestimated and NAA overestimated. However, since a slight increase above the background noise can be easier detected than signal variation of rather intensive signals, increased Lac can be observed in infarcted lesion with a size below the nominal resolution. Partial volume effects should also be taken into account when absolute quantification of spectroscopic data is considered (see below).
11.3.4
Evaluation of Metabolite Concentrations
Spectroscopic data reflect the concentration of a subset of brain metabolites. The accuracy of the related information depends crucially on the approach used for data quantification. Generally, the spectrum is evaluated by measuring the area under the metabolite signals. This can be done either by numerical integration of metabolite peaks in phased (real) or magnitude (modulus) spectra, or by using more sophisticated tools which basically perform a nonlinear fit of the entire spectrum. Depending on the tool, the fit is performed in the time domain [jMRUI (Naressi et al. 2001), offline] or frequency domain [online processing tools on
Fig. 11.4. Fast spectroscopic imaging of stroke. SI maps of lactate and NAA. Metabolite intensities are plotted as color-coded overlay on diffu- sion-weighted images. Intensities were obtained by numerical integration of the peak areas defined in the two spectra below. Data were acquired with the multiple spin echo SI sequence (7 min acquisition time), thus signal resolution is considerably reduced compared to single voxel spectra in Fig. 11.2 or conventional CSI in Fig. 11.3. (Data courtesy of A. Stengel)
the scanner console, LC-Model (Provencher 1993), offline]. All methods report signal intensities, which are proportional to the respective metabolite concentration in the volume of interest (VOI). Figure 11.5 shows the result of an online analysis of a SVS spectrum with the scanner software while red lines in the representative spectra of Fig. 11.3 depict calculated spectra of an offline analysis using jMRUI. Conversion of these hardware specific units to absolute concentrations (i.e., mmol/l) requires a set of correction factors which depend on the used pulse sequence, hardware parameters like signal amplification and coil loading, relaxation times (T1, T2) of the metabolites, as well as fractions of GM, WM and CSF in the VOI (partial volume effects). Hardware parameters can be corrected for by using either the so-called phantom replacement method (Michaelis et al. 1993) or scaling relative to the water signal (Barker et al. 1993). The water must be recorded in a separate measurement, either as a separate CSI data set or by an imaging sequence with proton density contrast. Relaxation terms for regular (healthy) tissue are available from several publications (e.g., Frahm et al. 1989b; Kugel et al. 2003). Changes due to pathological alterations may be less than 30% (Gideon and Hendriksen 1992; Kettunen et al. 2004). Correction for partial volume effects require at least one more additional imaging sequence and further calculations. A rather quick method which only takes into account
176 |
H. Lanfermann and U. Pilatus |
Fig. 11.5. Single voxel spectroscopic data at 3 T field strength. Same patient as presented in Fig. 11.3 (71-year-old man). The red line and signal intensities are results of an online frequency domain fit using the manufacturer provided software on the console (Siemens Allegra, Siemens, Erlangen, Germany). Images on the right show the voxel position in T2-weighted (transversal and sagittal) and diffusion weighted (transversal) images
the CSF fraction was described by Horska et al. (2002) while analysis of GM, WM, and CSF fraction requires tissue segmentation which can be very time consuming and are not applicable when immediate results are needed for a therapeutic decision. Therefore, a thorough data evaluation in terms of absolute concentrations should be reserved for research studies aimed at metabolic differences between different groups of patients (e.g. different size of infarct, different treatment) and longitudinal studies, while for diagnostic purposes in acute stroke a semi-quantitative approach should be sufficient. This can easily include correction for hardware sensitivity using either the phantom replacement or water reference scaling method where the phantom replacement method is not applicable with receiveonly coils. Furthermore, relaxation corrections can be performed using parameters for healthy tissue. By inspection of a VOI with no CSF (preferentially WM) in a non-infarcted area the overall accuracy of the data can be evaluated. Immediate information of the extend of concentration change can then be visualized in the SI metabolite map. However, one should be aware of artifacts (see below).
11.3.5
Artifacts in Metabolite Maps
Spectroscopic imaging data are frequently visualized as metabolite maps, i.e. for each metabolite the concentration is displayed either as a gray image or
as a color-coded overlay on an anatomical image. While this provides the most intuitive picture of the results, special care should be taken when interpreting these maps. The physician should be aware of the method used to calculate the metabolite maps: are they based on a simple integration of marked metabolite specific regions or was a fitting routine involved. Which processing steps were performed (baseline correction, frequency correction to account for susceptibility changes) before the final signal analysis was executed? All these points will affect the measured concentration, but can not be critically discussed based on the simple metabolite map. Local field inhomogeneities due to deposits of paramagnetic hemosiderin, can shift and distort signals spoiling the applied automatic data analysis algorithm. Especially for voxels crucial for diagnostic decision, a careful inspection of the entire spectrum is required in order to exclude artifacts, which may have caused the concentration change. Lactate metabolite maps are prone to contamination by lipids. Intensive lipid signals originating from fat deposits in the skull base and orbit can misleadingly be interpreted as high lactate in brain tissue. This may happen if the patient has moved during the examination so that lipid containing structures were inside the selected volume at least for a short period of time. Lipid signals can be easily distinguished from lactate, since only lactate shows a doublet signal (i.e., two peaks of identical intensity separated by 7.4 Hz) which may be inverted at an echo time of 144 ms (inversion is
MR Spectroscopy in Stroke |
177 |
not detectable in magnitude spectra). At B0 field strength of 3 T, the doublet structure of lactate may be less visible due to increased line broadening at higher field strength but signal inversion can still be exploited for discrimination of lactate from lipid (see Figs. 11.3, 11.5).
11.4
Biochemical Alterations in Cerebral Infarcts
The infarcted area shows reduced concentrations of NAA, creatine, and choline compounds in single volume spectra as well as in one and two dimensional SI. An intensive signal of lactate could appear as well. The analysis of underlying biochemical processes is based on the following assumptions for the main observable metabolites:
•NAA is a marker for intact neurons
•Choline compounds are related to membrane turnover metabolism
•Creatine compounds are related to energy metabolism
•Lactate indicates insufficient oxidative phosphorylation by the TCA cycle. In this case, the pyruvate which is produced by glycolysis can not be transferred to the TCA cycle and is converted into lactate.
Metabolic changes occurring up to day 35 after stroke are presented in Fig. 11.6. Reduced NAA in the infarcted area is mainly detected in studies which include a significant fraction of patients with subacute infarct (Berkelbach van der Sprenkel et al. 1988; Bruhn et al. 1989; Duijn et al. 1992; Hugg et al. 1992; Lanfermann et al. 1995; Felber et al. 1992; Graham et al. 1995). Our recent publication with acute or hyperacute infarct patients (Stengel et al. 2004) indicate that NAA may not be a reliable marker for neuronal damage during early stage of stroke, a finding which confirms previous HPLC data of Sager et al. (1995).
Usually, NAA reduction in the subacute phase of stroke is accompanied by a decrease in choline and creatine compounds. However, the decrease is less significant. Duijn et al. (1992) could detect 47% remaining choline and 37% remaining creatine in a patient population with mean time after infarct of 400 days. Our own studies of acute and subacute infarcts showed even less pronounced decrease (down to 65% for choline and 69% for creatine) for infarcted areas larger than 2 cm diameter and a
median time after infarct of 6.0 days. The concentrations dropped to 42% in the subacute phase indicating that remaining creatine and choline signals are predominantly a function of the time after infarct. A more detailed analysis comparing signal reduction in different areas of the infarct revealed more pronounced decrease of NAA compared to the other compounds in areas at the rim of the lesion. This would account for the existence of areas where ischemia had caused neuronal damage, but glial cells are still viable (Duijn et al. 1992; Hugg et al. 1992). Even an increase of choline had been observed. While there is no validated rational for this finding, one could speculate that enhanced membrane turnover rates occur in these areas, may be as result of repair mechanisms.
Elevated lactate seems to be the most reliable metabolic marker of acute stroke. Significantly increased lactate in ischemic tissue was observed within 30 s (Hetherington et al. 1994). Lactate is generally observed in the infarcted area which is defined by the diffusion lesion (Monsein et al. 1993; Nakada et al. 1991), but frequently, it can also be detected outside this lesion. In hyperglycemia, the elevated lactate concentration is correlated with blood glucose concentration (Parsons et al. 2000, 2001, 2002). While augmented lactate in areas with depletion of oxygen supply can be easily rationalized in terms of basic biochemistry, it’s persistence for several weeks (Houkin et al. 1993; Lanfermann et al. 1995) needs further discussion and may critically depend on the time and extent of reperfusion. Regions adjacent to the infarcted area with ongoing hypoperfusion (the so-called penumbra, see below) may be the source of a permanent lactate production. However, MRSI data do not support this rational since areas of elevated lactate were rather homogeneous inside the infarcted tissue with no enhancements at the rim. For subacute strokes, slightly increased lactate concentrations were also observed in contralateral hemisphere and the ventricles (Duijn et al. 1992; Hugg et al. 1992; Lanfermann et al. 1995).
Several publications (Hugg et al. 1992; Levine et al. 1992; Sappey-Marinier et al. 1992) report increased pH values and augmented lactate in subacute infarcts. It has been speculated, that lactate, which has been produced during the first hour of ischemia can persist in dead cells and will be detected with 1H-MRS. Furthermore, macrophages and microglia which infiltrate the infarcted area after the third day rely primarily on anaerobic glycolysis and may be responsible for the elevated lactate (Karnovsky 1962; Petroff et al. 1992).
178 |
H. Lanfermann and U. Pilatus |
a |
b |
c |
d |
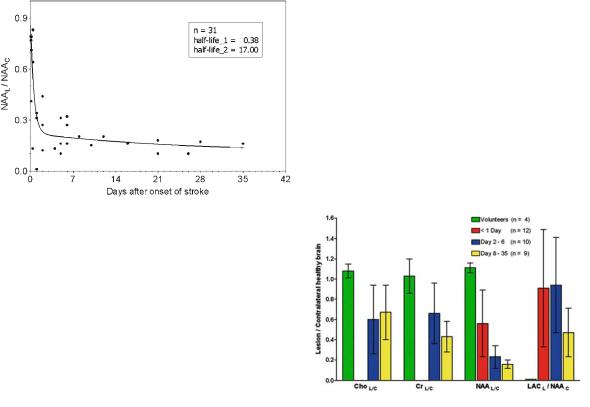
Fig. 11.6a-d. Metabolic changes in infarcted areas as a function of time after stroke onset: a NAA decrease. NAA concentration was referred to NAA peak intensity of the contralateral (healthy) side. The line shows a nonlinear fit of the data assuming a biexponential decay. The resulting half-lives were 0.38 days for the fast process and 17 days for the slow process. b Lactate concentration. The concentration was estimated by referring to the NAA signal of the contralateral (healthy) side. The straight line shows linear regression analysis. c Creatine concentration. The concentration was estimated referring to the creatine peak intensity of the contralateral (healthy) side. The straight line shows linear regression analysis. d Summary of (a-c) in a bar graph and comparison to healthy volunteers. Data for day 1 were calculated from our recently published data (Stengel et al. 2004). [With gratitude to H. Kugel (Münster, Germany) for support in acquisition and analysis of subacute data]
11.5
Clinical Impact of 1H-MR Spectroscopic Imaging
Spectroscopic imaging is the only method which provides information on changes occurring during a very early stage of stroke up to neuronal cells death. A consistent interpretation of the data can be based on the following assumptions which are corroborated by most experiments:
•Increase in lactate indicates hypoxia, which is he first event in ischemic tissue
•Decrease in NAA indicates neuronal cells death. Tissue with NAA below a specific threshold should be irreversibly damaged.
Considering the final outcome of stroke as a cascade of consecutive biochemical events, step 1 may
be considered as the initial physiological reaction to limited oxygen supply, which not necessarily indicates serious cell damage. On the other hand, NAA decrease reflects neuronal cell death as result of either serious ischemia (i.e. complete cessation of perfusion), or long term less severe ischemia, but also following reperfusion after a period of ischemia.
With the development of thrombolytic therapies (NINDS Stroke-Trial 1995; Hacke et al. 1995) there is a high demand for new methods which provide detailed information on the infarcted parenchyma, especially for those methods which enable characterization of tissue that is potentially salvageable by reperfusion therapy. Since the concentration of key metabolites may play a pivotal role, MR spectroscopy may have an impact on treatment decisions.
Basic pathophysiology of cerebral ischemia and infarcts was first studied using PET. In rather exten-