

Книги по МРТ КТ на английском языке / Magnetic Resonance Imaging in Ischemic Stroke - K Sartor R 252 diger von Kummer Tobias Back
.pdf44 |
T. Back |
tum) and at 3 h post insult in the cortex. However, even in the center of the affected cortical regions, the majority of cells appears to be intact through the initial 6 h (Bartus et al. 1995). About 8-12 h after onset of ischemia, typical features appear that indicate irreversible tissue damage such as axonal swelling, eosinophilic, so-called red neurons, and the occurrence of neuronal and astrocytic ‘ghost cells’ (Fig. 4.3). Based on those and similar findings (see above) early lesion growth may differ from late growth (> 12 h post occlusion). This concept assumes that at later stages of the disease process morphologic alterations become irreversible, while very early changes such as astrocytic swelling with otherwise normal appearing neuropil and preserved neurons are considered as potentially reversible.
4.1.3
Thresholds of Cerebral Blood Flow
The working brain consumes about one-third of its energy for maintenance of synaptic transmission, one-third for transport of sodium and potassium, and one-third for preserving its structural integrity. In pathophysiological conditions, such as hypoxia or ischemia, the hierarchy of energy-dependent cell functions results in a characteristic sequence of events. The gradual decline of oxygen delivery induced functional deficits when cerebrovenous pO2 fell below 60% of control in a model of hypoxic brain injury. With a further reduction below 50% of control structural damage occurred if this condition was prolonged (Opitz and Schneider 1950). In 1977, Astrup and colleagues extended the threshold concept of critical levels of hypoxia to cerebral ischemia (Astrup et al. 1977). They established precisely defined thresholds of CBF that are needed to support synaptic transmission in the upper flow range (electrical function) and ion homeostasis in the lower (structural integrity). Ischemic brain regions with flow rates that ranged between those two thresholds have been termed “ischemic penumbra” in analogy to the half-shaded zone around sunspots. The penumbra was characterized as a condition which causes functional suppression without structural damage (Astrup et al. 1981) and represents tissue in a state at-risk which bears the potential of complete recovery in terms of function and morphology. Alternatively, ongoing ischemia and/or the occurrence of further events in the pathophysiological cascade may eventually turn the ischemic penumbra into necrotic tissue.
The concept of critical flow thresholds provides the rational basis for attempts to salvage the ischemic penumbra. In the clinical environment, the successful application of thrombolysis in stroke patients (NINDS Study Group 1995) could be shown to be related to this issue: fair clinical outcome correlated positively with early recanalization (von Kummer et al. 1995) and even small improvements of local CBF in the 10% range predicted the reversibility of ischemic tissue changes (Butcher et al. 2003).
Following the occlusion of a major cerebral artery, the topographic features of the consecutive ischemic injury depend in the first instance on the extent, severity and duration of the perfusion deficit. The extent of ischemia is critically determined by the distribution of collateral blood vessels (varying greatly among human individuals and animal species and strains). In an MCA occlusion study, spontaneous single-cell activity and local CBF were measured to establish a discriminant curve relating severity and duration of ischemia to the resulting pathological outcome (Heiss and Rosner 1983). Neurons exposed to CBF ≤ 0.14 ml/g/min for more than 45 min recovered poorly. By contrast, even extreme degrees of ischemia – if followed by recirculation within 20 min – permitted recovery. It is, however, well accepted that brain tissue suffering from high-grade ischemia for sufficient lengths of time (> 60 min) will not survive.
Studies in primates employing MCA occlusion have established that local CBF values below 0.10-0.12 ml/g/min lasting 2 h or longer are associated with consistent infarction, whereas higher flows avert irreversible injury (Jones et al. 1981; Morawetz et al. 1978). In brain ischemia of cats, damage occurs below a flow rate of 0.15 ml/g/min (Strong et al. 1983). In the rat, flow rates below 0.25 ml/g/min produced well demarcated infarcts (Tyson et al. 1984) a threshold value higher than the one defined in larger species, very likely related to the higher neuronal density of rat brain. Interestingly, spontaneously hypertensive rats are more susceptible to an ischemic insult than normotensive ones. In a hypertensive strain, overt infarction occurred below a CBF threshold of 0.50 ml/g/min probably due to inadequate collateral circulation (Jacewicz et al. 1992).
Of greater therapeutic relevance is the zone lying peripheral to the region of dense ischemia and perfused at somewhat higher CBF levels: the ischemic penumbra. In baboons subjected to MCA occlusion, CBF was measured along with the extracellular potassium concentration and sensory evoked poten-
Insights from Experimental Studies |
45 |
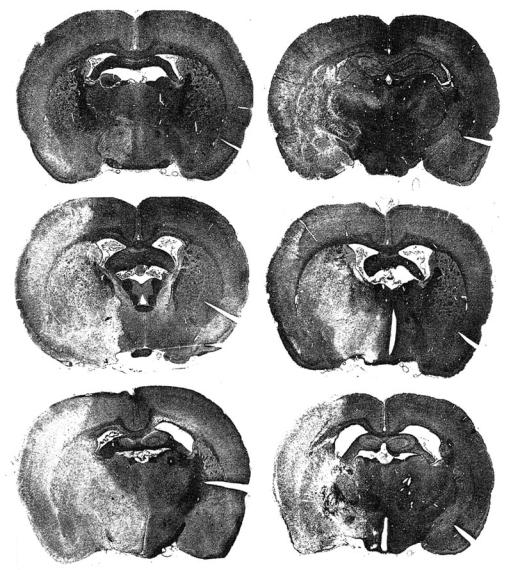
Infarct maturation
3 h |
6 h |
a |
|
b |
12 h |
24 h |
c |
|
d |
3 d |
7 d |
e |
|
f |
H & E, ×65
Fig. 4.3a-f. The phenomenon of infarct maturation is shown as macroscopic appearance on hematoxylin-eosin stained coronal brain sections. Right permanent middle cerebral artery occlusion was performed in rats and histology obtained between 3 h and 7 days. Note the sparse changes at 3 h and lesion shrinkage at 7 days. [Reproduced with permission from Garcia et al. (1993)]
tials (Astrup et al. 1977). In the borderzone around the densely ischemic core, the evoked potentials were affected when local CBF decreased below 0.20 ml/g/ min (the upper threshold). A blood flow reduction below 0.15 ml/g/min induced complete electrical failure, but membrane function was still preserved as evidenced by near-to-normal extracellular potassium concentrations. The lower threshold (0.06 ml/g/ min) was characterized as the CBF value below which massive release of potassium occurred that indicated
irreversible loss of membrane function and subsequent cell death. The absolute CBF values defining the upper and lower thresholds of transmission or membrane failure, respectively, show a considerable variation depending on the method of flow measurement, the animal species, the ischemia model and the type of anesthesia used (Astrup et al. 1977; Branston et al. 1977, 1979, 1984; Heiss and Rosner
1983; Hossmann and Schuier 1980; Morawetz et al. 1978; Strong et al. 1983; Tamura et al. 1981).
46 |
T. Back |
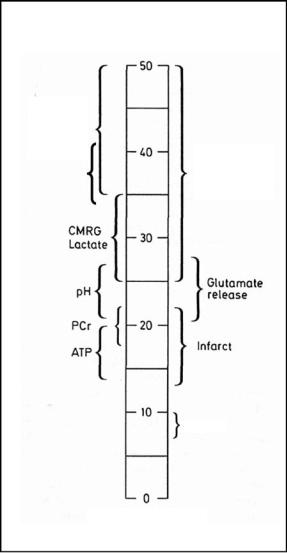
Therefore, the CBF thresholds should be expressed in percent of control for better comparison: the upper one being about 40%, the lower one 12%-15% of control, respectively. Of note, the concept of flow thresholds could be successfully extended to a variety of physiological functions as presented in Figure 4.4 (Hossmann 1994), including pH regulation and tissue water diffusion. The simultaneous measurements of CBF, local ATP (adenosine triphosphate) content, pH and DWI in acute MCA infarcts revealed that tissue diffusion was disturbed below a CBF threshold of 0.34 ml/g/min (30 min post occlusion) and 0.41 ml/g/min (2 h post occlusion) which was distinctly higher than the threshold values for ATP depletion (0.13 ml/g/min after 30 min, and 0.19 ml/g/min after 2 h) (Kohno et al. 1995b). Most of the CBF thresholds, e.g., for overt infarction, ATP homeostasis or glutamate release, are also a function of time and rise with increasing durations of ischemia (Kohno et al. 1995b). This means that, for example, rodent brain with a CBF of 0.20 ml/g/min may escape infarction at 2 h post insult, but gets infarcted 1 h later if blood flow is not improved by then (Hossmann 1994). However, there are exceptions to this rule: the flow threshold for maintenance of protein synthesis does not change with ongoing ischemia (Hossmann 1994).
Viability thresholds
Protein synthesis Selective gene expr.
|
|
|
|
|
|
|
Selective |
||
Water |
|||||||||
di usion |
|
|
|
|
neuronal loss |
||||
|
|
|
|
|
|
|
|
|
|
|
|
|
|
|
|
|
|
|
|
|
|
CMRG |
|
|
|
|
|||
|
|
Lactate |
|
|
|
|
|||
|
|
|
|
|
|
|
|
Glutamate |
|
|
|
|
|
|
|
|
|
||
|
pH |
|
|
|
|
release |
|||
|
|
|
|
|
|
|
|
||
|
|
|
|
|
|
||||
|
PCr |
|
|
|
|
|
|||
|
|
|
|
|
|
|
|||
|
|
|
|
|
|
|
|
|
|
|
|
|
|
|
|
|
|
|
|
|
|
|
|
|
|
|
Infarct |
||
|
|
ATP |
|
|
|||||
|
|
|
|
|
|
|
|
||
|
|
|
|
|
|
|
|
|
|
K+, Ca2+
4.1.4
Cerebrovascular Reactivity and Functional Activation
The cerebral circulation is characterized by two phenomena that play a critical role in the presence of ischemic insults: (i) the ability of vessels to react to a variety of stimuli (the prototype of which is CO2) by vasodilation or vasoconstriction, termed vasoreactivity, and (ii) the ability of the cerebral circulation to keep cerebral perfusion pressure constant within a wide range of the systemic arterial pressures, named autoregulation of CBF (reviewed in Hossmann 1987). Intact cerebral autoregulation and vasoreactivity is the basis for more complex responses that participate in the functional activation of distinct cortical regions triggered for example by sensory or motor functions. The development of blood oxygenation level-dependent (BOLD) imaging is based on the robust local blood flow increase that is triggered by local electrical activity. The BOLD effect allows us to visualize cortical representation fields in humans (Belliveau et al. 1991) and animals (Hyder et al. 1994). The coupling mechanism involves the inter-
CBF in % of control, in rodents ≈ ml/100 g/min
Fig. 4.4. Bar graph of viability thresholds of cerebral blood flow for a variety of functions and metabolites. Note that selective neuronal loss occurs at consistently higher flow values than overt infarction. CMRG, cerebral metabolic rate of glucose; PCr, phosphocreatine; ATP, adenosine triphosphate. [Adapted and reproduced with permission from Hossmann (1994)]
action of a complex system of biochemical and neurogenic mediators that are subject to pathological interference. Therefore, pathological processes may modulate both, the effect of functional activation on metabolism and the response of blood flow to the change in local metabolic activity.
Blood flow regulation systems are disturbed in acute focal brain ischemia when an increase in blood pressure, but not of arterial PaCO2, causes a rise of CBF (Shima et al. 1983). Disturbances of flow regulation are not confined to the ischemic focus
Insights from Experimental Studies |
47 |
but may affect other parts of the hemisphere. The area with impaired autoregulation is larger than that of reduced CO2 reactivity (Russell et al. 1970). The relationship between CBF and arterial blood pressure in focally ischemic brain areas is highly dependent on the severity of ischemia: autoregulation is lost in a gradual manner until CBF falls below 30% of normal (Dirnagl and Pulsinelli 1990). After experimental MCA occlusion, CO2 reactivity partially recovered after 5 to 12 days (Waltz 1970). In another animal model, a complete recovery was already observed within 2 days (Dijkhuizen et al. 2001), but at this timepoint functional activation was still suppressed in the perilesional regions. At 2 weeks after the insult, signs of forelimb activation (that had recovered at this time) were evident in the infarct borderzone, both in and adjacent to the sensorimotor cortex. This finding may indicate the extension of forelimb representation fields into adjacent cortical areas during restoration of sensorimotor function (Dijkhuizen et al. 2001). We have, therefore, to take into account that functional plasticity of the cortex may interact with recovery patterns of vascular regulation.
In global cerebral ischemia different pathophysiological observations were made. Short periods of global ischemia cause extracellular acidosis that – as a potent vasodilator – induces a hyperemic phase in which autoregulation and CO2 reactivity are both severely disturbed (Waltz and Sundt 1968). Frequently, brief hyperemia is relieved by a lasting phase of hypoperfusion (down to 50% of control) when autoregulation recovers, but vasoreactivity remains diminished (Hossmann 1997). Postischemic hypoperfusion that is characterized by an increased vascular tone, is not coupled any longer to metabolism and leads to the dissociation between oxygen supply and consumption, thereby inducing a gradual increase in oxygen extraction. Normal oxygen extraction fraction amounts to about 35% and may rise up to 80% which in turn stimulates anaerobic glycolysis. As a result, secondary lactacidosis and energy depletion may occur. Causal factors include the expression of adhesion molecules and the generation of free radicals, possibly also the down-reg- ulation of endothelial nitric oxide (NO) synthase. It is conceivable that under those conditions, the coupling between blood flow and metabolism can be disturbed on two sides: functional activation may not trigger any longer a sufficient increase in local metabolism and/or metabolic activation may not be coupled to a sufficient increase in local CBF any more. These considerations are of particular impor-
tance for studies that utilize BOLD imaging to study perilesional brain areas.
4.1.5
Mechanisms of Injury
It is beyond the scope of this chapter to review the current knowledge of potential mechanisms of ischemic injury. However, we wish to point to key processes that can be also addressed by experimental studies applying MR methods. Here, our interest will be focussed on the pathophysiology of focal ischemia. Brain ischemia results in a cascade of events that affect the brain in a certain hierarchy of physiological functions (e.g., based on flow thresholds) and in a certain time sequence of processes resulting in very peculiar patterns of lesion evolution. As reviewed by Dirnagl et al. (1999), mechanisms of injury may be roughly divided into the following categories: (1) rapid excitotoxic mechanisms including the occurrence of spreading depression-like phenomena in the infarct border,
(2) slower inflammatory responses triggered by the generation of oxygen free radicals, and (3) proapoptotic processes that may lead to a very delayed type of cell death, closely related to mitochondrial dysfunction (Fig. 4.5). Other potential causes for lesion evolution (studied mainly in focal cerebral ischemia) include the time-dependent increases in microcirculatory flow disturbances (Hakim et al. 1992; Kohno et al. 1995b), the glucose utilization/ blood flow uncoupling in the infarct border (Back et al. 1995; Nedergaard et al. 1986) and the occurrence of severe lactacidosis in the infarct core (Back et al. 1994a, 2000b; Kobatake et al. 1984). It has to be mentioned that a vast variety of molecular responses to ischemia are under investigation the pathophysiological significance and role of which are only partially understood. For instance, serine proteases like tissue plasminogen activator, plasmin, and thrombin may play a role through activation of protease-activated receptor 1 (PAR-1) (Junge et al. 2003). Other interesting molecular targets are calcineurin, cytokines, apoptosis-inducing factor, nitric oxide, matrix metalloproteinases, and acidsensing calcium permeable ion channels.
In experimental stroke, the zone of dense ischemia leads to the rapid exhaustion of substrates, particularly oxygen and glucose. The impaired energy yield cannot maintain the ion pumps so that cells loose their membrane potential (anoxic depolarization of glia and neurons). As a consequence, volt-

48
Contribution to damage
T. Back
Mechanisms of ischemic injury
Excitotoxicity
PIDs |
|
|
|
|
|
|
Inflammation |
|
|
|
Fig. 4.5. Timecourse and impact of mecha- |
|
|
|
|
|
|
|
|
Apoptosis |
|
|
nisms that contribute to ischemic damage. |
|
|
|
|
Note that inflammatory responses and |
|
|
|
|
|
|
|
|
|
|
|
|
programmed cell death are processes of |
|
|
|
|
|
the subacute and chronic phase. PIDs, peri- |
|
|
|
|
|
infarct depolarizations. [Adapted from |
0.5 1 |
2 |
7 |
14 |
(days) |
Dirnagl et al. (1999)] |
age-dependent calcium channels are activated and excitatory amino acids are released into the extracellular space where the presynaptic reuptake is disturbed. What follows is the activation of NMDA receptors and other types of glutamate receptors that contribute to the accumulation of intracellular calcium and the influx of Na+ and Cl– via receptorassociated ion channels. A water hydrops of neurons can be observed that is associated with a dramatic (about 50%) decrease of the extracellular space. This early water shift from the extrato the intracellular compartment is believed to be the basis of disturbed water diffusion imaged by DWI. This very early form of cell edema has also be termed cytotoxic edema and is not coupled to major changes of the blood–brain barrier permeability nor to a large net increase in brain water. The latter does occur with very low flow rates less than 0.10 ml/g/min when brain water content increases steeply along with the increase in the tissue ratio of sodium/potassium (Hossmann 1987). This type of more delayed edema development is accompanied by a break-down of the blood–brain barrier and termed vasogenic edema (for details see Chap. 8). However, it has to be stated that ischemic brain edema is a complex combination of cytotoxic and vasogenic elements depending on the type of ischemia, the timepoint of observation and the severity of the ischemic impact.
We have seen that sodium enters the cells, but potassium is set free into the extracellular space where it induces irregular depolarizations, particularly in the surroundings of an ischemic focus. Such transient depolarizations travel over the cortex like classical waves of spreading depression of electrical activity (Back et al. 1994b; Leao 1944; Nedergaard and Astrup 1986). The number of such peri-infarct depolarizations (PIDs) correlated well with final
infarct size (Back et al. 1996; Mies et al. 1993) and could be effectively blocked by glutamate antagonists or initiation of recanalization that both reduced infarct volumes (Gill et al. 1992; Iijima et al. 1992; Schüler et al. 2001). By using repetitive DWI, the propagation and enlargement of the ischemic lesion, which is dependent on the occurrence of PIDs, has been demonstrated in a rat model of stroke (Busch et al. 1996; Takano et al. 1996). A recent attempt to measure similar changes in ADC (apparent diffusion coefficient of water) that would resemble PIDs in acute human stroke, was unsuccessful (Back et al. 2000a). Nevertheless, spreading depression has been irrefutably demonstrated in patients suffering from acute traumatic brain lesions (Strong et al. 2002). PIDs are closely related to cellular injury through mechanisms of excitotoxicity (Marrannes et al. 1988). The high number of glutamate receptors on the surface of cortical neurons but also in other parts of the brain explain that excessive glutamate release may over stimulate those neurons due to impaired clearance mechanisms for excitotoxic transmitters (Choi 1992).
Other factors that contribute to lesion growth are related to the progressive impairment of CBF and the associated derangement of glucose and energy metabolism (Back et al. 1998). A striking uncoupling between near-to-normal glucose utilization in the presence of compromised flow has been demonstrated in animal models of stroke (Back et al. 1995; Nedergaard et al. 1986). It seems unlikely that any brain tissue could survive this mismatch between energy demand and blood supply on longer terms. The high dependence of brain tissue on oxidative phosphorylation explains why primary or secondary energy failure is impending over flow-compromised areas. Another important pathophysiological factor
Insights from Experimental Studies |
49 |
is the excess generation of lactate due to the initiation of anaerobic metabolism. We have seen above that the increase in oxygen extraction above 50% is a strong trigger of anaerobic metabolism. As a result, lactate is excessively produced and may spread by diffusion over adjacent parts of the affected hemisphere. Together with hydrogen ions that stem from ATP hydrolysis, lactate contributes to the severe acidosis that may further damage neurons (Back et al. 1994a, 2000b). Apart from these acute metabolic changes, a large variety of molecular responses like the upregulation of immediate-early genes, the formation of stress proteins, the upregulation of proapoptotic proteins and inflammatory changes occur that may modify the final extent of damage in the subacute phase. However, we may assume that this modification does not account for changes in lesion volume exceeding the 5%–10% range in human stroke (Heiss et al. 1999).
4.2
Evolution of Ischemic Lesions
The insight into the dynamic nature of ischemic brain lesions has raised growing attention over the past few years. Distinct temporal and spatial patterns of lesion evolution have been described for two types of cerebral ischemia that differ in many pathophysiological aspects: namely conditions of focal and global cerebral ischemia.
i)Territorial brain infarcts, the prototype of focal cerebral ischemia, tend to enlarge in size during an ongoing period of hypoperfusion. This has been shown in animal models of stroke (Dereski et al. 1993; Garcia and Kamijyo 1974; Garcia et al. 1993; Gyngell et al. 1995; Kohno et al. 1995b) and in clinical human studies using MRI (Baird et al. 1997; Barber et al. 1998; Karonen et al. 1999; Neumann-Haefelin et al. 1999; Parsons et al. 2002). Almost half of the patients who presented with acute hemispheric stroke showed an increase in lesion size by > 20% occurring over the initial 7 days post stroke (Baird et al. 1997). The lesion growth is clinically important and is associated with poor outcome. A better understanding of the underlying pathophysiological changes involved may guide future therapeutic interventions as reviewed in Chap. 3.
ii)In conditions of global cerebral ischemia, however, the changes are more complex. As shown in animal models, periods of global ischemia can
either lead to the recovery or, alternatively, to secondary deterioration of the tissue status accompanied by a global reduction of energy metabolism (Hossmann et al. 1994; Paschen et al. 1983). The time course of changes in the brain parenchyma of patients with ischemic-anoxic brain damage after cardiac arrest is not well studied so far (Arbelaez et al. 1999; Schaafsma et al. 2003; Wijdicks et al. 2001). Repeated MRI studies may disclose parenchymal changes in those patients that are subtle and patchy in nature targeting selectively vulnerable neurons as reviewed in detail in Chap. 16.
4.2.1
Global Ischemia
Global brain ischemia results from transient low CBF below 0.5 ml/100g/min or severe hypoxia to the entire brain (Hossmann 1987; Siesjö 1988). The causes are mostly cardiac arrest, near drowning and hypotension as is often seen as a consequence of surgical procedures. After a few minutes of cardiac arrest, hypoxic encephalopathy becomes irreversible. The precise duration of global ischemia necessary for irreversible neuronal damage in humans is unknown (Heiss 1983; Zivin 1997), but for the most vulnerable areas it is about 5 min. Many animal models have confirmed cellular death within a few minutes after global ischemia onset (Siesjö 1978). On the other hand, Hossmann et al. demonstrated that global cessation of CBF in animals of up to 1 h can be followed by recovery of electrophysiological function and, in a few animals, recovery of neurological function (Hossmann et al. 1987; Hossmann and Zimmermann 1974). It remains unclear how neurons can respond so differently after an ischemic insult.
Besides the variable functional outcome after ischemia in animal models, it is well established that specific neuronal populations within an individual vary substantially in ischemic tolerance. Neurons in the CA1 region of the hippocampus and other distinct cellular populations of the caudate, thalamus, neocortex and cerebellum are selectively vulnerable to relatively brief periods of ischemia (Kirino and Sano 1984; Siesjö 1988). The reasons for this phenomenon are not fully elucidated, but for example in cerebellar Purkinje cells it could be shown that a reduced level of aldolase may trigger energy failure after brief periods of anoxia (Welsh et al. 2002). Changes in microcirculation, as seen in focal stroke,
50 |
T. Back |
do not occur in global ischemia. This may alter the dynamics, especially in the reperfusion phase after transient ischemia, and explain why models of global ischemia cannot fully represent stroke pathophysiology (Hossmann 1987; Kirino and Sano 1984; Smith et al. 1984).
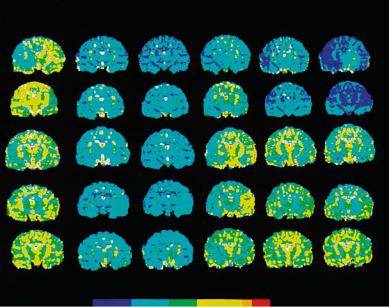
Studies by Hossmann et al. have shown that prolonged global ischemia may result in secondary deterioration during the reperfusion phase followed by depletion of energy metabolites, acidosis and a dramatic increase in lactate content (Hossmann et al. 1994). However, in some animals recovery can be observed that is dependent on successful reperfusion. This pathologic condition that imitates cardiac arrest in man, results in a rapid (< 10 min) and marked (68% of control) decrease in the ADC when measured by repeated MR diffusion imaging (Hossmann et al. 1994) (Fig. 4.6).
If we apply the lesion assessment as used in focal ischemia, one would estimate a nearly 100% lesion spread after 1 h of global ischemia (visible after the initial 10 min) that may or may not resolve during a 180-min reperfusion period. Short-lasting periods of global ischemia, e.g., the four-vessel occlusion model in rats (Schmidt-Kastner et al. 1989), provoke a circumscribed damage to the CA1 sector of the hippocampal formation that appears after 3 days. The number of dead CA1 neurons has been shown to increase from 3 to 7 days post insult (Böttiger et al. 1998). Other selectively vulnerable regions in global ischemia are the thalamus, the basal ganglia and the cortical layers 3–5. Due to the subtlety of his-
topathologic changes that consist mainly of selective neuronal injury of the delayed type, it is difficult to assess lesion size in quantitative terms. Therefore, in the literature no solid numbers for affected volumes of this process are reported.
In global ischemia, cell death occurs due to apoptosis, and not necrosis as seen in focal ischemia (Böttiger et al. 1998; Ouyang et al. 1999). The morphological and imaging data on cardiac arrest patients are scarce (Arbelaez et al. 1999; Berek et al. 1995; Grubb et al. 2000; Schaafsma et al. 2003; Wijdicks et al. 2001) (see also Chap. 16). Arbaelez et al. (1999) published MR findings in a series of patientswithglobalcerebralhypoperfusionfollowing cardiac arrest. The anoxic-ischemic tissue changes were depicted in the acute and early subacute phase (up to 14 days post insult) on DWI. The same alterations were not visible on T1or T2-weighted images or seen at a later stage of the disease (Arbelaez et al. 1999). To date, systematic longitudinal studies available to answer the questions of timepoint and localization of brain lesion appearance following human cardiac arrest are nearly lacking. However, there is clinical evidence that longer durations of global circulatory arrest exceeding the resuscitation time of ~ 10 min, almost uniformly result in fatal outcome with generalized brain edema, obscuration of grey–white matter junctions and widespread laminar necrosis of the cortex. In a series of ten patients who suffered from anoxic-ischemic coma, most individuals showed diffuse signal abnormalities in DWI and fluid-attenuated inversion recovery
|
Ischemia |
Recirculation |
|
Control |
10 min |
50 min |
20 min 60 min 180 min |
ADC |
1.5 |
4.25 |
7.0 |
9.75 |
12 x 10-4 [mm2/s] |
Fig. 4.6. Quantitative maps of the apparent diffusion coefficient (ADC) in cats subjected to 1-h complete cerebrocirculatory arrest followed by 180 min of recirculation. Each row represents one animal. The pre-ischemic condition is shown by the first left column. Images show a central coronal slice that was measured at six time points per animal. Note the early decline of ADC after onset of ischemia and the rapid post-ischemic normalization in the lower three rows indicating recovery in those animals. The upper two rows depict animals that did not recover during the reperfusion phase. [Reproduced with permission from Hossmann et al. (1994)]
Insights from Experimental Studies |
51 |
(FLAIR) images that affected most severely areas of high vulnerability (cerebellum, hippocampus, thalamus, frontal and parietal cortices) (Singhal et al. 2002). Especially alterations in DWI seemed to correlate well with the distinct neuropathological features of anoxic-ischemic encephalopathy.
Another study used PET to measure perfusion and glucose metabolism after cardiac arrest (Schaafsma et al. 2003). It revealed a nearly 50% decrease of glucose consumption, but was unable to detect patterns of metabolic or perfusion changes that would predict clinical outcome or imaging abnormalities. See Chap. 16 for detailed information on this matter.
4.2.2
Focal Ischemia
4.2.2.1
Comparison of Diffusion Imaging with Changes in Relaxation Times
In states of focal cerebral ischemia, repetitive MRI has elucidated the natural course of brain lesions which – as a regular phenomenon – show considerable lesion enlargement over time. This observation was made by using DWI in animal models with occlusion of the middle cerebral artery. To date, we have little information on the natural course of ischemic lesions that are of hemodynamic origin or the result
DWI
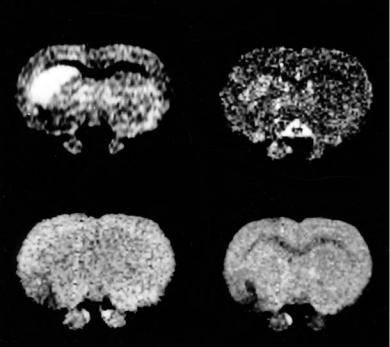
of small vessel disease. After the first publications on diffusion MRI of tissue water (Le Bihan et al. 1986), Moseley and coworkers (1990) could demonstrate that DWI offers a high contrast between normal and ischemic tissue, and that this contrast could be observed already several minutes after arterial obstruction (Moseley et al. 1990; Sevick et al. 1990). It became obvious that signal changes in DWI clearly preceded changes in T2-weighted images (Fig. 4.7). With a multi-slice approach it could be shown that over the initial 6 h both the signal intensity and the lesion volume increased over time (Gyngell et al. 1995; Hossmann and Hoehn-Berlage 1995). The increasing hyperintensity on DWI reflects the gradual decline of the apparent diffusion coefficient (ADC) that drops rapidly during the initial 30 min, thereafter decreasing more slowly along with an initial phase of rapid and afterwards slow lesion growth (Roussel et al. 1994). Figure 4.8 presents such an example in which the increase in affected tissue is visible on repeated DWI, but also the increase in signal intensity over time. The changes of ischemic lesion volume could be confirmed in a model of clot embolism of the MCA in rats by using repeated DWI. Compared to the lesion volume at 30 min, final lesion size at 8 h post occlusion had increased by ~ 70% (Brinker et al. 1999).
The quantitative measurement of the ADC has advantages over mere diffusion-weighting because
T2
T1 |
RHO |
Fig. 4.7. Coronal measurements of diffusion, proton density (RHO), T1 and T2 relaxation times 30 min after occlusion of the middle cerebral artery in a rat. Note the clear-cut striatal signal increase in the diffusion-weighted image (DWI) compared to nearly unchanged images of the other MR modalities

52 |
T. Back |
Serial multi-slice DWI
Control |
30 |
90 |
150 |
210 |
270 |
330 |
(min post-occlusion)
Occlusion
Fig. 4.8. Lesion development in permanent middle cerebral artery (MCA) occlusion in a rat measured by repeated MR diffu- sion-weighted imaging (DWI). Left column: Control condition pre-occlusion in coronal slices from posterior (top) to anterior (bottom). The arrow marks the timepoint of occlusion. Images shown in columns 2 to 7 are DWI (subtraction images) measured 30 to 330 min post-occlusion. Note the lesion growth and the increase in signal intensity within the lesion. (Courtesy Dr. M. Hoehn, Cologne)
influences of other MR parameters are eliminated. It requires the measurement of a whole set of images with increasing diffusion weighting (minimum: two) expressed by variable b-factors. Increased T2, for example, can be mistaken as a reduction of tissue diffusion. On the contrary, ischemia-induced T1 increases tend to diminish the contrast in DWI (with short recovery times). A disadvantage of ADC maps is that ischemic lesions present as “darker” brain regions that are not as easily depicted as hyperintense lesions in DWI. From experimental data there is good evidence that ADC values do not fall below
50% of control and that densely ischemic brain regions exhibit ADC values in the range of 60%-80% (for review see Hoehn-Berlage 1995). ADC above 80% is typically seen in the first hours of occlusion and/or in more peripheral borderzone regions of brain infarction (Back et al. 1994a; Jiang et al. 1993; Mintorovitch et al. 1991). Volume evaluations have to take into account that ADC values depend on the direction of the diffusion encoding gradient that is of particular importance for the study of white matter changes, but also affects grey matter (Hoehn-Berlage et al. 1995a). This effect has been
Insights from Experimental Studies |
53 |
termed anisotropy of tissue diffusion. Strategies of diffusion tensor imaging have elucidated in great detail this phenomenon.
The observation of relaxation times revealed that increases in T1 and T2 could be seen a few hours after onset of focal ischemia onset, but not as early as changes in DWI or ADC (Hoehn-Berlage et al. 1995a; Knight et al. 1994). This observation has been confirmed in stroke patients in whom DWI changes are observed as early as 40 min post insult (Yoneda et al. 1999). However, T2 signal changes occur in the subacute phase and are nearly always indicative of irreversible tissue damage. Thus, the discovery of very early diffusion changes in experimental brain ischemia has filled out the diagnostic gap of conventional cranial MRI or CT in acute stroke. So far, stroke clinicians had been forced to search for very subtle signs in CT (early ischemic signs like obscuration of the lentiform nucleus) or MRI (e.g., slight T2 hyperintensity, discrete swelling) to detect focal ischemia during the initital hours after onset of symptoms.
The further timecourse of ischemia-related changes in ADC and relaxation times reveals striking differences, too. Experimentally, the initial reduction of ADC returns to normal within 48-72 h in models of MCA occlusion and rises thereafter to supranormal values that normalize after about 1 week (Helpern et al. 1993; Knight et al. 1991). By contrast, the subacute increases in relaxation times reach their peak at 24-48 h and decrease slowly thereafter (Helpern et al. 1993; Knight et al. 1994). In human stroke, the timecourse of ADC changes appears to be similar, but in a somewhat retarded fashion: the minimum ADC has been observed 12-24 hours after onset, the pseudonormalization of altered diffusion between 7 and 14 days and clearcut elevations of ADC from 30 days onward (Warach et al. 1992, 1995). Both in humans and animals, grey and white matter show differential profiles in the magnitude and timecourse of changes observed. Whereas the ADC is reduced by ≈ 30% in ischemic grey matter with more rapid pseudonormalization, the reduction is more profound in ischemic white matter (by ≈ 45%) that returns more slowly to “pseudonormal” values if it occurs at all (Kuroiwa et al. 1998; Mukherjee et al. 2000).
With regard to the spatial evolution of ischemic lesions heterogeneity was also observed. During the initial 4 h of experimental MCA stroke, the areas with increased relaxation times or proton density were significantly smaller than the regions showing altered ADC (Hoehn-Berlage et al. 1995a). At later
timepoints, these differences merged to congruent lesion sizes and showed high congruence with histological infarcts at 7 h post occlusion (Back et al. 1994a). It is concluded from this data, that images of T1, T2 or proton density only reflect the correct infarct size after about 7-8 h after onset of ischemia. This notion is particularly true for a situation of permanent vessel obstruction.
4.2.2.2
Correlation Between Changes in Diffusion, Cerebral Metabolites and Tissue Injury
The signal change in diffusion-weighted images is induced by the reduction of the ADC of water in ischemic brain. Experimental studies employing rapid DWI and MRS have demonstrated that this change in ADC occurs within minutes after obstructing a brain artery (Dijkhuizen et al. 1999; van der Toorn et al. 1996). This hyperacute change in tissue water ADC was subject to many efforts to elucidate the underlying mechanisms. Moseley et al. (1990) had already suspected that the ischemiainduced water shift from the extrato the intracellular space may be a key event that explains both, early cell swelling and restricted diffusion in the extracellular compartment. Very similar timecourses of changes in the extracellular space volume and in tissue water diffusion have been nicely shown in a model of acute brain injury (Verheul et al. 1994). By several other studies, the close relationship between cytotoxic cell swelling and disturbance of the energy metabolism has been shown. The abrupt reduction of tissue oxygen and/or glucose concentrations induce anoxic depolarization, caused by a failure of cation-pumping ATPases and leading to the disruption of transmembrane ionic gradients. Much of the ADC decrease occurs during anoxic depolarization, however, recent studies suggest that ADC may change already before anoxic depolarization occurs and may accompany conditions with elevated excitotoxins, but preserved energy metabolism and intact ion homeostasis (for review see Hoehn et al. 2001). It is conceivable that diffusion in the extracellular space is more rapid than within cells. On the other hand, the intracellular space comprises about 85% of total tissue water volume. Cell swelling by water shift would not only reduce the volume of the extracellular compartment, but also increase its tortuosity. Both effects would decrease the ADC. It seems, however, that the ischemia-dependent reduction in ADC is the result