

Книги по МРТ КТ на английском языке / Magnetic Resonance Imaging in Ischemic Stroke - K Sartor R 252 diger von Kummer Tobias Back
.pdfDisturbed Brain Perfusion |
107 |
and
when using the numerical algorithm and the curve fitting algorithm, respectively. TFP is the interactively determined end-point of the first pass. A, B, and D are the fitting parameters of the gamma variate function Γ.
A second, very important parameter is the normalized first momentum of the concentration time curve, which corresponds to the relative mean transit time (rMTT). This parameter is defined by
when using the numerical algorithm and the curve fitting algorithm, respectively (Thompson et al. 1964).
Parallel to rMTT, the parameter time to peak (TTP) is widely used:
 .
.
Tmax is the time-point when the bolus maximum passes the region of interest, while TKM is the timepoint of contrast agent injection.
Furthermore, the time to arrival (TTA) can be calculated as time difference between appearance of the first contrast agent molecules in the tissue of interest and contrast agent injection. When using the curve fitting method, TTA equals TA.
Although the cerebral blood flow (CBF) is defined
as
and |
, |
assuming that the bolus is an ideal δ-shaped function, the relative regional cerebral blood flow
a |
b |
c |
d |
Fig. 6.5a–d. Various cerebrovascular parameters can be calculated from the concentration-time curve. a rrCBV is defined as the area under the concentration-time curve. b TTA is the time between contrast agent injection and arrival of the first contrast agent molecules within the region of interest. c rMTT is the first momentum of the curve. d TTP is the time between contrast agent injection and the maximum contrast agent concentration within the region of interest
108 |
S. Heiland |
(rrCBF) cannot be calculated on the basis of rMTT and rrCBV as shown by Weisskoff et al. (1993). This is because rMTT is contaminated by the bolus dispersion on its way between injection site and brain. The parameter rMTT, however, yields indirect information about the change of blood flow: An increase in rMTT indicates that CBF has decreased.
6.4.2 Quantification
The parameters mentioned above are only semiquantitative values, i.e. focal changes of these parameters can be depicted by comparing the parameters within the lesion to those in normal tissue. If one is interested in quantitative values, knowledge about the arterial input function (AIF) is mandatory. When using gradient echo sequences for DSC imaging, measurement of the AIF needs a special sequence design, because two slices must be acquired simultaneously: one within the interesting tissue and one on the level of major feeding vessels (Perman et al. 1992; Rempp et al. 1994). If DSC imaging is performed with EPI sequences, one does not need to acquire additional slices to determine AIF, because normally the stack of slices contains several major feeding vessels. The AIF can be measured both in the carotid arteries and the middle cerebral arteries. Although it has been shown to be advantageous to determine the AIF within the carotid arteries (Scholdei et al. 1999), it has turned out that it is more convenient to use the middle cerebral arteries for AIF determination, because the image data mostly contain these vessels.
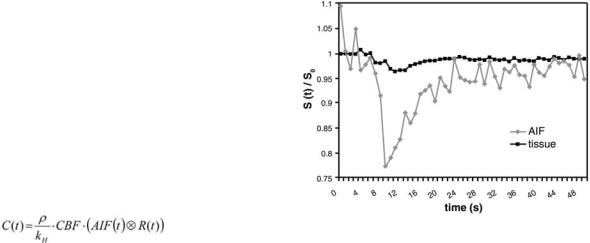
Voxels that represent the AIF must meet the following conditions: (a) The maximum signal drop is larger, (b) the TTA is shorter, and (c) the rMTT is lower than that of normal brain tissue (Fig. 6.6). Furthermore only voxels in the vicinity of the feeding vessels are considered, whereas voxels within the feeding vessels suffer from pulsation artifacts and therefore cannot contribute to the calculation of AIF.
When the AIF and the concentration time curve within the tissue are determined, quantitative values of the cerebrovascular parameters can be calculated by deconvolution under consideration of the relationship:
where ρ is the density of brain tissue, kH is a parameter that accounts for the hematocrit difference between large vessels and capillaries, CBF is the cerebral blood flow and R(t) is the residue function. For deconvolution, several methods have been used, but the singular value decomposition (SVD) has turned out to be the most reliable method (Ostergaard et al. 1996a,b).
Although it would be methodologically correct to determine the AIF of all major feeding arteries and to use these AIFs separately for deconvolution of the concentration time curves measured in their respective territory, this is not done in clinical routine due to practicability reasons. This, however, leads to systematical errors in patients with pathologies of the feeding arteries, e.g. unilateral high grade stenoses: Because both MTT and CBF are influenced by a potential delay of the AIF (Calamante et al. 2000), the CBF of the ipsilateral tissue may be underestimated by more than 50% and MTT may be overestimated, if the AIF is determined on the contralateral hemisphere (Lythgoe et al. 2000; Calamante et al. 2002). Determination of the AIF on the ipsilateral side leads to correct CBF and MTT values of the ipsilateral hemisphere, but this in turn produces systematic errors on the contralateral side. Also other factors, as partial volume effects and the orientation of the vessel, that is used for AIF determination, with respect to the magnetic field, lead to systematic errors in quantification (Boxerman et al. 1995; van Osch et al. 2001). Although some work has been done to correct for these errors, it is important to be aware of the limitations of the methods used for quantification; otherwise over-interpretation or misinterpretation might be the result.
Fig. 6.6. Signal-time curves determined in normal tissue and in the feeding arteries (AIF). The signal drop in the arteries is much larger than in tissue
Disturbed Brain Perfusion |
109 |
6.5
Diagnosis of Cerebrovascular Diseases with DSC
In most cerebrovascular diseases, the semiquantitative Parameters MTT, TTP, TTA and rrCBV provide important diagnostic information for prognosis and decision about therapy.
Even shortly after artery occlusion, the territory supplied by the respective artery can be defined by means of the change in rMTT and TTP, respectively. Both rMTT and TTP are increased significantly due to the decline of CBF (Heiland and Sartor 1999; Schellinger et al. 2000b) (Fig. 6.7). Patient studies have shown that rMTT is an important parameter for prognosis of the lesion growth: If recanalization therapy is not performed or is not successful, the infarction is likely to comprise the whole volume of initial hypoperfusion (Baird et al. 1997). In the very early phase of ischemia, the volume of hypoperfused tissue often exceeds the volume of the ischemic core, where tissue injury is irreversible. The latter can roughly be delineated by diffusion-weighted MRI (DWI) (Moseley et al. 1990; Schellinger et al. 2001, see Chap. 7). This has lead to the “mismatch-concept”: The decision, whether or not a thrombolytic therapy is applied in a patient, depends on the size of the tissue volume, that is hypoperfused, but not yet irreversibly damaged (Jansen et al. 1999): presumably, only patients with a perfusion-diffusion mismatch are likely to benefit from recanalization (Marks et al. 1999; Schellinger et al. 2001, see Chap. 3). For follow-up examinations, rMTT and TTP are also well
suited to assess whether reperfusion has occurred (Schellinger et al. 2000a). Even if magnetic resonance angiography (MRA) shows re-opening of the artery, this does not necessarily mean that the whole territory supplied by this artery is reperfused. Depending on occlusion time and collateralization, the lumen of the capillaries might be blocked due to endothelial cell swelling after a longer period of ischemia (Reith et al. 1995; Kempski and Behmanesh
1997). Some groups have studied whether there is a threshold for TTP and rMTT in order to depict the ischemic lesion in patients with hyperacute stroke. Neumann-Haefelin et al. (1999) have found that the area showing a TTP delay of ≥ 6 s compared to the contra-lateral hemisphere corresponds well to the infarcted tissue volume in follow-up scans, if the patient is not treated (Neumann-Haefelin et al. 1999). Although this method has worked well in the patients examined by Neumann-Haefelin et al. (1999), there is a major methodological concern with regard to this method: TTP and rMTT are only semiquantitative parameters and they depend strongly on the circulation parameters (e.g., pulse rate, cardiac output) and on the injection rate as well as the contrast agent dosage. Even if injection rate and contrast agent dosage is kept constant, the interindividual variability of the circulation parameters does not support the approach to use an absolute threshold. Additional to the interindividual variations, the change in rMTT after artery occlusion or high grade stenosis is different for gray and white matter (Kluytmans et al. 1998). This again leads to systematic errors in the method of Neumann-Haefelin et al. (1999).
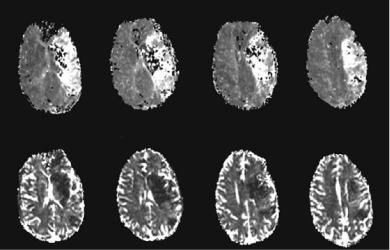
Fig. 6.7. Maps of rMTT (upper row) and rrCBV (lower row) in a patient with occlusion of the left middle cerebral artery. The territory with decreased CBV is smaller than the territory with increased MTT. In the periphery of the infarction core, CBV is slightly increased. This is due to compensatory vasodilatation as a response to the decreased perfusion pressure
110 |
S. Heiland |
While rMTT can depict changes in cerebral hemodynamics, which are due to vessel occlusion of cerebral arteries and the respective compensation mechanisms, the time to arrival of contrast (TTA) is sensitive to vessel diseases, which are more upstream of the arterial flow, most commonly high grade stenoses or occlusions of the carotid arteries. In such patients, blood flow in the hemisphere ipsilateral to the stenosis is mainly supplied by the contralateral carotid artery via the circle of Willis. Due to this detour, TTA is prolonged in the ipsilateral hemisphere (Reith et al. 1997). At the same time, rMTT may be prolonged in the ipsilateral hemisphere resulting from decreased blood flow (Dörfler et al. 2001). If TTP is calculated instead of MTT, the effect of the bolus delay cannot be separated from that of the perfusion decrease, because TTP is influenced by both rMTT and TTA.
Studies in animals have shown, that rrCBV within the ischemic core decreases immediately after occlusion and is likely to raise to values above the baseline, if early reperfusion is achieved (Hamberg et al. 1994). Studies in patients have shown, however, that rrCBV does not depict the ischemic lesion reliably (Tong et al. 1998). Particularly in very small ischemic lesions (< 1 cm3) the map of rrCBV does not show distinct signal changes (Flacke et al. 1998). In tissue with increased rMTT or TTP, particularly within the penumbra, rrCBV is likely to increase due to compensatory vasodilatation as a response to the decreased perfusion pressure (Tsuchida et al. 1997) (Figs. 6.7, 6.8).
CBV of the ischemic penumbra and of reperfused tissue might be overestimated by PI, particularly in measurements after successful reperfusion. One possible explanation is the fact that the gadolinium
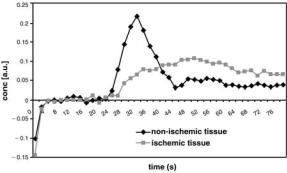
Fig. 6.8. Time course of the contrast agent concentration determined in non-ischemic tissue and in ischemic tissue (penumbra). The maximum concentration in the ischemic tissue is significantly lower than that in normal tissue, and the peak is delayed. The area under the curve of the ischemic tissue is larger than that of the normal tissue, being a sign of the increased CBV within the penumbra
chelates that are normally used for DSC are so small, that they can passage through a capillary, even if corpuscular blood flow is no longer possible due to endothelial cell swelling (Reith et al. 1995). This shows that rrCBV measured by DSC represents the vasculature, where the plasma flow is restored or is still possible. Another potential source of systematic errors is the fact, that gradient-echo EPI sequences, which are widely used for DSC in the clinical setting, do not only measure the blood volume within the capillaries, but also in the larger vessels. On CBV maps, high values that arise from larger arteries and arterioles may mask a CBV deficit in adjacent capillaries that is due to endothelial cell swelling.
Quantification is not necessarily needed for the diagnosis of acute stroke, because the decision whether or not the patient should be treated can be made on the basis of the volume with prolonged rMTT or TTP (Fig. 6.7). Animal studies suggested, however, that the amount of perfusion deficit correlates with the cellular damage. Vexler et al. (1997) have compared PI and histology and found that the perfusion deficit correlates with the number of the apoptosis-positive cells during occlusion. Patient studies have shown that quantitative parameters, particularly CBF, help to predict infarction growth in hyperacute stroke and to select the patients who will profit from therapy (Smith et al. 2000a; Grandin et al. 2001, 2002; Rose et al. 2001). Grandin et al. (2001) examined patients with acute stroke and compared CBF and CBV values in different regions that were defined on the basis of follow-up examinations: the area of the initial infarction core, the area of infarction growth, the area with disturbed perfusion that remained viable and the contralateral healthy tissue. They found that the CBF in the area of infarction growth [CBF=36±20 ml/(min·100 g)] was significantly lower than CBF in the tissue with transiently perfusion disturbance [CBF=50±17 ml/ (min·100 g)]. Additionally they found that CBV in the infarction growth region (CBV=8.9±3.1%) was lower than in the oligemic tissue (CBV=11.2±3.0%). Compared to this, CBF and CBV in the initial infarction core were significantly lower (CBF=28±16 ml/(min·100 g); CBV=6.9±2.7%). From these observations they propose using a multiparametric anal-
ysis with thresholds of CBFthres=35 ml/(min·100 g) and CBVthres=8.2% to predict the evolution of infarction (Grandin et al. 2001). Based on another
patient study, Fiehler et al. (2002) found that the presence of a tissue volume 50 mL with a CBF value 12 mL/100 g per minute (50 mL CBF12) was predictive for further lesion enlargement in acute stroke
Disturbed Brain Perfusion |
111 |
patients. (Fiehler et al. 2002). Other groups found the best sensitivity and accuracy by definition of thresholds based on ratios of CBF and CBV relative to the contralateral hemisphere (Rose et al. 2001), based on ratios of CBF and MTT (Rohl et al. 2001; Butcher et al. 2003), and based on the peak contrast agent concentration and TTP (Grandin et al. 2002). The contradictory results of these studies show that there is up to now no reliable, site-independent procedure for prediction of infarction growth by using quantitative perfusion parameters. The reason for the huge differences between the results of these studies might be the different methods used for data acquisition and post-processing. This in turn shows that CBF, CBV and MTT measured by PI are not really ‘quantitative’ parameters in the way of site-, operatorand method-independent parameters that do exactly correlate to the physiological parameters. CBV for example is influenced by the sequence used for DSC imaging and by the post-processing method: if a gradient-echo EPI sequence is used, not only the capillary network, but also the feeding and draining vessels contribute to the measured CBV, whereas spin-echo EPI sequences comprise only the volume of the capillaries (Speck et al. 2000). Therefore CBV and CBF measured with gradient-echo EPI will in general overestimate the capillary CBV dramatically by a factor 2 to 3 (Simonsen et al. 2000); the degree of this overestimation, however, is not constant but is highest in the vicinity of larger vessels, and is low in the territory of an occluded artery.
Also the method used for post-processing can influence the CBV: The reliability and stability of the results depend among other things on the fact, whether or not curve fitting is used to fit the concentration time curve of tissue and arterial input function (Smith et al. 2000b). As long as there is no universally accepted procedure for PI measurement
and post-processing, all thresholds for prediction of infarction growth will therefore be of very limited value, because these thresholds can only be used in the very exact hardware and software setting as used for the respective study.
6.6
Practical Issues for DSC Imaging
In order to obtain reliable results, data acquisition and post-processing needs to be performed in consideration of methodological and technical constraints. Simulation studies based on signal-time curves of patient examinations have shown that there is a variety of factors that influence the quality and significance of the cerebrovascular parameters such as dosage and concentration of the contrast agent, sequence type and time resolution, and the post-processing method used (Smith et al. 2000b; Benner et al. 1997).
6.6.1
Contrast Agent
One of the most important factors influencing the reliability of the estimated cerebrovascular parameters is the maximum signal drop during bolus passage through the capillaries. Benner et al. (1997) have shown that the maximum signal drop should be at least 20%. The signal drop depends on the contrast agent concentration within a voxel, which in turn is influenced by dosage and concentration of the injected contrast agent as well as by the injection rate. Among these factors, the most important is the contrast agent dosage (Heiland et al. 2001).
a |
b |
c |
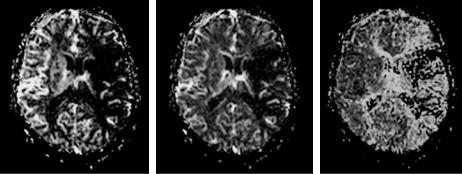
Fig. 6.9a–c. Maps of (a) CBF, (b) CBV and (c) MTT of a patient with an occlusion of the left middle cerebral artery. The maps were calculated based on both the tissue concentration-time curve and the AIF
112 |
S. Heiland |
It is, however, impossible to make a recommendation that is universally valid. This is because the optimum contrast agent dosage depends on other factors such as the field strength and the T2*- weighting of the sequence. There are several dose finding patient studies performed at 1T with FLASH sequences. The low field strength and the fact that the echo time and hence the T2*-sensitivity of this sequence type is limited, are the reason for the optimum contrast agent dosage being 0.3 mmol/kg bodyweight (Erb et al. 1997; Benner et al. 2000). Nowadays, the most common setting to perform PI is to use gradient-echo EPI sequences on a 1.5-T scanner; under these circumstances patient examinations are normally performed using 0.1 mmol/ kg bodyweight, although a multicenter study has found that 0.2 mmol/kg bodyweight is the optimum dosage (Bruening et al. 2000). If a spin-echo EPI sequence is used instead of a gradient-echo EPI sequence, the contrast agent dosage should be increased to compensate for the lower T2*-sensi- tivity of the spin-echo EPI sequences (Heiland et al. 1998; Marstrand et al. 2001). In quantitative perfusion measurements it is important to limit the contrast agent dosage, because the signal drop corresponding within or adjacent to the arteries is much higher than that within the tissue. The signal drop in the region used to determine the AIF should not exceed 70% (Benner et al. 1997), because otherwise the linear relationship between contrast agent concentration and logarithmic signal decrease is no longer valid, which in turn leads to systematic errors in the calculated cerebrovascular parameters.
Compared to the effect of the contrast agent dosage, contrast agent concentration has only a minor effect upon maximum signal drop and hence the reliability of PI. It has been shown in animal and patient studies, that measurements performed with a higher concentrated contrast agent lead to a smaller bolus width and a higher maximum contrast agent concentration (Heiland et al. 1997; Tombach et al. 2003). These effects, however, are very small.
For contrast agent injection an MR compatible power injector should be used to ensure a high and reproducible injection rate. Injection rate should be at least 3 ml/s. Injection should be started parallel to the dynamic scan. This ensures a sufficient number of measurements for calculation of the pre-contrast baseline and guarantees that the whole first pass is comprised, if the scans are repeated for at least 1 min.
6.6.2
Time Resolution
Another important factor influencing the reliability of the calculated cerebrovascular parameters is the repetition rate of the dynamic scan. It has been shown by a simulation study, that at least eight measurements have to be performed during the first pass to limit the inaccuracy of the cerebrovascular parameters to less than 10% (Benner et al. 1997). The width of the first pass within the brain tissue ranges from 12 to 20 s; therefore, the image repetition rate should be at least one image (or image stack) per 1.5 s. This in turn restricts the number of slices. If PI is performed to calculate quantitative values, one has to choose an even higher repetition rate, because the width of the AIF is smaller than that of the concentration-time curve in tissue. This leads to an optimum image repetition rate of one image (or image stack) per second. A further increase of the repetition rate is not advisable, because the SNR drops dramatically for TR less than 1 s.
6.6.3
Data Postprocessing
The postprocessing methods described above (nonlinear fitting, numerical integration, quantification by deconvolution algorithms) are time-consuming. Some MR manufacturers provide post-processing algorithms that avoid these time-consuming procedures but do instead need user interaction to define the bolus arrival and the end of the first pass. These methods, however, are highly susceptible to systematic errors by second passand re-flow effects. A further disadvantage of these methods is that they yield only phenomenological parameters, which do not have a physiological correlate and are influenced by circulation parameters and sequence parameters. Some studies have shown that maps of phenomenological parameters as the maximum concentration, or the percentage of baseline at peak are well correlated to physiological parameters such as the CBV and yield similar diagnostic results in special applications (Berchtenbreiter et al. 1999; Teng et al. 2001). In general, however, the quantitative, automatic deconvolution methods are superior all other methods, because they are highly sensitive to lesion even in presence of a steno-occlusive disease (Perkio et al. 2002; Yamada et al. 2002). A standardized, fully automated post-processing method is desirable, particularly in evaluating and defin-
Disturbed Brain Perfusion |
113 |
ing thresholds for prediction of infarction growth, because only such methods will allow an inter-site comparison of clinical results.
6.7
Perfusion Measurements with Arterial Spin Labeling
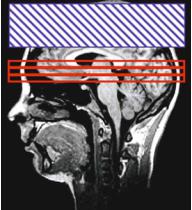
DSC is not the only MRI technique that enables perfusion measurement. An alternative technique is arterial spin labeling (ASL). In ASL, the blood is used as an intrinsic contrast agent (Detre et al. 1992, Zhang et al. 1993). Special pre-pulses invert the spins of brain supplying vessels. The labeled spins in the blood cause a change of tissue magnetization and relaxation in the downstream areas, because there is a magnetization exchange between spins in the blood compartment and spins in the tissue compartment even if the BBB is intact. Fast imaging techniques, usually EPI, acquire images of the interesting area in brain tissue. The labeling prepulse does not only cause changes in magnetization of the water spins in blood, but influences the magnetization of the macromolecules within the tissue. Therefore one has to perform a control experiment with a saturation slice that is equidistantly separated from the imaging slice, but does not cover the supplying vessels (Fig. 6.10).
There are two ways to perform arterial spin labeling experiments: The first one is the continuous spin labeling (CASL), where the blood is continuously inverted upstream. Therefore the magnetization within the tissue is in a steady state (Williams et al. 1992). The second class of ASL techniques is pulsed
spin labeling (PASL), where a short pulse is used to invert the spins in a thick slab. After the inversion there is a time gap, TI, before the image acquisition of the interesting slices starts. During TI the labeled blood flows to the region of interest and exchanges magnetization with the tissue. In both methods, one can calculate CBF by comparing the magnetization of the control experiment and the magnetization of the experiment, where spin labeling has been performed. However, the calculation methods depend on the labeling scheme.
For both PASL and CASL there is a variety of sequence types, which differ in the pulse scheme used for labeling and in the way the control experiment is performed. Commonly labeling and imaging are performed using the same coil, but there are also techniques using a separate coil for labeling. Due to this diversity of sequence schemes, a large number of acronyms exists for ASL techniques, e.g. FAIR, UNFAIR, EPISTAR, PICORE, QUIPSS (Barbier et al. 2001).
The main advantage of ASL is that it allows measuring CBF quantitatively. There are, however, some methodological problems that lead to systematic errors in CBF at high flow rates (> 80 ml/100 g/min). Particularly the variability of the BBB permeability to water in different species and different pathologies and the subtotal magnetization exchange at high flow rates are factors that limit the accuracy of ASL. Nevertheless, validation studies have shown that low and medium CBF can accurately be determined by ASL (Walsh et al. 1994).
It is of further advantage that ASL does not need any contrast agent. Therefore, ASL measurements can be repeated several times. This makes ASL a useful method for measuring CBF changes during
a 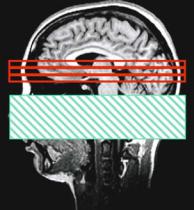
 b
b
Fig. 6.10a,b. Schematic diagram of an ASL experiment. Labeling experiment (a) and control experiment (b). The imaged slices are marked in red, the inversion slab is marked in green for the labeling experiment and in blue for the control experiment
114
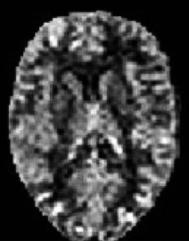
Fig. 6.11. CBF map calculated from an ASL experiment in a healthy volunteer. Images were acquired with a CASL sequence (labeling duration: 2.2 s, post-labeling delay 1 s) on a 1.5-T MR scanner
brain activation, for animal studies with repeated perfusion measurements and for pharmacological studies.
The disadvantage of ASL is the low signal change, which in turn results in high statistical errors in CBF and therefore in poor quality of the calculated CBF maps. The use of high-field MR systems may help to overcome this problem: As T1 increases with the magnetic field strength, less relaxation takes place between labeling and imaging. This leads to a higher concentration of labeled spins in the region of interest.
References
Axel L (1980) Cerebral blood flow determination by rapidsequence computed tomography. Radiology 137:679–686 Baird AE, Benfield A, Schlaug G et al (1997) Enlargement of
human cerebral ischemic lesion volumes measured by dif- fusion-weighted magnetic resonance imaging. Ann Neurol 41:581–589
Barbier EL, Lamalle L, Decorps M (2001) Methodology of brain perfusion imaging. J Magn Reson Imaging 13:496– 520
Belliveau JW, Kennedy DN Jr, McKinstry RC et al (1991) Functional mapping of the human visual cortex by magnetic resonance imaging. Science 254:716–719
Benner T, Heiland S, Erb G et al (1997) Accuracy of gammavariate fits to concentration-time curves from dynamic susceptibility-contrast enhanced MRI: influence of time resolution, maximal signal drop and signal-to-noise. Magn Reson Imaging 15:307–317
Benner T, Reimer P, Erb G et al (2000) Cerebral MR perfusion imaging: first clinical application of a 1 M gadolinium che-
S. Heiland
late (Gadovist 1.0) in a double-blinded randomized dosefinding study. J Magn Reson Imaging 12:371–380
Berchtenbreiter C, Bruening R, Wu RH et al (1999) Comparison of the diagnostic information in relative cerebral blood volume, maximum concentration, and subtraction signal intensity maps based on magnetic resonance imaging of gliomas. Invest Radiol 34:75–81
Boxerman JL, Hamberg LM, Rosen BR, Weisskoff RM (1995) MR contrast due to intravascular magnetic susceptibility perturbations. Magn Reson Med 34:555–566
Boxerman JL, Rosen BR, Weiskoff RM (1997) Signal-to-noise analysis of cerebral blood volume maps from dynamic NMR imaging studies. J Magn Reson Imaging 7:528–537
Bruening R, Berchtenbreiter C, Holzknecht N et al (2000) Effects of three different doses of a bolus injection of gadodiamide: assessment of regional cerebral blood volume maps in a blinded reader study. AJNR Am J Neuroradiol 21:1603–1610
Butcher K, Parsons M, Baird T et al (2003) Perfusion thresholds in acute stroke thrombolysis. Stroke 34:2159–2164 Calamante F, Gadian DG, Connelly A (2000) Delay and disper-
sion effects in dynamic susceptibility contrast MRI: simulations using singular value decomposition. Magn Reson Med 44:466–473
Calamante F, Gadian DG, Connelly A (2002) Quantification of perfusion using bolus tracking magnetic resonance imaging in stroke: assumptions, limitations, and potential implications for clinical use. Stroke 33:1146–1151
Detre JA, Leigh JS, Williams DS, Koretsky AP (1992) Perfusion imaging. Magn Res Med 23:37–45
Dörfler A, Eckstein HH, Eichbaum M et al (2001) Perfusionweighted magnetic resonance imaging in patients with carotid artery disease before and after carotid endarteriectomy. J Vasc Surg 34:587–593
Erb G, Benner T, Heiland S et al (1997) Untersuchungen zur Kontrastmitteldosierung bei der perfusionsgewichteten MRT. RÖFO Fortschr Geb Rontgenstr Neuen Bildgeb Verfahr 167:599–604
Fiehler J, von Bezold M, Kucinski T et al (2002) Cerebral blood flow predicts lesion growth in acute stroke patients. Stroke 33:2421–2425
Fisel CR, Ackerman JL, Buxton RB et al (1991) MR contrast due to microscopically heterogeneous magnetic susceptibility: numerical simulations and applications to cerebral physiology. Magn Reson Med 17:336–347
Flacke S, Keller E, Hartmann A et al (1998) Verbesserte Diagnostik des frühen Hirninfarktes durch den kombinierten Einsatz von Diffusionsund Perfusions-Bildgebung. RÖFO Fortschr Geb Rontgenstr Neuen Bildgeb Verfahr 168:493– 501
Grandin CB, Duprez TP, Smith AM et al (2001) Usefulness of magnetic resonance-derived quantitative measurements of cerebral blood flow and volume in prediction of infarct growth in hyperacute stroke. Stroke 32:1147–1153
Grandin CB, Duprez TP, Smith AM et al (2002) Which MRderived perfusion parameters are the best predictors of infarct growth in hyperacute stroke? Comparative study between relative and quantitative measurements. Radiology 223:361–370
Hamberg LM, Macfarlane R, Tasdemiroglu E et al (1994) Measurement of cerebrovascular changes in cats after transient ischemia using dynamic magnetic resonance imaging. Stroke 24:444–450
Disturbed Brain Perfusion
Heiland S, Sartor K (1999) Magnetresonanztomographie beim Schlaganfall - methodische Grundlagen und klinische Anwendung. RÖFO Fortschr Geb Rontgenstr Neuen Bildgeb Verfahr 171:3–14
Heiland S, Benner T, Reith W et al (1997) Perfusion-weighted MRI using gadobutrol as a contrast agent in a rat stroke model. J Magn Reson Imaging 7:1109–1115
Heiland S, Kreibich W, Reith W et al (1998) Comparison of different EPI-sequence types in perfusion-weighted MR imaging: which one is the best? Neuroradiology 40:216–212
Heiland S, Reith W, Forsting M, Sartor K (2001) How do concentration and dosage of the contrast agent affect the signal change in perfusion-weighted magnetic resonance imaging? A computer simulation. Magn Reson Imaging 19:813–820
Jansen O, Knauth M, Sartor K (1999) Advances in clinical neuroradiology. Akt Neurol 26:1–7
Kempski O, Behmanesh S (1997) Endothelial cell swelling and brain perfusion. J Trauma 42 [Suppl]:38–40
Kluytmans M, van der Grond J, Folkers PJ et al (1998) Differentiation of gray matter and white matter perfusion in patients with unilateral internal carotid artery occlusion. J Magn Reson Imaging 8:767–774
Lythgoe DJ, Ostergaard L, Williams SC et al (2000) Quantitative perfusion imaging in carotid artery stenosis using dynamic susceptibility contrast-enhanced magnetic resonance imaging. Magn Reson Imaging 18:1–11
Marks MP, Tong D, Beaulieu C et al (1999) Evaluation of early reperfusion and IV rt-PA therapy using diffusionand per- fusion-weighted MRI. Neurology 52:1792–1798
Marstrand JR, Rostrup E, Rosenbaum S et al (2001) Cerebral hemodynamic changes measured by gradient-echo or spin-echo bolus tracking and its correlation to changes in ICA blood flow measured by phase-mapping MRI. J Magn Reson Imaging 14:391–400
Moseley ME, Kucharczyk J, Mintorovitch J et al (1990) Dif- fusion-weighted MR imaging of acute stroke: correlation with T2-weighted and magnetic susceptibility-enhances MR imaging in cats. AJNR Am J Neuoradiol 11:423–429
Neumann-Haefelin T, Wittsack HJ, Wenserski F et al (1999) Diffusionand perfusion-weighted MRI. The DWI/PWI mismatch region in acute stroke. Stroke 30:1591–1597
Norman D, Axel L, Berninger WL et al (1981) Dynamic computed tomography of the brain: techniques, data analysis, and applications. AJR 136:759–770
Ostergaard L, Weisskoff RM, Chesler DA et al (1996a) High resolution measurement of cerebral blood flow using intravascular tracer bolus passages, part I. Mathematical approach and statistical analysis. Magn Reson Med 36:715–725
Ostergaard L, Sorensen AG, Kwong KK et al (1996b) High resolution measurement of cerebral blood flow using intravascular tracer bolus passages, part II. Experimental comparison and preliminary results. Magn Reson Med 36:726–736 Perkio J, Aronen HJ, Kangasmaki A et al (2002) Evaluation of four postprocessing methods for determination of cerebral blood volume and mean transit time by dynamic suscepti-
bility contrast imaging. Magn Reson Med 47:973–981 Perman WH, Gado MH, Larson KB, Perlmutter JS (1992)
Simultaneous MR acquisition of arterial and brain signaltime curves. Magn Reson Med 28:74–83
Reith W, Forsting M, Vogler H et al (1995) Contrast enhanced MR for early detection of cerebral ischemia: an experimental study. Am J Neuroradiol 16:53–60
115
Reith W, Heiland S, Erb G et al (1997) Dynamic contrastenhanced T2*-weighted MRI in patients with cerebrovascular disease. Neuroradiology 39:250–257
Rempp KA, Brix G, Wenz F et al (1994) Quantification of regional cerebral blood flow and volume with dynamic susceptibility contrast-enhanced MR imaging. Radiology 193:637–641
Rohl L, Ostergaard L, Simonsen CZ et al (2001) Viability thresholds of ischemic penumbra of hyperacute stroke defined by perfusion-weighted MRI and apparent diffusion coefficient. Stroke 32:1140–1146
Rose SE, Chalk JB, Griffin MP et al (2001) MRI based diffusion and perfusion predictive model to estimate stroke evolution. Magn Reson Imaging 19:1043–1053
Rosen BR, Belliveau JW, Chien D (1989) Perfusion imaging by nuclear magnetic resonance. Magn Reson Q 5:263–281 Rosen BR, Belliveau JW, Vevea JM, Brady TJ (1990) Perfu-
sion imaging with NMR contrast agents. Magn Reson Med 14:249–265
Schellinger PD, Jansen O, Fiebach JB et al (2000a) Monitoring intravenous recombinant tissue plasminogen activator thrombolysis for acute ischemic stroke with diffusion and perfusion MRI. Stroke 31:1318–1328
Schellinger PD, Jansen O, Fiebach JB et al (2000b) Feasibility and practicality of MR imaging of stroke in the management of hyperacute cerebral ischemia. AJNR Am J Neuroradiol 21:1184–1189
Schellinger PD, Fiebach JB, Jansen O et al (2001) Stroke magnetic resonance imaging within 6 hours after onset of hyperacute cerebral ischemia. Ann Neurol 49:460–469
Scholdei R, Wenz F, Essig M et al (1999) The simultaneous determination of the arterial input function for dynamic susceptibility-weighted magnetic resonance tomography of the A. carotis interna and the A. cerebri media. RÖFO Fortschr Geb Rontgenstr Neuen Bildgeb Verfahr 171:38–43
Simonsen CZ, Ostergaard L, Smith DF et al (2000) Comparison of gradientand spin-echo imaging: CBF, CBV, and MTT measurements by bolus tracking. J Magn Reson Imaging 12:411–416
Smith AM, Grandin CB, Duprez T et al (2000a) Whole brain quantitative CBF, CBV, and MTT measurements using MRI bolus tracking: implementation and application to data acquired from hyperacute stroke patients. J Magn Reson Imaging 12:400–410
Smith AM, Grandin CB, Duprez T et al (2000b) Whole brain quantitative CBF and CBV measurements using MRI bolus tracking: comparison of methodologies. Magn Reson Med 43:559–564
Speck O, Chang L, DeSilva NM, Ernst T (2000) Perfusion MRI of the human brain with dynamic susceptibility contrast: gradient-echo versus spin-echo techniques. J Magn Reson Imaging 12:381–387
Teng MM, Cheng HC, Kao YH et al (2001) MR perfusion studies of brain for patients with unilateral carotid stenosis or occlusion: evaluation of maps of “time to peak” and “percentage of baseline at peak”. J Comput Assist Tomogr 25:121–125
Thompson HK, Starmer CF, Whalen RE, McIntosh H (1964) Indicator transit time considered as a gamma variate. Circ Res 14:502–515
Tombach B, Benner T, Reimer P et al (2003) Do highly concentrated gadolinium chelates improve MR brain perfusion imaging? Intraindividually controlled randomized
116
crossover concentration comparison study of 0.5 versus 1.0 mol/L gadobutrol. Radiology 226:880–888
Tong DC,Yenari MA,Albers GW et al (1998) Correlation of perfusionand diffusion-weighted MRI with NIHSS score in acute (<6.5 hour) ischemic stroke. Neurology 50:864–870
Tsuchida C, Yamada H, Maeda M et al (1997) Evaluation of peri-infarcted hypoperfusion with T2*-weighted dynamic MRI. J Magn Reson Imaging 7: 518–522
Van Osch MJ, Vonken EJ, Bakker CJ, Viergever MA (2001) Correcting partial volume artifacts of the arterial input function in quantitative cerebral perfusion MRI. Magn Reson Med 45:477–485
Vexler ZS, Roberts TP, Bollen AW et al (1997) Transient cerebral ischemia. Association of apoptosis induction with hypoperfusion. J Clin Invest 99:1453–1459
Walsh EG, Minematsu K, Leppo J, Moore SC (1994) Radioactive microsphere validation of a volume localized continu-
S. Heiland
ous saturation perfusion measurement. Magn Reson Med 31:147–153
Weisskoff RM, Chesler D, Boxerman JL, Rosen BR (1993) Pitfalls in MR measurement of tissue blood flow with intravascular tracers: which mean transit time? Magn Reson Med 29:553–558
Williams DS, Detre JA, Leigh JS, Koretsky AP (1992) Magnetic resonance imaging of perfusion using spin inversion of arterial water. Proc Natl Acad Sci USA 89:212–216
Yamada K, Wu O, Gonzalez RG et al (2002) Magnetic resonance perfusion-weighted imaging of acute cerebral infarction: effect of the calculation methods and underlying vasculopathy. Stroke 33:87–94
Zhang W, Williams DS, Koretsky AP (1993) Measurement of rat brain perfusion by NMR using spin labeling of arterial water: in vivo determination of the degree of spin labeling. Magn Reson Med 29:416–421