

Книги по МРТ КТ на английском языке / Magnetic Resonance Imaging in Ischemic Stroke - K Sartor R 252 diger von Kummer Tobias Back
.pdf158
ment does not exist, but some basic guidelines can be followed. Since chronic brain ischemia is the most likely etiology, preventive and management methods should be targeted against it. Antithrombotic agents, such as aspirin with or without dipyridamole and clopidogrel, may represent an important component in prevention, especially in subjects with risk factors for vascular diseases. Equally important is aggressive treatment of risk factors for vascular diseases, such as arterial hypertension, diabetes mellitus, dyslipidemia, and heart diseases, and all subjects should be motivated to give up smoking and excessive consumption of alcohol. Therapies that help to stabilize the endothelium, such as statins and angiotensin converting enzyme inhibitors, may also have a role in treating patients with LA. There is not yet scientific evidence whether carotid endarterectomy in patients with coexisting severe carotid artery stenosis and LA may be beneficial in attenuating the progression of LA and/or slowing down the cognitive decline process.
References
Breteler MM, van Amerongen NM, van Swieten JC, Claus JJ, Grobbee DE, van Gijn J, Hofman A, van Harskamp F (1994) Cognitive correlates of ventricular enlargement and cerebral white matter lesions on magnetic resonance imaging. The Rotterdam Study. Stroke 25:1109–1115
Brown WR, Moody DM, Thore CR, Challa VR (2000) Apoptosis in leukoaraiosis. AJNR Am J Neuroradiol 21:79–82
Brown WR, Moody DM, Challa VR, Thore CR, Anstrom JA (2002) Venous collagenosis and arteriolar tortuosity in leukoaraiosis. J Neurol Sci 203-204:159–163
Bryan RN, Wells SW, Miller TJ, Elster AD, Jungreis CA, Poirier VC, Lind BK, Manolio TA (1997) Infarctlike lesions in the brain: prevalence and anatomic characteristics at MR imaging of the elderly - data from the Cardiovascular Health Study. Radiology 202:47–54
De Leeuw FE, de Groot JC, Achten E, Oudkerk M, Ramos LM, Heijboer R, Hofman A, Jolles J, van Gijn J, Breteler MM (2001) Prevalence of cerebral white matter lesions in elderly people: a population based magnetic resonance imaging study. J Neurol Neurosurg Psychiatry 70:9–14
Hachinski VC, Potter P, Merskey H (1987) Leukoaraiosis. Arch Neurol 44:21–23
Hassan A, Hunt BJ, O’Sullivan M, Parmar K, Bamford JM, Briley D, Brown MM, Thomas DL, Markus HS (2003) Markers of endothelial dysfunction in lacunar infarction and ischemic leukoaraiosis. Brain 126:424–432
Heier LA, Bauer CJ, Schwartz L, Zimmerman RD, Morgello S, Deck MD (1989) Large Virchow-Robin spaces: MR-clinical correlation. AJNR Am J Neuroradiol 10:929–936
Helenius J, Soinne L, Salonen O, Kaste M, Tatlisumak T (2002) Leukoaraiosis, ischemic stroke, and normal white matter on diffusion-weighted MRI. Stroke 33:45–50
Inzitari D (2003) Leukoaraiosis: an independent risk factor for stroke? Stroke 34:2067–2071
J. Helenius and T. Tatlisumak
Jones DK, Lythgoe D, Horsfield MA, Simmons A, Williams SC, Markus HS (1999) Characterization of white matter damage in ischemic leukoaraiosis with diffusion tensor MRI. Stroke 30:393–397
Lassen NA (1985) Normal average value of cerebral blood flow in younger adults is 50 ml/100 g/min. J Cereb Blood Flow Metab 5:347–349
Markus HS, Lythgoe DJ, Østergaard L, O’Sullivan M, Williams SC (2000) Reduced cerebral blood flow in white matter in ischaemic leukoaraiosis demonstrated using quantitative exogenous contrast based perfusion MRI. J Neurol Neurosurg Psychiatry 69:48–53
Moody DM, Bell MA, Challa VR (1990) Features of the cerebral vascular pattern that predict vulnerability to perfusion or oxygenation deficiency: an anatomic study. AJNR Am J Neuroradiol 11:431–439
Moody DM, Brown WR, Challa VR, Anderson RL (1995) Periventricular venous collagenosis: association with leukoaraiosis. Radiology 194:469–476
Murdoch G (2000) Staining for apoptosis: now neuropathologists can “see” leukoaraiosis. AJNR Am J Neuroradiol 21:42–43
Oppenheimer SM, Bryan RN, Conturo TE, Soher BJ, Preziosi TJ, Barker PB (1995) Proton magnetic resonance spectroscopy and gadolinium-DTPA perfusion imaging of asymptomatic MRI white matter lesions. Magn Reson Med 33:61–68 O’Sullivan M, Lythgoe DJ, Pereira AC, Summers PE, Jarosz JM, Williams SC, Markus HS (2002) Patterns of cerebral blood flow reduction in patients with ischemic leukoaraiosis.
Neurology 59: 321–326
Pantoni L, Garcia JH (1995) The significance of cerebral white matter abnormalities 100 years after Binswanger’s report. A review. Stroke 26:1293–1301
Pantoni L, Garcia JH (1997) Pathogenesis of leukoaraiosis: a review. Stroke 28:652–659
Rumboldt Z, Marotti M (2003) Magnetization transfer, HASTE, and FLAIR imaging. Magn Reson Imaging Clin North Am 11:471–492
Soinne L, Helenius J, Saimanen E, Salonen O, Lindsberg PJ, Kaste M, Tatlisumak T (2003a) Brain diffusion changes in carotid occlusive disease treated with endarterectomy. Neurology 61:1061–1065
Soinne L, Helenius J, Tatlisumak T, Saimanen E, Salonen O, Lindsberg PJ, Kaste M (2003b) Cerebral hemodynamics in asymptomatic and symptomatic patients with high-grade carotid stenosis undergoing carotid endarterectomy. Stroke 34:1655–1661
Thomalla G, Glauche V, Koch MA, Beaulieu C, Weiller C, Rother J (2004) Diffusion tensor imaging detects early Wallerian degeneration of the pyramidal tract after ischemic stroke. Neuroimage 22:1767–1774
Vermeer SE, Hollander M, van Dijk EJ, Hofman A, Koudstaal PJ, Breteler MM (2003) Silent brain infarcts and white matter lesions increase stroke risk in the general population: the Rotterdam Scan Study. Stroke 34:1126–1129
Yamauchi H, Fukuyama H, Nagahama Y, Shiozaki T, Nishizawa S, Konishi J, Shio H, Kimura J (1999) Brain arteriolosclerosis and hemodynamic disturbance may induce leukoaraiosis. Neurology 53:1833–1838
Yue NC, Arnold AM, Longstreth WT Jr, Elster AD, Jungreis CA, O’Leary DH, Poirier VC, Bryan RN (1997) Sulcal, ventricular, and white matter changes at MR imaging in the aging brain: data from the cardiovascular health study. Radiology 202:33–39

MR Detection of Intracranial Hemorrhage |
159 |
10 MR Detection of Intracranial Hemorrhage
Thamburaj Krishnamoorthy and Marco Fiorelli
CONTENTS
10.1Introduction 159
10.2 |
Types of Intracranial Hemorrhage (ICH) 159 |
10.3 |
Spontaneous Intracerebral Hematoma (ICH) 159 |
10.3.1 |
Determinants of MR Signals in ICH 160 |
10.3.1.1Paramagnetic Effects 160
10.3.1.2Other Effects 161
10.3.2 The Evolution of MR Signals in ICH 161
10.3.2.1Hyperacute ICH 162
10.3.2.2Acute ICH 163
10.3.2.3 |
Early and Late Subacute ICH 163 |
10.3.2.4 |
Chronic ICH 164 |
10.4 |
Subdural and Epidural Hematomas 164 |
10.5Subarachnoid Hemorrhage 165
10.6Intraventricular Hemorrhage 166
10.7Hemorrhagic Infarction 167
10.8Cerebral Microbleeds 167 References 168
10.1 Introduction
Intracranial hemorrhage in any form can produce devastating effects. Neuroimaging plays a decisive role in the management of patients with any type of intracranial bleeding, by showing the presence, the extent, the location and often the cause of the hemorrhage. Traditionally CT scan has been used as the imaging modality of choice to confirm or exclude intracranial hemorrhage. However, while in the acute setting CT performs admirably, it is much less accurate in the identification of subacute and chronic bleeds (Wardlaw et al. 2003). MRI is known to be exquisitely sensitive to the presence of stigmata related to old bleedings, and to malformations or other potential causes of hemorrhage, but until recently has been considered unreliable in the
T. Krishnamoorthy, MD
Department of Imaging and Interventional Radiology, Sree Chitra Tirunal Institute for Medical Sciences and Technology, Trivandrum 695011, Kerala, India
M. Fiorelli, MD, PhD
Department of Neurological Sciences, University La Sapienza, Viale dell’Universitá 30, 00185 Rome, Italy
diagnosis of hyperacute brain hemorrhage, a notion that is becoming obsolete. This chapter addresses the basic MR physical principles determining the appearance of intracranial hemorrhage, the pathology of various types of hemorrhagic cerebrovascular conditions and the relevant MR findings.
10.2
Types of Intracranial Hemorrhage (ICH)
Intracranial hemorrhages can be classified according to their anatomic location (epidural, subdural, subarachnoid, intracerebral, and intraventricular) or to their etiology (spontaneous or traumatic). Because of its frequency, higher than for any other type of intracranial hemorrhage, and its complex evolution from the hyperacute to the chronic stage, spontaneous intracerebral hematoma (ICH) serves as the paradigm for the systematization of the complex MR appearance of intracranial bleedings. It will therefore be treated in greater detail.
10.3
Spontaneous Intracerebral Hematoma (ICH)
Primary ICH is responsible for 10%–15% of all cases of stroke in Western populations and for 20%–30% of strokes among Asian and Black populations (Qureshi et al. 2001). An ICH typically presents with the sudden onset of a focal neurological deficit, which rapidly progresses over minutes to hours. Headache, nausea, vomiting, elevated blood pressure and decreased level of consciousness are more frequently associated with ICH than with ischemic stroke but are by no means pathognomonic. Imaging is therefore mandatory for a proper diagnosis of ICH. Expansion of the hematoma is the most common cause of secondary deterioration within the first few hours after onset (Brott et al. 1997).
160 |
T. Krishnamoorthy and M. Fiorelli |
With only 38% of patients surviving the first year, and only 20% of survivors capable of living independently after 6 months (Qureshi et al. 2001), the prognosis of ICHs is generally worse than that of ischemic strokes.
Depending on the cause, spontaneous ICH is classified into primary or secondary. Primary hemorrhages account for 78%–88% of overall cases of ICH, and occur from rupture of small vessels damaged by either chronic hypertension (85% of primary ICHs) or cerebral amyloid angiopathy (CAA) (15% of primary ICHs). The most frequent sites of hypertensive ICH are putamen (50%), thalamus (15%), pons (10%–15%), and cerebellum (10%) (Broderick et al. 1999). On the other hand, CAA is the cause of hemorrhage in more than 50% of patients with lobar ICH above 70 years of age. Secondary ICH is due to vascular malformations, tumors, impaired anticoagulation, drugs, infections etc. ICH in young patients (≤ 45 years) is often lobar in location and is most commonly secondary to an underlying vascular malformation (Qureshi et al. 2001).
Primary ICHs arise from small arteries, which have undergone degenerative changes from chronic hypertension or CAA. Charcot and Bouchard attributed hypertensive ICHs to ruptured miliary microaneurysms, but hemorrhage can originate from the fragile perforators also without microaneurysm formation. The bleeding initially results in mass effect with compression of the adjacent microvasculature (Huckman et al. 1970). The blood then spreads along white matter tracts causing compressive rather than destructive tissue damage. Histology of early hematoma shows edema, neuronal damage, and inflammatory cell infiltration in the perihematoma region. Edema is initially due to release and accumulation of osmotically active serum proteins from the clot, and later from vasogenic and cytotoxic phenomena (Carhuapoma et al. 2002). Despite the presence of local hypoperfusion, probably no ischemia develops in the perihematoma region and neuronal death is predominantly necrotic. In fact, PET studies have shown lack of elevation of oxygen extraction fraction in the perihematoma region, a finding that is not compatible with true ischemia (Zazulia et al. 2001).
Much of the current knowledge about ICH pathology has been obtained from experimental works conducted using various animal models. In a classical study, Rosenberg et al. (1990) were able to induce an ICH in the rat brain using an intraparenchymal injection of the enzyme collagenase. At 24 h, the resulting lesion consisted of a central zone showing a mixture of red blood cells and normal brain parenchyma, and
a peripheral zone with necrotic or viable neuronal and glial cells. By 48 h polymorphonuclear infiltration was observed at the periphery. By 1 week, intense macrophage activity was seen at the border of the peripheral zone with associated increased vascularity and evidence of small vessel formation. Only a few macrophages had hemosiderin within them. By 21 days, the lesion was converted into a cavity filled with fluid and traversed by delicate gliovascular trabeculae, that contained variable numbers of hemosiderin and lipid laden macrophages. It is likely that these findings can be extrapolated with good approximation to the evolution of a primary human ICH.
10.3.1
Determinants of MR Signals in ICH
The most important mechanism that underlies the MR appearance of ICH is the transformation of initially oxygenated hemoglobin into a series of breakdown products (deoxyhemoglobin, methemoglobin, and hemosiderin), that differ in terms of presence and number of unpaired electrons of the heme iron. Hereafter, we will discuss the influence of hemoglobin and its metabolites on T1 and T2 relaxation times. We will also briefly review the effects on MR signals of other factors such as protein concentration, clot formation and retraction, and red blood cell dehydration.
10.3.1.1 Paramagnetic Effects
Approximately 99% of biological tissues are diamagnetic, i.e. they do not interact significantly with magnetic fields and therefore do not modify T1 and T2 relaxation times. The characteristic of diamagnetic molecules, like oxyhemoglobin, is the lack of unpaired electrons in their outer orbital. On the other hand, paramagnetic materials like iron or gadolinium do have unpaired electrons in their outer orbital, which induce significant shortenings of T1 and T2 relaxation times. Relevant to hemorrhage, this paramagnetic effect is observed in the acute phase with deoxyhemoglobin, in the subacute phase with methemoglobin, and in the chronic phase with hemosiderin (Gomori et al. 1985).
The T2 shortening effect induced by paramagnetic substances is known as the susceptibility effect, which in hemorrhages is caused by the presence of either deoxyhemoglobin, or intracellular methemo-
MR Detection of Intracranial Hemorrhage |
161 |
globin, or ferritin/hemosiderin, but not of extracellular methemoglobin. Compartmentalization of deoxyhemoglobin or, at a later stage, methemoglobin inside intact red blood cells, or finally of hemosiderin inside the lysosomes of macrophages and astrocytes (Bradley 1993) creates heterogeneously varying local field gradients (Gomori et al. 1987; Brooks et al. 1989) and induces phase shifts in the water protons as they diffusethroughtheselocalgradients(Gomorietal.1985). The dephasing of the protons results in transverse relaxation and produces signal loss on T2 (DeLaPaz et al. 1984; Gomori et al. 1985), and especially on T2*- weighted images, the latter being the most sensitive sequence for the detection of susceptibility-induced effects (Gomori et al. 1987; Hayman et al. 1991). In fast spin echo (FSE) sequences due to the shorter echo spacing, the time available for diffusion of water protons is shorter. This leads to a lesser sensitivity of FSE techniques in the detection of susceptibility effects (Feinberg and Oshio 1991). T2 relaxation effects are directly proportional to the square of the local field gradients (Gomori et al. 1985). The T2 shortening effect of high field is 100 times that of 0.15 T (low field) and 9 times that of 0.5 T (intermediate field). At low field (less than 0.5 T) acute hematomas may appear isointense to brain parenchyma while subacute and chronic hematomas appear hyperintense on all pulse sequences (Gomori et al. 1985). The preferential T2 proton relaxation enhancement of acute hematomas and the hemosiderin rim are observed only with high magnetic fields. In agreement with these principles, a recent report indicates that the susceptibility effects typical of acute and subacute hematomas are more prominent at 3.0 T compared to 1.5 T, which, however, does not seem to translate into a significant incremental diagnostic accuracy (Allkemper et al. 2004).
The other important paramagnetic effect involves the longitudinal relaxation. When a paramagnetic ion is added to the water protons, the routine protonproton dipole-dipole interaction between water protons is converted to a proton-electron dipole-dipole (PEDD) interaction (Barkovich and Atlas 1988). The efficient exchange of energy from this interaction results in T1 shortening and consequently in bright signals on T1-weighted images (Bradley 1993). This phenomenon is also known as the relaxivity effect. Even though deoxyhemoglobin is paramagnetic, it does not promote PEDD interactions since the paramagnetic ion is shielded by the hydrophobic pocket of the globin protein (Gomori et al. 1985; Bradley 1993). Hence, acute hematomas which contain deoxyhemoglobin do not appear hyperintense on T1-weighted
images (Bradley 1993). On the other hand, following the oxidative denaturation of deoxyhemoglobin to methemoglobin (Bradley 1993), the conformational change in the hemoglobin molecule makes the paramagnetic heme move to the surface, where it can be approached by water protons (Gomori et al. 1987). The ensuing PEDD interaction is responsible for the hyperintense appearance of hematomas containing methemoglobin in T1-weighted images. Unlike susceptibility effects, PEDD interaction occurs regardless of whether the methemoglobin is intracellular or extracellular. A further difference with susceptibility effects is that the paramagnetic T1 shortening is less dependent on field strength.
10.3.1.2 Other Effects
Proteins seem to provide some contribution to the signal intensities of hemorrhage in all stages. However, the effect of proteins is more evident in the very early phase, when paramagnetic effects are still minimal. In the first few hours after the bleeding, the isoor mildly hypointense appearance on T1-weighted images and the hyperintensity on T2-weighted images is mainly due to the high concentration of proteins, predominantly oxyhemoglobin but also cell membrane lipoproteins and fibrinogen (Clark et al. 1990). In the following days and weeks, the influence of proteins on MR signals is overwhelmed by paramagnetic effects. Packing of more RBCs per unit volume of blood, formation and retraction of clot matrix, and dehydration of RBCs are all phenomena for which an effect on MR signals has been postulated (Hayman et al. 1991). This effect, however, is likely to be only mild, especially at high field.
10.3.2
The Evolution of MR Signals in ICH
Based on the most mature form of the hemoglobin present in the clot, five stages of evolving ICH have been described (Bradley 1993). The hyperacute stage lasts for 24 h, acute stage for 2–3 days, early subacute stage for 3–7 days, late subacute stage up to 2 weeks and chronic stage more than 2 weeks. The evolution of an ICH is a complex and dynamic process and the estimation of the time of onset based on MRI findings may be inaccurate (Alemany Ripoll et al. 2004). However, the classification into five stages still retains its practical utility.
162
10.3.2.1 Hyperacute ICH
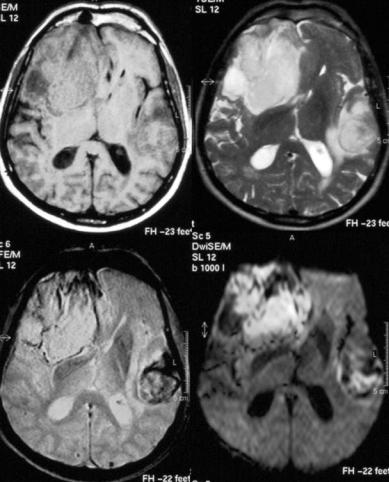
It was initially believed that on MRI an ICH of less than 24 h duration could not be distinguished reliably either from a mass lesion or from an acute infarct, because of an unspecific pattern of isointensity in T1 and slight hyperintensity on T2 imparted by the predominance of oxyhemoglobin. However, due to a reduced oxygen tension at the periphery of the clot, some deoxygenation of hemoglobin occurs immediately after the bleeding, and several studies have demonstrated that the resulting susceptibility effects can be visualized very early on T2and particularly on T2*-weighted images as a hypointense rim (Fig. 10.1). This finding may be less apparent or even not apparent at all with low-field systems, or if FSE T2 sequences are used. Linfante et al. (1999) reported the ability of high field MRI to reliably detect a spontaneous ICH as early as 20 min after onset and schematized
T. Krishnamoorthy and M. Fiorelli
the appearance of the hyperacute hemorrhage as consisting of three distinct concentric regions. The center of the hemorrhage appears isointense or heterogeneously hyperintense on T2and T2*-weighted images, probably reflecting the presence of intact oxyhemoglobin. The periphery is hypointense on T2and T2*-weighted images reflecting the susceptibility effects due to deoxyhemoglobin, and finally there is an outer rim that appears hypointense on T1-weighted images and hyperintense on T2and T2*-weighted images, suggestive of edema. Such a ‘target-like’ pattern is also found on DWI sequences (Mrita et al. 2002). Within a hyperacute ICH, perfusion imaging (PI) may reveal a different time-con- trast curve compared to hyperacute ischemic stroke, probably due to the early blood-brain barrier breakdown seen in ICH and to the consequent contrast extravasation (Wintermark et al. 2002).
Kidwell et al. (2004) recently reported the results of a prospective, multicenter study in which
Fig. 10.1. Patient with a large hyperacute right frontotemporal hematoma and a smaller left temporal hematoma in transition from the hyperacute to the acute stage. Top left, T1; top right, T2; bottom left, T2*; bottom right; DWI
MR Detection of Intracranial Hemorrhage |
163 |
patients with focal stroke symptoms within 6 h of onset underwent brain MRI followed by non-con- trast CT. Four blinded readers evaluated acute intracerebral hemorrhage and any intracerebral hemorrhage on gradient recalled echo MRI and CT scans by a consensus. After 200 patients were enrolled, it became apparent that MRI was detecting cases of hemorrhagic transformation not detected by CT. For the diagnosis of any hemorrhage, MRI was positive in 71 patients with CT positive in 29 patients (p < 0.001). For the diagnosis of acute hemorrhage, however, MRI and CT were equivalent (96% concordance). In three patients, regions interpreted as acute hemorrhage on CT were interpreted as chronic hemorrhage on MRI. In one patient, subarachnoid hemorrhage (SAH) was diagnosed on CT, but not on MRI. In 49 patients, chronic hemorrhage, most often microbleeds, was visualized on MRI, but not on CT.
These results indicate that, provided the appropriate imaging protocol is used, MRI can replace CT as the imaging modality of choice in acute stroke patients, if SAH is excluded.
10.3.2.2 Acute ICH
In the absence of rebleeding, deoxygenation of the clot is completed in most cases by 24 h (Brooks et al. 1989). At that time deoxyhemoglobin becomes the predominant blood breakdown product in the lesion. Due to its paramagnetic properties and its compartmentalization within still intact RBCs, deoxyhemoglobin exerts a strong susceptibility effect, which makes acute hematomas appear distinctly and characteristically dark on T2 weighted SE images (Gomori et al. 1985), and more so on T2* weighted GRE images (Hayman et al. 1991). On T1-weighted images, acute ICHs still appear isointense or mildly hypointense, as in the hyperacute stage. The parenchyma surrounding the clot exhibits a halo due to vasogenic edema and initial inflammatory reaction. The region of edema has long T1 and T2 relaxation times and appears hypointense on T1-weighted images and hyperintense on T2-weighted images. Edema is better shown by T2-weighted SE sequences than by T2* sequences. By the 5th to 12th day the hyperintense halo from edema begins to regress (Barkovich and Atlas 1988). These features of acute ICH last for about 3 days, after which formation of methemoglobin from deoxyhemoglobin begins and
the clot evolves into the subacute stage (Bradley 1993).
10.3.2.3
Early and Late Subacute ICH
The appearance of methemoglobin in the clot marks the transition from the acute to the subacute phase. Too high or too low oxygen tension is likely to delay methemoglobin formation and the expected evolutionary changes of ICH (Barkovich and Atlas 1988). Unlike deoxyhemoglobin, methemoglobin allows water protons to approach the paramagnetic ion. This is possible due to a conformational change occurring in the structure of methemoglobin, which brings the ferric ion to the surface of the molecule. With this change PEDD interaction becomes possible and leads to the shortening of T1 that is characteristic of subacute hematomas. Since methemoglobin is formed initially at the interface of the hematoma with the parenchyma of the brain, the bright signals on T1-weighted images are observed initially at the periphery of the clot (Gomori et al. 1985). Later, the bright signal extends centripetally until the whole clot becomes hyperintense in T1. This paramagnetic T1 shortening effect is observed at all field strengths. In the early subacute phase, methemoglobin is still compartmentalized within red blood cells and hence generates local field gradients that maintain a T2 shortening effect similar to that induced by deoxyhemoglobin. Therefore, in the early subacute phase relaxivity effects and susceptibility effects coexist, i.e. the clot appears bright in T1, and dark in T2 and especially in T2*. This stage is expected to last for approximately 1 week.
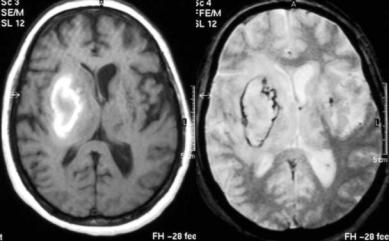
As the clot ages, progressive fragmentation and osmotic phenomena damage RBC membranes until they eventually lyse. Hemolysis releases methemoglobin into the extracellular fluid compartment of the hematoma. The resulting dilution of methemoglobin in the extracellular fluids eliminates the biological field gradients (Barkovich and Atlas 1988), and with them the susceptibility phenomena, an effect that is observed initially at the periphery of the clot. When all methemoglobin is extracellular, the T2-shortening induced signal loss is no longer observed, so that the late subacute ICH is predominantly hyperintense in both T1and T2-weighted images (Fig. 10.2). Focal brain lesions containing fat, calcium, or high concentrations of proteins can also appear hyperintense in T1 and T2 and therefore enter in the differential diagnosis of ICH at this stage.
164 |
T. Krishnamoorthy and M. Fiorelli |
Fig. 10.2. Patient with late subacute hematoma in the right basal ganglia.
Left, T1; right, T2*)
10.3.2.4 Chronic ICH
The beginning of the chronic phase is characterized by the appearance of modified macrophages (microglia), which phagocytose the ferritin and the hemosiderin formed from the breakdown of extracellular methemoglobin. These macrophages accumulate at the periphery of the hematoma and form a ring around the remnants of the clot. Hemosiderin is highly paramagnetic as it has five unpaired electrons. Its location inside the lysosomes of macrophages is responsible for the creation of field gradients and of marked T2 shortening. Hemosiderin is also insoluble in water, which prevents PEDD interaction. In the absence of T1 shortening no bright signals are observed from hemosiderin on T1-weighted images. However, at the beginning of the chronic stage there may still be free methemoglobin in the center of the clot giving bright signals on T1-weighted images. As a result, a chronic ICH initially shows a hypointense peripheral hemosiderin rim completely surrounding a central area hyperintense in all sequences due to the persistence of extracellular methemoglobin. The hemosiderin rim is less conspicuous on T1-weighted sequences and more conspicuous on T2and T2*-weighted sequences. With time, the macromolecules in the hematoma cavity are slowly reabsorbed (Brooks et al. 1989). This results in a gradual disappearance of paramagnetic T1 shortening effects. With the elimination of all macromolecular components, the lesion becomes more fluid and the signal intensity of the inner part of the clot becomes isointense to CSF in
all sequences. Finally, the cyst-like cavity collapses leaving a residual hemosiderin-containing scar.
10.4
Subdural and Epidural Hematomas
Chronic subdural hematoma (SDH) occurs in 1–2 per 100,000 people per year (Fogelholm et al. 1975) and is mainly related to a head trauma. The bridging veins that run between the surface of the brain and the intradural venous sinuses are torn from either direct injury or indirect injury with acceleration, which leads to accumulation of blood in the potential subdural space. Non-traumatic SDHs are rare. They may result from convexity vascular malformations, hemorrhagic diathesis or brain tumors such as meningioma or meningeal carcinomatosis (Markwalder 1981). As the inner membrane of the fluid collection lacks blood vessels, the expansion of a SDH is believed to be due to recurrent microhemorrhages from the vascularized outer membrane. Although the hyperattenuating acute phase of SDH can be reliably identified on CT, the isoattenuating subacute phase may be missed unless a contrast agent is used. CT may also be unable to reliably differentiate a hypoattenuating chronic SDH from a subdural hygroma (Markwalder 1981). Moreover, beam hardening artifacts of CT may interfere with diagnosis of posterior fossa SDH, and a routine axial CT scan may miss those SDHs that spread along the tentorium or along the inferior surface of cerebral hemispheres. Finally, SDH may occasionally be con-
MR Detection of Intracranial Hemorrhage |
165 |
fused with SAH on CT, and therefore erroneously give a mandate for angiography (Rabinstein et al. 2003). For all these reasons MR imaging is increasingly used in the assessment of possible SDHs.
The MR imaging features of acute and subacute SDHs resemble the changes seen in ICH (Fobben et al. 1989). However, the high oxygen tension found in a SDH may delay the evolutionary appearance on MRI. Acute hematomas (1 week) give dark signals in long TR/long TE images due to susceptibility effects. In the early subacute period (< 2 weeks) peripheral bright signals with central hypointensity may be observed on all sequences presumably due to formation of extracellular methemoglobin at the periphery. In the late subacute phase (> 2 weeks and < 1 month) the clot becomes uniformly hyperintense. Hemosiderin is infrequently observed in the subacute phase as the subdural space is lying outside the blood-brain barrier, so that hemosiderin is removed into the bloodstream. As the blood products are gradually absorbed, the signal intensity of chronic SDH decreases on T1-weighted images and appears hypointense or isointense relative to the gray matter, but still more intense than the CSF probably due to higher protein concentration. While this is considered to be the typical pattern of chronic SDH, Tsutsumi et al. (1997) reported that half the chronic SDHs among 199 patients showed mixed signals in T1. These authors also reported that chronic SDHs featuring homogeneous hyperintense signals on T1weighted images were less likely to show recurrent bleedings following surgical evacuation than hematomas appearing predominantly isoor hypointense. This may be related to the maturity of the outer vascular membrane, with immature membranes being more prone to bleeding (Tsutsumi et al. 1997). Even though hemosiderin formation is uncommon in chronic SDHs, large inhomogeneous hematomas can show a dark band along the inner membrane on T2*-weighted images (Imaizumi et al. 2003). The dark band results probably from the accumulation of hemosiderin-laden macrophages in the inner membrane and can disappear soon after successful evacuation of the hematoma. Finally, to differentiate a chronic SDH from a subdural hygroma, protondensity weighted sequences or FLAIR are required. In fact, SDHs may occasionally exhibit CSF-like signals on T1and T2-weighted SE sequences, but will appear more intense than CSF on proton-density weighted and FLAIR images (Tsutsumi et al. 1997).
Epidural hematomas show signal changes similar to SDH. The displacement of the T2-hypointense dural membrane inward with lenticular shape of the
clot is helpful in differentiating epidural bleedings from SDH, even though one may encounter difficulties in the acute phase since the clot and the dura both appear dark.
10.5
Subarachnoid Hemorrhage
With an incidence rate in the general population of around six cases per 100,000, SAH is responsible of 3% of all acute strokes and of 5% of stroke-related deaths (Sudlow and Warlow 1997; van Gijn and
Rinkel 2001). Rupture of intracranial saccular aneurysm accounts for about 85% of cases of SAH. Perimesencephalic bleedings, a distinct and more benign type of SAH of probable venous origin, is responsible for a further 10% of cases. The remaining 5% of SAHs is due to miscellaneous conditions like trauma, intracranial arterial dissection, vascular malformations, vascular lesions of the spine, mycotic aneurysms, pituitary apoplexy, and cocaine abuse (van Gijn and Rinkel 2001).
Prompt identification of SAH and of the underlying aneurysm is crucial, as timely coiling or clipping will prevent re-bleed and the related morbidity and mortality. CT is considered the initial investigation of choice for diagnosis of acute SAH. Occasionally, lumbar puncture can be needed when the CT is negative in a patient whose clinical history is strongly suggestive of SAH (Macdonald et al. 2001; van Gijn and Rinkel 2001). CT shows the acute SAH as high attenuation areas filling the cisterns and sulci. About 90%–95% of CT will be positive for SAH in the first 24 h. However, this percentage drops to 80% at 3 days, to 70% at 5 days, to 50% at 1 week and to 30% at 2 weeks. After 3 weeks it is difficult to detect SAH with CT (van Gijn and van Dongen 1982; Adams et al. 1983), but even in the acute phase CT can miss the diagnosis if the amount of SAH is small (Noguchi et al. 2000). False negatives at CT can also be due to isolated SAH in the posterior fossa, where the hyperdense blood may be masked by beam hardening artifacts (Woodcock et al. 2001). Occasionally, a false positive diagnosis of SAH on CT may be due to diffuse cerebral edema (van Gijn and van Dongen 1982). At least in these situations MRI seems to hold an advantage over CT in diagnosing or ruling out SAH.
T1and T2-weighted MR images are insensitive in the detection of acute SAH. In some cases T1 shortening effects from raised protein levels due
166 |
T. Krishnamoorthy and M. Fiorelli |
to SAH may be visible on T1-weighted SE images as signals relatively hyperintense to CSF and hypointense to brain parenchyma. However, as there is no methemoglobin formation in the acute stage, bright signals on T1-weighted sequence are not observed. T2-weighted images may occasionally show signals brighter than CSF (Rumboldt et al. 2003).
The skepticism on the ability of conventional MRI in detecting SAH is giving way to optimism as FLAIR imaging has been shown to be fairly accurate in the detection of acute subarachnoid bleedings. In fact, animal models suggest that FLAIR can be more sensitive than CT in the evaluation of acute SAH (Woodcock et al. 2001) even when the amount of blood is very small and diluted by CSF (Noguchi et al. 2000). In FLAIR an inversion pulse is utilized to null the bright CSF signals in T2-weighted images with long TE. Due to its high protein concentration and T1 shortening effect, the acute subarachnoid bleeding will appear bright on FLAIR.
As with intraparenchymal bleeds, a T2*-weighted GRE sequence may be expected to show signal loss from susceptibility effects in the cisterns and sulci in acute SAH. However, T2*-weighted sequences may not be sensitive enough within the first 24 h, either due to high oxygen levels in CSF which prevents formation of paramagnetic deoxyhemoglobin or to over hydration of RBCs (Noguchi et al. 1997). Nevertheless, one may observe susceptibility effects in the hyperacute stage in thick clots, where deoxyhemoglobin formation goes unimpeded.
While FLAIR may be very sensitive in the detection of acute SAH, its specificity for this disease is suboptimal. All conditions causing an elevation of CSF proteins, such as pyogenic meningitis, granulomatous meningitis, meningeal carcinomatosis etc., characteristically elevate the CSF protein levels and give rise to bright signals on FLAIR. Fat from ruptured dermoid or previous introduction of oily contrast media may also mimic SAH on FLAIR due to T1 shortening effects. Therefore, in order to confidently made a diagnosis of SAH on FLAIR, a careful appraisal of the clinical history is mandatory. Contrast may be helpful to exclude meningitis, while fat may be identified using chemical shift artifacts or fat saturation sequences. Another pitfall with FLAIR sequences may be represented by the CSF pulsation artifacts from inflow and misregistration effects (Noguchi et al. 1997). These artifacts create bright signals in the cisterns especially with fast FLAIR sequences. Hence, FLAIR may not be suitable to assess the posterior fossa SAH. IV propofol anesthesia in children (Filippi et al. 2001) or supplemental
oxygen administered during anesthesia (Deliganis et al. 2001; Anzai et al. 2004) are further conditions which can give rise to bright CSF signals on FLAIR.
Proton density-weighted images seem to be as sensitive as FLAIR in detecting SAHs of less than 24 h . CSF flow artifacts in cisterns and ventricles are less likely to be observed with proton density than with FLAIR (Wiesmann et al. 2002). A recent report suggests that proton-density weighted sequences allow an accurate diagnosis of hyperacute SAH (Fiebach et al. 2004).
As the delay between SAH onset and imaging increases, susceptibility effects appear and T2*- weighted GRE images become more sensitive compared to FLAIR. Mitchell et al. (2001) have shown 94% sensitivity for T2* in the acute phase (less than 4 days) and 100% in the subacute phase (more than 4 days) compared to 81% and 87% for FLAIR. T2*- weighted images may also help localize previous SAH and locate the aneurysm. This may have an implication in diagnosing aneurysms with minor leak or to identify the culprit among multiple aneurysms (Imaizumi et al. 2003). Finally, contrast studies may exceptionally reveal an actual leakage of the contrast (Küker et al. 1999).
10.6
Intraventricular Hemorrhage
Most intraventricular hemorrhages (IVHs) are secondary to ICH or SAH. Isolated IVH is rare and usually due to the rupture of underlying vascular malformations (Zhu et al. 1997). Angiography is therefore strongly recommended for isolated IVHs (Broderick et al. 1999). Few data on MR features of IVH are available in the literature (Bakshi et al. 1999). Based on MR imaging, intraventricular bleedings have been classified into clotted IVH, usually unilateral, and layered IVH, usually bilateral. Since the CSF in ventricles has a higher content in oxygen and glucose, the layered form evolves more slowly compared to the clotted form. The latter evolves at a rate similar to ICH. However, in the chronic stage, unlike ICH, IVHs do not show hemosiderin formation. Among the conventional sequences, proton density depicts IVH better than T1and T2-weighted images. In the acute stage FLAIR may have better sensitivity than CT scan to demonstrate IVH. On FLAIR, in the initial 48 h IVH appears hyperintense, but one should be aware of the CSF flow artifacts, which can mimic the presence of blood. Also, conditions like pyocephalus
MR Detection of Intracranial Hemorrhage |
167 |
or intraventricular tumors may exhibit signals similar to IVH. After the acute phase, IVHs may appear isoor hypointense on FLAIR. At this stage, a bright signal on T1-weighted images and a hypointense signal on T2*-weighted image will mark the presence of an IVH (Bakshi et al. 1999).
10.7
Hemorrhagic Infarction
Hemorrhagic infarction (HI) may result either from the hemorrhagic conversion of an arterial ischemic stroke or, more rarely, from cerebral venous thrombosis (CVT). Autopsy studies indicate that hemorrhagic conversion occurs in 30% of recent ischemic brain infarcts (Hart and Easton 1986). The pathophysiological basis of hemorrhagic transformation is the microvascular injury to the blood-brain barrier due to ischemia and the subsequent reperfusion (del Zoppo et al. 1998). The two main types of hemorrhagic transformation are petechial hemorrhages (hemorrhagic infarction proper) or parenchymal hematoma. Hemorrhagic transformation is more commonly observed in the gray matter regions than in the subcortical white matter (Hornig et al. 1986).
The few existing studies on MR evaluation of HI emphasize the importance of T2*-weighted GRE sequences to detect hemorrhagic changes. Hermier et al. (2001) reported that these sequences are as effective or more effective than CT in the detection of acute HI. However, as for other types of parenchymal bleedings, one should be aware of other causes of signal loss on T2*-weighted images such as calcification, flow void, cavernomas, etc. Even chronic
cerebral microbleeds (discussed in the following sections) may mimic hemorrhagic conversion. However, microbleeds usually measure less than 5 mm and are expected to be located outside the area of infarction.
Brain MRI in combination with venous MRA is considered as the gold standard for diagnosing CVT (Lee and Terbrugge 2003, see chapter 18). Cortical and subcortical bright (edema, necrosis) and dark (deoxyhemoglobin) signals on FLAIR, T2-weighted and especially T2*-weighted images not corresponding to any arterial territory, in the background of an appropriate clinical history (acute focal deficit, headache, and seizures), are suggestive of venous infarcts. The cortical veins or dural sinuses should be carefully scrutinized to identify the thrombosis. In the acute stage the thrombus in the veins or sinuses will appear isoor hypointense on T1-weighted images and profoundly hypointense on T2-weighted images, which may mimic flow in T2-weighted SE/ FSE sequences. It is often only after 3–7 days that the thrombus becomes hyperintense in T1.
10.8
Cerebral Microbleeds
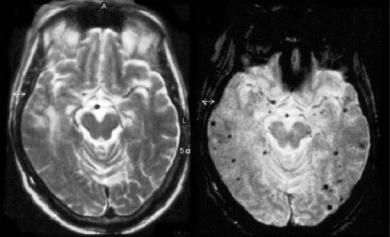
Cerebral microbleeds (MBs) are chronic hemosiderin deposits caused by minor extravasations of blood from fibrohyalinized small arterioles (Fazekas et al. 1999). They are increasingly being recognized thanks to the increased use of T2*- weighted GRE sequences in the clinical practice. CT, but also conventional SE T2-weighted sequences, are insensitive in the detection of such microhemorrhages (Fig. 10.3). MBs have a strong association
Fig. 10.3. Patient showing an unremarkable T2-weighted image (right) and multiple microbleeds on the T2*-weighted image (left)