

Книги по МРТ КТ на английском языке / Magnetic Resonance Imaging in Ischemic Stroke - K Sartor R 252 diger von Kummer Tobias Back
.pdf148
Van Lookeren Campagne M, Thomas GR, Thibodeaux H, Palmer JT, Williams SP, Lowe DG, van Bruggen N (1999) Secondary reduction in the apparent diffusion coefficient of water, increase in cerebral blood volume, and delayed neuronal death after middle cerebral artery occlusion and early reperfusion in the rat. J Cereb Blood Flow Metab 19:1354–1364
Virley D, Beech JS, Smart SC, Williams SC, Hodges H, Hunter AJ (2000) A temporal MRI assessment of neuropathology after transient middle cerebral artery occlusion in the rat: correlations with behavior. J Cereb Blood Flow Metab 20:563–582
Vo KD, Santiago F, Lin W, Hsu CY, Lee Y, Lee JM (2003) MR imaging enhancement patterns as predictors of hemorrhagic transformation in acute ischemic stroke. AJNR Am J Neuroradiol 24:674–679
Warach S (2001) New imaging strategies for patient selection for thrombolytic and neuroprotective therapies. Neurology 57:S48–S52
S. Wegener et al.
Wardlaw JM, Keir SL, Seymour J, Lewis S, Sandercock PA, Dennis MS, Cairns J (2004) What is the best imaging strategy for acute stroke? Health Technol Assess 8:iii, ix- x, 1–180
Weber R, Wegener S, Ramos-Cabrer P, Wiedermann D, Hoehn M (2005) MRI detection of macrophage activity after experimental stroke in rats: new indicators for late appearance of vascular degradation? Magn Rreson Med 54(1):59-66
Wegener S, Weber R, Ramos-Cabrer P, Uhlenkueken U, Wiedermann D, Kandal K, Villringer A, Hoehn M (2005) Subcortical lesions after transient thread occlusion in the rat: T2-w magnetic resonance imaging findings without corresponding sensorimotor deficits. JMRI 21(4):340346
Yepes M, Sandkvist M, Moore EG, Bugge TH, Strickland DK, Lawrence DA (2003) Tissue-type plasminogen activator induces opening of the blood-brain barrier via the LDL receptor-related protein. J Clin Invest 112:1533–1540

MR Imaging of White Matter Changes |
149 |
9MR Imaging of White Matter Changes
Johanna Helenius and Turgut Tatlisumak
CONTENTS
9.1 |
Cerebral White Matter 149 |
9.2 |
White Matter Changes (Leukoaraiosis) 149 |
9.2.1What Is Leukoaraiosis? 149
9.2.2Epidemiology 150
9.2.3 |
Pathophysiological and Clinical Aspects 150 |
9.3 |
Computed Tomography Findings 151 |
9.4Conventional Magnetic Resonance Imaging
Findings 151
9.4.1 Rating Scales for Leukoaraiotic Changes 153
9.5Diffusion-Weighted (DWI) and Diffusion Tensor
Magnetic Resonance Imaging Findings 154
9.6Perfusion Magnetic Resonance Imaging (PI) Findings 157
9.7Management 157 References 158
9.1
Cerebral White Matter
The cerebral white matter (WM) surrounds the subcortical gray matter (GM) and intervenes between it and the cerebral cortex. The cerebral WM consists of fibers of axons and their myelin sheaths. The whitish color is given by the myelin content. Approximately half of the brain weight and volume is formed by the WM. The WM is developed from the external marginal zone of neural tube, as the marginal zone consists of nerve cell processes that evolve into WM when myelinated. Each neuron has a single axon that may have a length of micrometers to over 1 m and a diameter of 0.1 µm to more than 20 µm. Most axons are covered by multiple concentric layers of myelin, a lipidand protein-rich insulating material formed by oligodendrocytes in the central nervous system. Their function is to provide neurons with
J. Helenius, MD, PhD
T. Tatlisumak, MD, PhD
Department of Neurology, Helsinki University Central
Hospital, Haartmaninkatu 4, 00290 Helsinki, Finland
structural support and maintain local conditions for neuronal function. Myelinization starts about the middle of fetal life; some tracts are not completely myelinated until 20 years of age. However, most myelinization is completed by 18 months of life. The phylogenetically oldest tracts myelinate first (e.g. tracts within the spinal cord) whereas the corticospinal tracts myelinate largely during the first and the second years of life. The WM contains less water and more lipid than the GM. While average cerebral blood flow (CBF) is approximated to be 45–55 ml/100 g/min, it is about 80 ml/100 g/min in the GM, and only 20 ml/100 g/min in the WM (Lassen 1985; Moody et al. 1990).
The dense intermingling of nerve fibers within the WM connects different regions of the brain with each other. Projectional fibers connect cerebral cortex and subcortical structures as well as cerebellum; commissural fibers connect homologous areas between the two hemispheres of brain, and the association fibers connect various regions within the same cerebral hemisphere. The major function of the cerebral WM is simply to interconnect various regions of brain and transmit signals in-between them.
9.2
White Matter Changes (Leukoaraiosis)
9.2.1
What Is Leukoaraiosis?
Cerebral WM changes (WMC) are found in a number of diseases of adulthood, such as the debated Binswanger’s disease, multiple sclerosis, acute demyelinating encephalomyelitis, posterior reversible leukoencephalopathy syndrome, cerebral anoxia, leukodystrophies, and mitochondrial encephalopathies, among others. The term leukoaraiosis (LA) is applied for nonspecific WMC, primarily in the elderly, that cannot be attributed to a
150 |
J. Helenius and T. Tatlisumak |
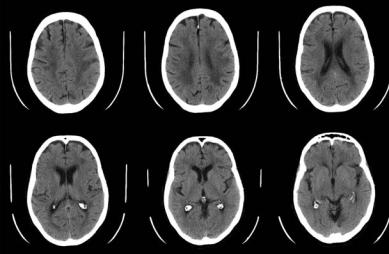
specific disease. Several terms other than LA, such as unidentified bright objects and incidental subcortical lesions, are also used to describe these lesions. In 1987, Hachinski and coworkers used the term leukoaraiosis (from the Greek; leuko = white and araiosis = rarefied, of loose texture, or rarefaction) to describe an abnormal computed tomography (CT) appearance of the subcortical brain WM in elderly or demented individuals, seen as bilateral patchy or diffuse areas of reduced X-ray attenuation (hypointense) with ill-defined margins, limited to the periventricular regions or extended to the centrum ovale (Fig. 9.1). On the contrary, LA appears as hyperintense lesions in periventricular or subcortical regions on T2-weighted or fluid attenuated inversion recovery (FLAIR) magnetic resonance imaging (MRI) sequences.
9.2.2 Epidemiology
The frequency of LA increases considerably with age. Under 50 years of age, prevalence on CT is only a few percent, and over the age of 50 the prevalence increases twoto three-fold with every decade. LA is a common finding, and its frequency in older patient groups has ranged between 21% and 100% depending on the imaging method used and on the study population; its exact frequency is still under debate since no agreement between the various rating scales exists between centers, and CT and different sequences of MRI detect LA differently. In healthy subjects, it is found in 1%–10% when studied with CT and in 27% with MRI (Breteler et al. 1994). In the Cardiovascular Health Study, among
3660 community-living elderly participants, the incidence of LA increased more rapidly with age in the group of individuals with some risk factors or findings of cardiovascular disease than in the healthier subgroup (Yue et al. 1997). Furthermore, the degree of LA was higher in women than in men in both this and the later Rotterdam Scan Study where 1077 subjects aged between 60 to 90 were randomly sampled from the general population and evaluated by MRI (de Leeuw et al. 2001). In the Rotterdam Scan Study, only 5% of the individuals were completely free of LA (de Leeuw et al. 2001).
9.2.3
Pathophysiological and Clinical Aspects
Chronic cerebral ischemia and hypoperfusion due to various reasons are thought to be the main etiologies for LA (Pantoni and Garcia 1997). Some individuals, regardless of the severity of LA, remain neurologically and neuropsychologically asymptomatic for prolonged periods, while others develop cognitive impairment, mood and psychiatric disorders, gait disturbance, urinary dysfunctions, disability, and even dementia. LA has been found to be associated with significantly lower scores on neuropsychological test batteries (Breteler et al. 1994), and an independent risk factor for dementia. As depicted in the Cardiovascular Health Study (Bryan et al. 1997) and later in the Rotterdam Scan Study (Vermeer et al. 2003), LA does seem to increase morbidity and mortality, and to enhance the risk for ischemic stroke even in neurologically asymptomatic elderly patients.
Fig. 9.1. Computed tomography (CT) images of a 75-year-old patient with widespread and symmetrical leukoaraiotic changes
MR Imaging of White Matter Changes |
151 |
In autopsy studies, leukoaraiotic regions have been found to consist of periventricular venous collagenosis, perivascular degeneration with widening of extracellular and perivascular spaces, arteriolar tortuosity, lacunar infarcts, incomplete infarctions, apoptosis, gliosis, axonal loss with loosening of the WM structure, and proliferation of glial cells (Moody et al. 1995; Brown et al. 2000, 2002; Murdoch 2000). Axonal loss leads to an increase in water content of affected brain tissue. The findings suggest that an inflammatory reaction, changes in myelin, and compromised axonal transport, all of which are affected in chronic ischemia, may play important roles in the pathophysiology of LA. Further support for the role of chronic ischemia comes from the markers of chronic endothelial dysfunction and prothrombic changes in patients with LA (Hassan et al. 2003).
Wallerian degeneration, seen in the cerebral and spinal WM, is the descending destruction of axons and myelin sheaths resulting from more proximal neuronal damage, such as that due to ischemic infarction or hemorrhage and is different from LA. It is characterized by disintegration of axonal structures within days after injury, followed by degradation of myelin due to infiltration of macrophages, leading finally to fibrosis and atrophy of the affected fiber tracts. In the chronic stage of Wallerian degeneration, the destruction of myelin sheaths can be detected by CT. Conventional MRI detects varying signal intensity changes during the time course of Wallerian degeneration several weeks after the injury. Short phase of hypointensity of T2-weighted images is followed by hyperintensity along the affected tracts. However, in the first days and weeks, Wallerian degeneration can be detected neither by CT nor by conventional MRI. Instead, diffusion tensor imaging, being particularly suitable for imaging white matter tracts in vivo, seems to display characteristic changes of water diffusion already within the first weeks after the injury. A decrease of the fractional anisotropy indicates disintegration of axonal structuresand myelin (Thomalla et al. 2004).
Many individuals with LA also harbor lacunar and/or cortical infarcts. Presence of LA serves as an intermediate surrogate both for ischemic stroke and intracerebral hemorrhage as they all share similar risk factors and similar pathophysiological mechanisms (Inzitari 2003). LA is widely found in dementing illnesses, such as Alzheimer’s disease, vascular dementia, and cerebral autosomal dominant arteriopathy with subcortical infarcts and leukoencephalopathy (CADASIL). Failure of blood supply in the
small arteries of the brain, chronic brain ischemia due to various reasons, diabetes mellitus, brain blood pressure dysregulation, and especially high systemic arterial blood pressure are associated with LA (Pantoni and Garcia 1995).
9.3
Computed Tomography Findings
The application of CT for three decades revealed an unexpected amount of LA in both healthy and cognitively impaired individuals. Originally, the term LA was introduced to describe the WMC in periventricular or subcortical regions seen hypointense on CT. Therefore, the term LA is originally described based upon CT findings, and some of the findings with MRI may be of doubtful significance. CT shows the most pronounced findings of LA (Fig. 9.1), while MRI detects the lesions in smaller and in earlier stages (Fig. 9.2). In general, MRI is overwhelmingly more sensitive than CT in detecting LA.
9.4
Conventional Magnetic Resonance Imaging Findings
Conventional MRI detects LA with low specificity but high sensitivity. However, most of the diseases of the WM are far less frequent than leukoaraiotic changes that are found usually in healthy but aging brain and with cerebrovascular risk factors. Additionally, most of the diseases affecting the WM manifest themselves with characteristic clinical features unlike incidental LA.
T2-weighted, proton-density-weighted, and FLAIR imaging are highly sensitive in the detection of LA. Since T2-weighted imaging is sensitive to liquid, gliosis, and the effects of demyelination, some of the lesions seen on T2-weighted imaging may represent Virchow-Robin (VR) spaces instead of leukoaraiotic lesions or have no neuropathological correlates at all (Fig. 9.3). T1-weighted imaging is the least sensitive, as leukoaraiotic changes are seen as hypointense regions or no change at all.
VR space, or perivascular space, is an invagination of the subpial space surrounding a vessel going into the brain. VR spaces surround arteries, veins, arterioles, and venules. VR spaces enlarge and become numerous by advancing age, hypertension,
152 |
J. Helenius and T. Tatlisumak |
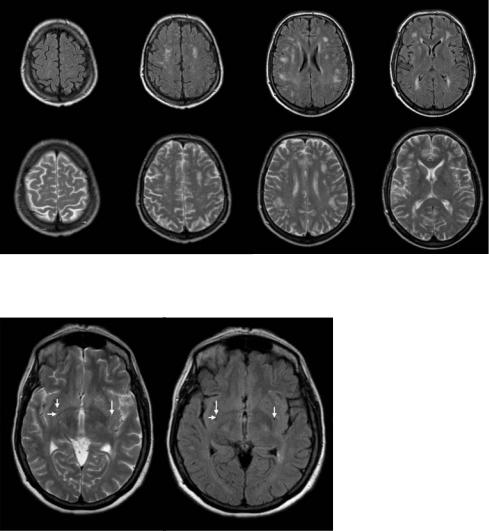
Fig. 9.2. Fluid-attenuated inversion recovery (FLAIR, upper row) and T2-weighted (lower row) magnetic resonance images demonstrating early small focal lesions of leukoaraiosis
Fig. 9.3. Virchow-Robin spaces marked with arrows on T2-weighted (left) and FLAIR (right) images. They appear bright on T2-WI and can be differentiated from pathological changes only when both images are evaluated simultaneously
and dementia (Heier et al. 1989). The significance of VR spaces is not to confuse them with lacunar infarcts or with LA. Because perivascular spaces are filled with extracellular fluid, their signal is similar to that of cerebrospinal fluid on all pulse sequences. On FLAIR images, the CSF is hypointense compared to brain tissue and VR spaces also appear dark (hypointense) whereas they appear bright (hyperintense) on T2-weighted images (Fig. 9.3).
FLAIR is an inversion recovery sequence with long repetition and echo times and an inversion time that is tailored to null the signal from CSF. Most pathologic processes including LA show increased signal intensities on T2-weighted images and the conspicuity of lesions located close to interfaces between brain parenchyma and CSF may be poor (Rumboldt and Marotti 2003). Additionally, the
high signal of CSF on T2-weighted images makes it difficult to differentiate VR spaces from true lesions. FLAIR images are heavily T2-weighted with CSF signal suppression, highlighting hyperintense lesions and improving their detection when located adjacent to CSF-containing spaces and differentiating VR spaces from lesions as these spaces appear as hypointense like CSF on FLAIR images.
Previously, it has been thought that LA is limited to the supratentorial part of the brain, and even in that case they do not affect the internal capsule. However, with advancements in neuroimaging and research work, it recently became evident that similar lesions can be seen in the pons (Fig. 9.4) and the internal capsule (Fig. 9.5). The LA lesions around the horns of ventricles are usually homogeneous, while those in other regions of WM tend to appear as mul-

MR Imaging of White Matter Changes |
153 |
Fig. 9.4. Pontine leukoaraiosis appearing hyperintense on T2-weighted (left) and FLAIR (middle) images and on an ADC map (right)
Fig. 9.5. T2-weighted (left) and FLAIR (right) images demonstrating a leukoaraiotic lesion in the left internal capsule (on the right side of the image)
tiple smaller lesions unless LA is extremely severe. The subcortical u-fibers and corpus callosum are usually spared from LA changes due to their favorable blood supply.
9.4.1
Rating Scales for Leukoaraiotic Changes
The classification of LA according to its severity and extent is a real challenge. Several rating scales with varying approaches exist. Some make a distinction between different regions, while others use an overall estimate of LA. The scales often refer to definite pulse sequences or imaging methods. A previously validated rating scale utilizing MRI that was developed at our hospital will be presented below,
since it takes widely into account the number, size, and shape of the leukoaraiotic lesions. Although the numerous rating scales in the literature have different approaches to evaluating the LA, comparison of the results between studies has been deemed to be reasonable.
WM lesions are rated separately in four WM areas: periventricular, deep, watershed, and subcortical WM. By definition, periventricular WM foci have to be in contact with the ventricular wall, deep WM foci separated from the ventricles by a strip of normal-appearing WM and located outside watershed regions. Watershed regions are the areas located between the territories of two of the main cerebral arteries, like middle cerebral artery and anterior cerebral artery or middle cerebral artery and posterior cerebral artery. The subcortical

154 |
J. Helenius and T. Tatlisumak |
region represents the area less than 5 mm beneath the cortex. Foci, which affect some part of this area and are located outside watershed regions, should be rated as subcortical changes.
Periventricular hyperintensities (PVH) are classified based on size and shape into small cap, large cap, and extending cap. Small cap is a hyperintensity lesion of 5 mm or less in diameter, rounded and with regular margins, large cap is 6–10 mm in diameter and has mostly regular margins, while extending cap is over 10 mm in diameter and has irregular margins (Fig. 9.6). The size of the cap is measured in a direction parallel to the axis of the ventricular horn.
PVHs along the bodies of lateral ventricles are classified based on thickness and shape into thin lining, smooth halo, and irregular halo. Thin lining is a hyperintense lining 5 mm or less and has regular margins, smooth halo is 6–10 mm broad and has mostly regular margins, and irregular halo is over 10 mm broad, has irregular margins and extends into the deep WM (Fig. 9.6).
Hyperintensities over other WM regions (HI) are classified based on size and shape into small focal, large focal, focal confluent, diffusely confluent, and extensive WM changes. Small focal lesions are punctate hyperintensities of 5 mm or less and are mostly rounded. Large focal lesions are 6–10 mm in diameter and are mostly rounded; focal confluent lesions are 11–25 mm, have often various shapes and may have irregular borders. Diffusely confluent lesions are over 25 mm, mostly with irregular borders,
while extensive WM changes are diffuse regions without distinct focal lesions affecting the majority of the WM area (Fig. 9.7). The number of each type of leukoaraiotic change is counted, and extensive WM changes are rated as absent or present.
PVHs are graded into four categories: 0, absence of PVH; 1, small caps or thin lining; 2, large caps or smooth halo; 3, extending caps or irregular halo. The side, which is more affected, is taken into account. HIs are rated separately in watershed, deep and subcortical white matter into six grades: 0, absence of HI; 1, only small focal lesions; 2, at least one large focal, no confluent lesions; 3, at least one focal confluent, no diffusely confluent lesions; 4, at least one diffusely confluent lesion; 5, extensive HI lesions (Table 9.1).
9.5
Diffusion-Weighted (DWI) and Diffusion Tensor Magnetic Resonance Imaging Findings
Diffusion-weighted magnetic resonance imaging (DWI) provides an image contrast that is dependent on the molecular motion of water (diffusion), which is called Brownian movement. After Stejskal and Tanner described a diffusion-weighted spinecho T2-weighted pulse sequence with two extra gradient pulses equal in magnitude and opposite in
a |
b |
c |
d e f
Fig. 9.6a–f. Periventricular white matter changes (FLAIR images). a Small caps around the frontal horns of lateral ventricles. b Large caps. c Extending caps. d Thin lining along the bodies of the lateral ventricles. e Smooth halo. f Irregular halo
MR Imaging of White Matter Changes |
155 |
a |
b |
c |
d e f
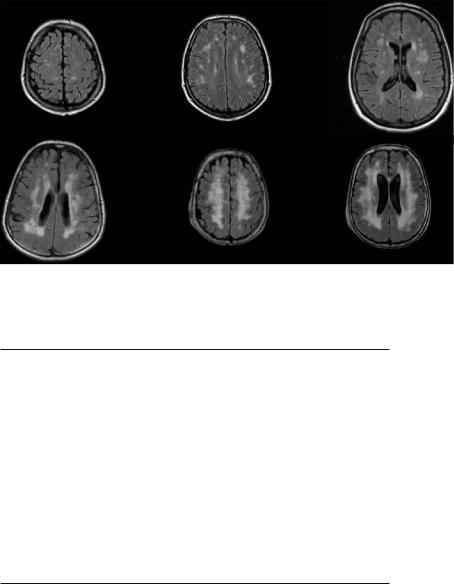
Fig. 9.7a-f. White matter changes in regions other than the periventricular area (FLAIR images). a Multiple small focal lesions. b Multiple large focal lesions. c Multiple focal confluent lesions. d Diffusely confluent lesions irregular in shape. e,f Extensive WM changes
Table 9.1. Rating scale for leukoaraiotic changes
Periventricular Hyperintensities (PVH)
Around frontal and occipital horns:
Small cap: ≤ 5 mm, rounded, regular margins
Large cap: 6–10 mm, mostly regular margins
Extending cap: >10 mm, irregular margins
Along the bodies of lateral ventricles:
Thin lining: ≤ 5 mm, regular margins
Smooth halo: 6–10 mm, mostly regular margins
Irregular halo: >10 mm, irregular margins
Hyperintensities in the Regions Other Than Periventricular White Matter (HI)
Small focal lesions: ≤ 5 mm, mostly rounded
Large focal lesions: 6–10 mm, mostly rounded
Focal confluent lesions: 11–25 mm, various shapes, may have irregular borders
Diffusely confluent lesions: >25 mm, mostly with irregular borders
Extensive white matter change: diffuse hyperintensity without focal lesions
direction, it took several decades for that sequence to become clinically feasible due to limitations of early MR equipment. The methodology of DWI is discussed in detail in Chap. 7.
Axons transport materials from the cell body to the synaptic terminals (anterograde transport) and in the opposite direction (retrograde transport). Anterograde transport may occur slowly (a few millimeters/ day only) or fast (up to 400 mm/day), whereas retrograde transport is always fast. Diffusion in the perpendicular direction (not along axons) is much more limited as the membranes and the myelin sheath form obstacles. Therefore, diffusion is not isotropic (same in all directions) in the WM. This phenomenon is known as “diffusion anisotropy”. In contrast, diffusion is rel-
atively isotropic in the GM. Since only the molecular displacement that occurs along the direction of gradient pulses is visible, the effect of diffusion anisotropy can easily be detected by observing variations in diffusion measurements after the direction of gradient pulses is changed. With diffusion tensor imaging, anisotropy effects can be extracted, characterized, and exploited, which provides more detailed information on tissue microstructure in healthy and diseased brains. WM tracts can be followed from the cerebral cortex to the spinal cord, and the diseases involving these tracts can be studied. Among the many indices that offer a numerical value for the degree of tissue anisotropy, the relative anisotropy (RA) index is the ratio of the variance of the eigen-values of their mean,
156 |
J. Helenius and T. Tatlisumak |
and is equal to zero in a perfectly isotropic medium. Fractional anisotropy (FA) is the ratio of the anisotropic component of the diffusion tensor and is equal to zero in a perfectly isotropic medium, but approaches 1 for a cylindrically symmetric anisotropic medium. The FA maps demonstrate hyperintensity in regions of brain with anisotropic diffusion, whereas regions with isotropic diffusion will appear hypointense. As diffusion is normally strongly anisotropic in the cerebral WM and anisotropy decreases as a result of LA, FA maps can quantify the degree of LA and may also be useful in a number of other WM disorders. As the WM disease progresses, the FA maps will become darker (hypointense) and the numerical FA value will decrease (Fig. 9.8).
DWI and diffusion tensor imaging provide information on the extent and formation of LA and elucidates the mechanism of LA in vivo. The apparent diffusion coefficient (ADC) value for healthy human brain has been reported to be 0.8 and 1.4×10⁻³ mm2/s for the cortical GM, and 0.6 and 0.9×10⁻³ mm2/s for the WM. However, we found significantly higher ADC values for the regions of LA (0.92–1.27×10⁻³ mm2/s, Fig. 9.9) and slightly but significantly increased ADC values for the WM regions that appeared normal on T2-weighted images from patients with LA (Helenius et al. 2002). In the same study, ADC values of brain infarction were found to be 0.33 to 0.44×10⁻³ mm2/s at 6 hours, 0.31 to 0.42×10⁻³ mm2/s at 24 hours, 0.45
to 0.57×10⁻³ mm2/s at 1 week, 0.56 to 1.60 at 1 month, and 1.26 to 1.93×10⁻³ mm2/s at 3 months after the insult. Therefore, LA could easily be distinguished from early and chronic infarcts, but not of 1-month- old infarcts barely depending on ADC findings (Helenius et al. 2002). Leukoaraiotic regions appear hyperintense on ADC maps and hypointense on FA maps (Jones et al. 1999; Helenius et al. 2002). Even the normal-appearing WM regions on T2-weighted imaging in healthy individuals with LA (Helenius et al. 2002) and in patients with ipsilateral carotid artery stenosis (Soinne et al. 2003a) showed increased ADC values. These findings may account for an early change that might lead to LA in a long period of time, but yet undetectable on conventional images. Furthermore, the conventional images showed no change but ADC values decreased slightly but significantly following carotid endarterectomy in the latter patient group, suggesting that this elevation in ADC values is partly reversible (Soinne et al. 2003a). We therefore coined the term “pre-leukoaraiosis” to define this condition. Long-term observational studies are needed to demonstrate whether these WM regions actually go under leukoaraiotic changes overtime.
According to the neuropathological investigations, one of the consequences of LA is axonal loss, which may lead to an increase in the water content of the brain WM tissue, thereby increasing ADC values and decreasing FA of the regions of LA. One may, there-
a |
b |
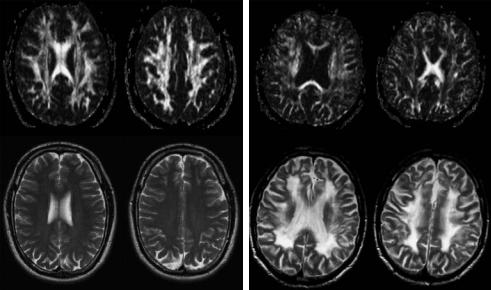
Fig. 9.8a,b. Fractional anisotropy images and T2-weighted images of a healthy individual (a) and of a patient with leukoaraiosis (b). On the left (a) upper row demonstrates high anisotropy on FA maps and T2-weighted images on the lower row appear normal. On the right side (b) FA maps on the upper row demonstrate substantially decreased anisotropy within the WM and on the lower row T2-weighted images show widespread symmetrical leukoaraiosis. (Courtesy of Drs G. Thomalla and T. Kucinski, Hamburg, Germany)
MR Imaging of White Matter Changes |
157 |
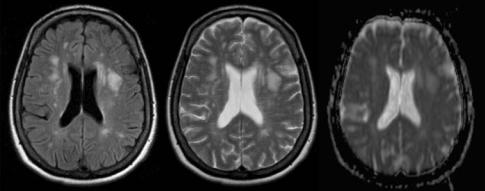
Fig. 9.9. FLAIR (left) and T2-weighted (middle) images, and apparent diffusion coefficient (ADC) map (right) of a patient with leukoaraiosis. Multiple small and large focal lesions can be detected better on the FLAIR image than on the T2-weighted image. Lesions appear hyperintense (bright) on the ADC map indicating increased diffusion
fore, hypothesize that the finding of a relationship between severity of LA and increasing ADC values reflects the extent of axonal loss (Helenius et al. 2002). The partly reversible, preoperatively elevated ipsilateral ADC values in the WM and watershed regions of the high-grade carotid stenosis patients in our study suggest the concomitant existence of both reversible and irreversible components in the pathogenesis of LA, which is triggered and maintained by severe carotid stenosis (hypoperfusion or chronic ischemia). The net decrease observed in ADC values following carotid endarterectomy in those regions supports the hypothesis of a corrective effect on cellu- lar-level mechanisms, one of which could be chronic, ipsilaterally focused relative ischemia.
9.6
Perfusion Magnetic Resonance Imaging (PI) Findings
Brain perfusion refers to the microcirculation of the brain (see Chap. 6). Microcirculation comprises the blood circulation in capillary networks and the exchange of oxygen and nutrients between the blood and the brain tissue. The effectiveness of brain perfusion depends on blood pressure, blood velocity, characteristics of the capillary network, capillary wall permeability, and diffusion rates of oxygen and nutrients. In the healthy brain, perfusion is symmetrical, and is substantially higher in the GM than in the WM. It has been approximated that the CBF is about 80 ml/100 g/min in the GM, and 20 ml/100 g/ min in the WM. Brain perfusion is usually quantified in terms of ml/100 g (cerebral blood volume,
CBV), ml/100 g/min (CBF), or seconds (mean transit time, MTT). The methodology of perfusion imaging (PI) is discussed in detail in Chap. 6.
As the primary hypothesis for the etiology of LA is chronic ischemia of the brain, PI appears to be a suitable tool for investigating this state. Studies of LA with PI are few, but some preliminary conclusions can be drawn. The CBF seems to be the most sensitive perfusion parameter for leukoaraiotic changes. It is consistently lower both in leukoaraiotic regions and in normal-appearing WM of subjects with LA than in healthy controls (Markus et al. 2000; O’Sullivan et al. 2002), supporting hypoperfusion and chronic ischemia being involved in the pathogenesis of LA. Findings in other perfusion parameters have, however, been more variable. High-grade carotid stenosis leading to hypoperfusion and thus to chronic ischemia of the brain has been suspected of inducing LA, and some studies support this expectation (Oppenheimer et al. 1995; Yamauchi et al. 1999; Soinne et al. 2003b). However, PI in LA is still in its early days, and further studies are needed.
9.7 Management
Although the prognosis of an individual LA patient is largely unpredictable, the prognosis of leukoaraiotic patients in general, especially in the most severe groups, is worse than for individuals of similar age, but without this condition. Therefore, the need for primary and secondary preventive measures is clear. As the etiology and pathogenesis of leukoaraiosis seem to be manifold, a single best course of treat-