

Книги по МРТ КТ на английском языке / Magnetic Resonance Imaging in Ischemic Stroke - K Sartor R 252 diger von Kummer Tobias Back
.pdfMR Spectroscopy in Stroke |
179 |
sive studies the complex relations between cerebral bloodflow(CBF)cerebralbloodvolume(CBV),oxygen extraction fraction (OEF) and the metabolic rates for oxygen and glucose metabolism [cerebral metabolic rate of oxygen (CMRO2), cerebral metabolic rate of glucose (CMRglc)] were analyzed (Baron et al. 1983, 1989; Heiss 1992; Heiss and Herholz 1994; Powers et al. 1985; Wise et al. 1983). In contrast to experimental systems with well defined parameters, stroke in human brain proposes a very complex situation with rather limited knowledge of the most important parameters like examination time after stroke onset, whether the occlusion is persistent or just temporary, and whether collateral perfusion is efficient or not. However, longitudinal studies revealed valuable information regarding the still viable tissue at depleted perfusion rates (Hakim 1987; Hakim and Shoubridge 1989; Heiss 1992). This area, the so called penumbra, depicts tissue at risk which may be rescued by adequate therapy. Due to inter-individual differences (collateral perfusion) and intra-individ- ual differences [cell population (Heiss and Rosner 1983)], the differentiation between irreversibly damaged tissue and tissue at risk is difficult to pursue for each case. As already mentioned above, the increasing ability of therapeutic methods like thrombolysis, generated a growing demand for more accurate methods for staging of infarcted tissue. Consequently, a definition of the penumbra aroused from comparison of perfusion imaging (PI) and diffusion weighted imaging (DWI) data assigning those regions to tissue at risk which show depleted perfusion in PI but no increase in ADC. The PI based penumbra may overestimate the area for tissue at risk. In comparison to this penumbra definition, an MRSI penumbra can be postulated as the area which shows increased lactate but no decrease of NAA (at least not below a specific threshold). Adapted to the PET based penumbra definition of Astrup et al. (1981), early lactate increase would mark regions with impaired energy metabolism which potentially can be reversed, while a slowly developing NAA depletion in the center of regions with augmented lactate indicates irreversible cell damage with the well defined morphological changes. Both metabolites can therefore be considered as markers for threshold values verified in various PET studies which indicate the collapse of aerobic energy supply and finally irreversible damage of neurons.
The decrease in ADC in infarcted tissue can be assigned to a shift of water from the extracellular to intracellular compartment (see Chap. 7). While it is generally assumed that the final stage of energy cessation, the reduction of ATP followed by an inflow
of Na+ (cytotoxic cell swelling) is responsible for the massive ADC decrease, also augmented lactate production may induce cell swelling by increasing intracellular osmolality. Especially when the extracellular pH is decreased by accumulation of lactate while the intracellular pH is maintained due to pH homeostasis, the outward directed proton-gradient will further amplify intracellular lactate concentration since lactate as a weak acid will accumulate in the high pH compartment. Consequently, Hoehn-Berlage et al. (1995) and Kohno et al. (1995) could show that areas with decreased ADC values correspond to increased lactate concentrations and significantly extend the area of reduced ATP. Appropriately timed reperfusion confirmed that the ADC decrease can be reversed depending on the metabolic conditions of the tissue (Hossmann 1994; Minematsu et al. 1992). The question remains whether irreversible cell damage is explicitly linked to NAA decrease in acute or hyperacute stroke or whether NAA concentrations stay unaltered even after cytotoxic edema.
A combination of spectroscopy with DWI and PI data is probably the most promising approach for discrimination of tissue at risk from irreversible damaged tissue (Takegami et al. 2001). Both imaging methods require only short acquisition time and can easily be added to the spectroscopy examination. Within the time window of 3 h (Heiss and Graf 1994; Heiss and Herholz 1994) – depending on remaining perfusion – areas could be identified which show increased lactate but no measurable decrease in ADC. Accumulation of lactate as well as decrease in ADC depends on CBF. Below a CBF of 35-40 ml/100 g/min the cerebral lactate concentration is likely to increase (Allen et al. 1993; Kohno et al. 1995; Naritomi et al. 1988; Obrenovitch et al. 1988; Paschen et al. 1992) while values of less than 20 ml/100 g/min will usually correlate with a marked decrease in ADC (Busza et al. 1992). Thus, areas with increased lactate and decreased ADC represent regions with pronounced tissue ischemia within the larger territory of impaired perfusion (Nicoli et al. 2003; Takegami et al. 2001). A mismatch of lactate and ADC decrease (i.e., increased lactate but no change in ADC) in the first hours after stroke onset most probably reveals an area of brain tissue at high risk. Since NAA changes during the first hours are rather marginal we feel that with the current knowledge metabolic maps with lactate in combination with ADC weighted images provide the most suitable tool for detection of a penumbra which is restricted to brain tissue at high risk.
180 |
H. Lanfermann and U. Pilatus |
11.6
Limitations of 1H-MR Spectroscopic Imaging
Compared to MR imaging techniques MRSI offers a rather coarse spatial resolution with a limit between 1.0 and 0.5 cm3. On the one hand, this could lead to an underestimation of lactate concentrations in small lesions while on the other hand the size of the penumbra may be overestimated. Another problem is related to signals from lipids of the skull and bone marrow, which may mask lactate. Several options are available to discriminate the lipids from lactate. Most efficient is a fit of correctly phased spectra recorded at an TE of 144 ms, using an inverted doublet (two negative signals separated by 7.0 Hz). As discussed above, careful visual inspection of spectra to identify the typical lactate doublet in magnitude spectra or in multi-slice CSI with TE of 288 may also provide sufficient power for discrimination of lactate from lipids. However, if no such measures are taken [as it is usually the case for the MSESI technique applied by Stengel et al. (2004)] cortical regions close to the skull can not be incorporated into the ROI for SI.
11.7
Future of 1H-MR Spectroscopic Imaging
•Obtaining isotropic voxels by combination of fast SI techniques with concepts of parallel data acquisition.
•Extending the SI information to other metabolites, e.g., myo-inositol, glutamine, glutamate.
•Development of software tools for robust MRSI spectra analysis combined with easy and intuitively to use graphical user interfaces for interactively viewing and comparing MRSI, DWI, and PI data.
Feasibility studies are already published for topic 1 (Dydak et al. 2003). A potential solution for topic 2 would be a multislice (four slices) short TE (≤ 30 ms) CSI sequence with rectangular FOV where the number of phase encoding steps is reduced by employing parallel data acquisition techniques. Enormous effort is currently put in development of software for analyzing and viewing different MRI modalities. The programs are either installed on the scanner or facilitate an offline analysis on workstations. Also the number of tools for sophisticated offline analysis of SI data is steadily growing (e.g., SI images in Fig. 11.3 are based on the time domain analysis tool jMRUI) while at the same time the software available on the scanner console is also improving. Thus we feel, that in the near future topic 3 will not be one of the limiting factors for MRSI studies.
State of the art spectroscopic imaging determines the spatial distribution of NAA, creatine, choline, and lactate concentrations with less than 1 cm3 resolution. By monitoring biochemical changes, the method provides a unique tool for assessing ischemia related damage of brain tissue; however, for incorporation into a routine MR examination performed in the first hours after stroke, rather short data acquisition times are required. Currently, volume data (i.e., four slices with 1.5 cm thickness) can be recorded in less then 15 min while single slice data acquisition with a fast SI sequence will take less then 7 min. According to our experience, 7 min examination time is tolerable in most cases, thus, metabolic information can be obtained even with the constraints of an emergency MR examination of hyperacute stroke. Given the fact that the maximal MRS examination time should not exceed 10 min, the spatial resolution can not significantly be improved due to limited S/N. Future developments should focus on the following topics:
References
Allen KL, Busza AL, Proctor E, King MD, Williams SR, Crockard HA, Gadian DG (1993) Controllable graded cerebral ischaemia in the gerbil: studies of cerebral blood flow and energy metabolism by hydrogen clearance and 31P NMR spectroscopy. NMR Biomed 6:181-186
Astrup J, Siesjo BK, Symon L (1981) Thresholds in cerebral ischemia – the ischemic penumbra. Stroke 12:723-725
Barker PB, Soher BJ, Blackband SJ, Chatham JC, Mathews VP, Bryan RN (1993) Quantitation of proton NMR spectra of the human brain using tissue water as an internal concentration reference. NMR Biomed 6:89-94
Baron JC, Bousser MG, Comar D, Rougemont D, LebrunGrandie P, Castaigne P (1983) [Positron emission tomography in the physiopathological study of cerebral ischemia in man]. Presse Med 12:3066-3072
Baron JC, Frackowiak RS, Herholz K, Jones T, Lammertsma AA, Mazoyer B, Wienhard K (1989) Use of PET methods for measurement of cerebral energy metabolism and hemodynamics in cerebrovascular disease. J Cereb Blood Flow Metab 9:723-742
Beauchamp NJ, Barker PB,Wang PY, van Zijl PCM (1999) Imaging of acute cerebral ischemia. Radiology 212:307-324
Behar KL, den Hollander JA, Stromski ME, Ogino T, Shulman RG, Petroff OA, Prichard JW (1983) High-resolution 1H
MR Spectroscopy in Stroke
nuclear magnetic resonance study of cerebral hypoxia in vivo. ProcNatl Acad Sci USA 80:4945-4948
Berkelbach van der Sprenkel JW, Luyten PR, van Rijen PC, Tulleken CA, den Hollander JA (1988) Cerebral lactate detected by regional proton magnetic resonance spectroscopy in a patient with cerebral infarction. Stroke 19:15561560
Bottomley PA (1987) Spatial localization in NMR spectroscopy in vivo. Ann NY Acad Sci 508:333-348
Bottomley PA, Edelstein WA, Foster TH, Adams WA (1985) In vivo solvent-suppressed localized hydrogen nuclear magnetic resonance spectroscopy: a window to metabolism? Proc Natl Acad Sci USA 82:2148-2152
Brown TR, Kincaid BM, Ugurbil K (1982) NMR chemical shift imaging in three dimensions. Proc Natl Acad Sci USA 79:3523-3526
Bruhn H, Frahm J, Gyngell ML, Merboldt KD, Hanicke W, Sauter R (1989) Cerebral metabolism in man after acute stroke: new observations using localized proton NMR spectroscopy. Magn Reson Med. 9:126-131
Busza AL, Allen KL, King MD, van Bruggen N, Williams SR, Gadian DG (1992) Diffusion-weighted imaging studies of cerebral ischemia in gerbils. Potential relevance to energy failure. Stroke 23:1602-1612
Duijn JH, Matson GB, Maudsley AA, Hugg JW, Weiner MW (1992) Human brain infarction: proton MR spectroscopy. Radiology 183:711-718
Duyn JH, Frank JA, Moonen CT (1995) Incorporation of lactate measurement in multi-spin-echo proton spectroscopic imaging. Magn Reson Med 33:101-107
Duyn JH, Moonen CT (1993) Fast proton spectroscopic imaging of human brain using multiple spin-echoes. Magn Reson Med 30:409-414
Dydak U, Pruessmann KP, Weiger M, Tsao J, Meier D, Boesiger P (2003) Parallel spectroscopic imaging with spin-echo trains. Magn Reson Med 50:196-200
Felber SR, Aichner FT, Sauter R, Gerstenbrand F (1992) Combined magnetic resonance imaging and proton magnetic resonance spectroscopy of patients with acute stroke. Stroke 23:1106-1110
Frahm J, Bruhn H, Gyngell ML, Merboldt KD, Hanicke W, Sauter R (1989a) Localized high-resolution proton NMR spectroscopy using stimulated echoes: initial applications to human brain in vivo. Magn Reson Med 9:79-93
Frahm J, Bruhn H, Gyngell ML, Merboldt KD, Hanicke W, Sauter R (1989b) Localized proton NMR spectroscopy in different regions of the human brain in vivo. Relaxation times and concentrations of cerebral metabolites. Magn Reson Med 11:47-63
Gideon P, Hendriksen O (1992) In vivo relaxation of N-acety- laspartate, creatine plus phosphocreatine, and choline containing compounds during the course of brain infarction: a proton MRS study. Magn Reson Imaging 10:983-988
Golay X, Gillen J, van Zijl P, Barker P (2002) Scan time reduction in proton magnetic resonance spectroscopic imaging of the human brain. Magn Reson Med 47:384-387
Graham GD, Kalvach P, Blamire AM, Brass LM, Fayad PB, Prichard JW (1995) Clinical correlates of proton magnetic resonance spectroscopy findings after acute cerebral infarction. Stroke 26:225-9
Hacke W, Kaste M, Fieschi C, Toni D, Lesaffre E, von Kummer R, Boysen G, Bluhmki E, Hoxter G, Mahagne MH, Hennerici M (1995) Intravenous thrombolysis with recombinant tissue-
181
plasminogen activator for acute hemispheric stroke – the European Cooperative Acute Stroke Study (Ecass). JAMA 274:1017-1025
Hakim AM (1987) The cerebral ischemic penumbra. Can. J.Neurol.Sci. 14:557-559
Hakim AM, Shoubridge EA (1989) Cerebral acidosis in focal ischemia. Cerebrovasc.Brain Metab Rev. 1:115-132
Heiss WD (1992) Experimental evidence of ischemic thresholds and functional recovery. Stroke 23:1668-1672
Heiss WD, Graf R (1994) The ischemic penumbra. Curr.Opin. Neurol. 7:11-19
Heiss WD, Herholz, K (1994) Assessment of pathophysiology of stroke by positron emission tomography. Eur.J.Nucl. Med. 21:455-465
Heiss WD, Rosner, G (1983) Functional recovery of cortical neurons as related to degree and duration of ischemia. Ann. Neurol. 14:294-301
Hetherington HP, Tan MJ, Luo KL, Pohost GM, Halsey JH, Conger KA (1994) Evaluation of lactate production and clearance kinetics by 1H NMR in a model of brief repetitive cerebral ischemia. J.Cereb.Blood Flow Metab 14:591-596
Hilal SK, Maudsley AA, Simon HE, Perman WH, Bonn J, Mawad ME, Silver AJ, Ganti SR, Sane P, Chien IC (1983) In vivo NMR imaging of tissue sodium in the intact cat before and after acute cerebral stroke. AJNR Am.J.Neuroradiol. 4:245-249
Hoehn-Berlage M, Norris DG, Kohno K, Mies G, Leibfritz D, Hossmann KA (1995) Evolution of regional changes in apparent diffusion coefficient during focal ischemia of rat brain: the relationship of quantitative diffusion NMR imaging to reduction in cerebral blood flow and metabolic disturbances. J Cereb Blood Flow Metab 15:1002-1011
Horska A, Calhoun VD, Bradshaw DH, Barker PB (2002) Rapid method for correction of CSF partial volume in quantitative proton MR spectroscopic imaging. Magn Reson Med 48:555-558
Hossmann KA (1994) Viability thresholds and the penumbra of focal ischemia. Ann Neurol 36:557-565
Houkin K, Kamada K, Kamiyama H, Iwasaki Y, Abe H, Kashiwaba T (1993) Longitudinal changes in proton magnetic resonance spectroscopy in cerebral infarction. Stroke 24:1316-1321
Hugg JW, Duijn JH, Matson GB, Maudsley AA, Tsuruda JS, Gelinas DF, Weiner MW (1992) Elevated lactate and alkalosis in chronic human brain infarction observed by 1H and 31P MR spectroscopic imaging. J.Cereb.Blood Flow Metab 12:734-744
Karnovsky ML (1962) Metabolic basis of phagocytic activity. Physiol Rev 42:143-168
Kettunen MI, Grohn OH, Kauppinen RA (2004) Quantitative T1rho NMR spectroscopy of rat cerebral metabolites in vivo: effects of global ischemia. Magn Reson Med 51:875880
Kohno K, Hoehn-Berlage M, Mies G, Back T, Hossmann KA (1995) Relationship between diffusion-weighted MR images, cerebral blood flow, and energy state in experimental brain infarction. Magn Reson Imaging 13:73-80
Kugel H, Roth B, Pillekamp F, Krüger K, Schulte O, von Gontard A, Benz-Bohm G (2003) Proton spectroscopic metabolite signal relaxation times in preterm infants: a prerequisite for quantitative spectroscopy in infant brain. J Magn Reson Imaging 17:634-640
Lanfermann H, Kugel H, Heindel W, Herholz K, Heiss WD,
182
Lackner K (1995) Metabolic changes in acute and subacute cerebral infarctions: findings at proton MR spectroscopic imaging. Radiology 196:203-210
Levine SR, Helpern JA, Welch KM, Vande Linde AM, Sawaya KL, Brown EE, Ramadan NM, Deveshwar RK, Ordidge RJ (1992) Human focal cerebral ischemia: evaluation of brain pH and energy metabolism with P-31 NMR spectroscopy. Radiology 185:537-544
Maudsley AA, Hilal SK, Perman WH, Simon HE (1983) Spatially resolved high-resolution spectroscopy by “fourdimensional” NMR. J.Magn.Reson. 147-152
Maudsley AA, Matson GB, Hugg JW, Weiner MW (1994) Reduced phase encoding in spectroscopic imaging. Magn Reson Med 31:645-651
Michaelis T, Merboldt K, Bruhn H, Hänicke W, Frahm J (1993) Absolute concentrations of metabolites in the adult human brain in vivo: quantification of localized proton MR spectra. Radiology 187:219-227
Minematsu K, Li L, Sotak CH, Davis MA, Fisher M (1992) Reversible focal ischemic injury demonstrated by diffu- sion-weighted magnetic resonance imaging in rats. Stroke 23:1304-1310
Monsein LH, Mathews VP, Barker PB, Pardo CA, Blackband SJ, Whitlow WD, Wong DF, Bryan RN (1993) Irreversible regional cerebral ischemia: serial MR imaging and proton MR spectroscopy in a nonhuman primate model. AJNR Am J Neuroradiol 14:963-970
Moonen CT, von Kienlin M, van Zijl PC, Cohen J, Gillen J, Daly P, Wolf G (1989) Comparison of single-shot localization methods (STEAM and PRESS) for in vivo proton NMR spectroscopy. NMR Biomed 2:201-208
Nakada T, Houkin K, Hida K, Kwee IL (1991) Rebound alkalosis and persistent lactate: multinuclear (1H, 13C, 31P) NMR spectroscopic studies in rats. Magn Reson Med 18:9-14
Naressi A, Couturier C, Castang I, De Beer R, GraveronDemilly D (2001) Java-based graphical user interface for MRUI, a software package for quantitation of in vivo/medical magnetic resonance spectroscopy signals. Comput Biol Med 31:269-286
Naritomi H, Sasaki M, Kanashiro M, Kitani M, Sawada T (1988) Flow thresholds for cerebral energy disturbance and Na+ pump failure as studied by in vivo 31P and 23Na nuclear magnetic resonance spectroscopy. J. Cereb. Blood Flow Metab 8:16-23
The National Institute of Neurological Disorders and Stroke rt-PA Stroke Study Group (1995) Tissue plasminogen activator for acute ischemic stroke. N Engl J Med 333:15811587
Nicoli F, Lefur Y, Denis B, Ranjeva JP, Confort-Gouny S, Cozzone PJ (2003) Metabolic counterpart of decreased apparent diffusion coefficient during hyperacute ischemic stroke: a brain proton magnetic resonance spectroscopic imaging study. Stroke 34:e82-e87
Obrenovitch TP, Garofalo O, Harris RJ, Bordi L, Ono M, Momma F, Bachelard HS, Symon L (1988) Brain tissue concentrations of ATP, phosphocreatine, lactate, and tissue pH
H. Lanfermann and U. Pilatus
in relation to reduced cerebral blood flow following experimental acute middle cerebral artery occlusion. J.Cereb. Blood Flow Metab 8:866-874
Ordidge RJ, Van de Vyver FL (1985) Re: Separate water and fat MR images. Radiology 157:551-553
Parsons M, Li T, Barber P, Yang Q, Darby D, Desmond P, Tress B, Davis S (2000) Acute hyperglycaemia in stroke leads to increased brain lactate production and greater final infarct size. Stroke 31:2795-2795
Parsons MW, Barber PA, Darby DG, Yang Q, Desmond PM, Gerraty RP, Tress BM, Davis SM (2001) Acute hyperglycemia in stroke leads to increased brain lactate production and greater final infarct size. Stroke 32:331-332
Parsons MW, Barber PA, Desmond PM, Baird TA, Darby DG, Byrnes G, Tress BM, Davis SM (2002) Acute hyperglycemia adversely affects stroke outcome: a magnetic resonance imaging and spectroscopy study. Annals of Neurology 52:20-28
Paschen W, Mies G, Hossmann KA (1992) Threshold relationship between cerebral blood flow, glucose utilization, and energy metabolites during development of stroke in gerbils. Exp.Neurol 117:325-333
Petroff OA, Graham GD, Blamire AM, al Rayess M, Rothman DL, Fayad PB, Brass LM, Shulman RG, Prichard JW (1992) Spectroscopic imaging of stroke in humans: histopathology correlates of spectral changes. Neurology 42:1349-1354
Posse S, Tedeschi G, Risinger R, Ogg R, Le Bihan D (1995) High speed 1H spectroscopic imaging in human brain by echo planar spatial-spectral encoding. Magn Reson Med 33:34-40 Powers WJ, Grubb RL Jr, Darriet D, Raichle ME (1985) Cerebral blood flow and cerebral metabolic rate of oxygen requirements for cerebral function and viability in humans.
J.Cereb.Blood Flow Metab 5:600-608
Provencher SW (1993) Estimation of metabolite concentrations from localized in vivo proton NMR spectra. Magn Reson Med 30:672-9
Sager TN, Laursen H, Hansen AJ (1995) Changes in N-acetyl- aspartate content during focal and global brain ischemia of the rat. J Cereb Blood Flow Metab 15:639-646
Sappey-Marinier D, Hubesch B, Matson GB, Weiner MW (1992) Decreased phosphorus metabolite concentrations and alkalosis in chronic cerebral infarction. Radiology 182:29-34
Stengel A, Neumann-Haefelin T, Singer OC, NeumannHaefelin C, Zanella FE, Lanfermann H, Pilatus U (2004) Multiple spin-echo spectroscopic imaging for rapid quantitative assessment of N-acetylaspartate and lactate in acute stroke. Magn Reson Med 52:228-238
Takegami T, Ebisu T, Bito Y, Hirata S, Yamamoto Y, Tanaka C, Naruse S, Mineura K (2001) Mismatch between lactate and the apparent diffusion coefficient of water in progressive focal ischemia. NMR Biomed. 14:5-11
Wise RJ, Rhodes CG, Gibbs JM, Hatazawa J, Palmer T, Frackowiak RS, Jones T (1983) Disturbance of oxidative metabolism of glucose in recent human cerebral infarcts. Ann Neurol 14:627-637
Transient Ischemic Attacks |
183 |
Part 3:
MR Correlates of Stroke Syndromes

Transient Ischemic Attacks |
185 |
12 Transient Ischemic Attacks
Hakan Ay and Achim Gass
CONTENTS
12.1Clinical Features and the Role of
Imaging in Transient Ischemic Attacks 185
12.2CT and MRI to Identify TIA-Related
Irreversible Brain Injury 186
12.3Conventional MRI Versus DWI in
|
Patients with TIA 187 |
12.4 |
DWI Characteristics of TIA-Related Infarctions 188 |
12.5Differential Diagnosis of Small Lesions on DWI in Patients with Transient Neurological Symptoms 190
as the current clinical criteria used for diagnosis are subjective and lack specificity for an ischemic etiology.
The 24-h time limit, despite lack of any scientific foundation, has been introduced as the key criterion for diagnosis of TIA. The usual duration of symptoms is, in fact, less than 1 h; spells typically last for 5–10 min (Levy 1988). Unavoidably, only a small fraction of patients can be examined by physicians at the height of their signs and symptoms; the neu-
12.6Neuroimaging as a Marker of Subsequent Risk of rological examination is often normal when patients
Stroke Following TIA 190
12.7Transient Ischemic Attacks with
No Infarction on Imaging 191
12.8Summary 191 References 191
12.1
Clinical Features and the Role of Imaging in Transient Ischemic Attacks
Transient ischemic attack (TIA) is a clinical syndrome characterized by focal neurological symptoms presumed to be of vascular origin that last less than 24 h. Despite the transient nature of symptoms, the cerebrovascular thread is not over yet following a TIA. The mechanism that has given rise to the transient spell may also cause more severe ischemic syndromes if not properly treated. About 10% of patients with TIA suffer from stroke within the ensuing 3 months, 50% of which occur within the first 2 days (Johnston et al. 2003). Accurate and prompt recognition of ischemia as the cause of neurological symptoms is imperative to prevent subsequent strokes. This is, however, a complicated task
H. Ay, MD
Department of Neurology, Stroke Service, Massachusetts
General Hospital, Harvard Medical School, CNY149-2301, 13th
Sreet, Boston, MA 02129, USA
A. Gass, MD
Depts. of Neurology/Neuroradiology, University Hospitals
Mannheim and Basle, 68165 Mannheim, Germany; 4031 Basle
Switzerland
are available for medical attention. The diagnosis is usually based on historical information provided by the patient or other observers. This historical information, however, is not always reliable because patients with TIA may suffer from no or inaccurate recollection of their spells, may not fully name their neurological symptoms, or may be even unaware of their spell. The proof of “vascular origin” is often decided by the clinician’s best judgment as to whether the pattern of signs and symptoms fit into a specific arterial territory. Given that TIA-like symptoms also occur due to a variety of neurological disorders such as migraine, seizures, brain tumors (see Table 12.1 for the complete list of TIA mimics), transient neurological symptoms confined to a vascular territory should not be considered as specific for any particular etiology.
The use of arbitrary clinical criteria for TIA leads to a serious diagnostic confusion among physicians; up to 62% of TIA referrals by general practitioners are in fact non-vascular events by neurologists (Martin et al. 1997). Conversely, general practitioners misdiagnose a TIA as non-ischemic transient event in about half of the patients (Ferro et al. 1996). The agreement between two neurologists for the diagnosis of TIA by history varies from 42% to 73% (Tomasello et al. 1982).
Neuroimaging offers a tremendous utility in the evaluation of patients with transient neurological symptoms. In contrast to the long-standing notion that TIAs are associated with rapid and complete resolution of brain ischemia before any permanent

186
Table 12.1. Conditions that may mimic transient ischemic attacks
Subdural hematomaa Intracerebral hemorrhagea Brain tumorsa
Cervical disc diseasea Multiple sclerosisa
Cerebral venous thrombosisa Seizures
Neuropsychiatric syndromes (conversion disorder, panic disorder)
Compression neuropathies Vasovagal syncope
Migraine or migraine accompaniments Labyrinthine disorders
Transient global amnesia Hypoglycemia
Drugs
Electrolyte abnormalities Cardiac arrhythmia
aCentral nervous system pathology identified by MRI
tissue injury occurs, recent imaging data supports the concept that clinically transient events are not necessarily transient at the tissue level and are associated with cerebral infarction in some patients. The goals in imaging patients with transient neurological symptoms are two-fold (Fig. 12.1): (1) To uncover an obvious condition other than ischemia as the cause of the transient event such as brain tumor, subdural hematoma, intracerebral hematoma, etc.
(2) To identify ischemia as the operative mechanism responsible for symptoms in patients with no other
Fig. 12.1. An imaging algorithm for patients with the clinical syndrome of TIA. CT/MR angiography, CTA/MRA
H. Ay and A. Gass
obvious cause. Neuroimaging has proven its value in accomplishing the first goal. Many structural brain lesions listed in Table 12.1 that can mimic TIA are successfully identified with the current imaging technology (Fig. 12.2). The role of imaging in achieving the second goal is equally important. The aim is to capture the “footprints” of a recent, more widespread but reversible ischemia that has occurred transiently at the time of symptom. Given that some TIAs may not leave any footprints while others leave so subtle footprints that can easily escape from detection by the current neuroimaging techniques, one should not expect a very high yield of imaging in the study of TIAs. Nonetheless, the information provided by imaging serves as a crucial piece in clinical decision-making that justifies the use of imaging in patients with TIA. The remaining part of the current chapter will focus on the use of brain imaging in capturing the footprints of transient ischemia.
12.2
CT and MRI to Identify TIA-Related Irreversible Brain Injury
Waxman and Toole (1983) first introduced the concept that the transient wave of ischemia that occurs during a TIA can leave footprints, small islands of permanent injury, on the brain. Their report of a patient with TIA who had an infarction on CT in a location consistent with symptoms has motivated the use of imaging to establish a link between such transient events and the ischemic pathophysiology. The past two decades have seen a number of imaging studies that consistently confirmed the presence of irreversible ischemic brain injury in victims of TIA. The infarction rate in these studies is variable, ranging from 4% to 77% with CT and conventional MRI (T1-, T2-, FLAIR-weighted images) (Awad et al. 1986; Bogousslavsky and Regli 1985; Douglas et al. 2003; Fazekas et al. 1996). A clinically-related infarction in these studies has traditionally been defined as being in the contralateral hemisphere or within a clinically expected arterial territory. This definition, however, remains short of establishing that the infarction and the TIA are in fact causally related in an individual patient. This is due to the fact that neither CT nor conventional MRI can reliably differentiate acute from chronic infarctions in patients with TIA since TIA-related infarctions are often very small. A volumetric analysis of TIArelated infarctions reveals that 96% of all infarc-
Transient Ischemic Attacks |
187 |
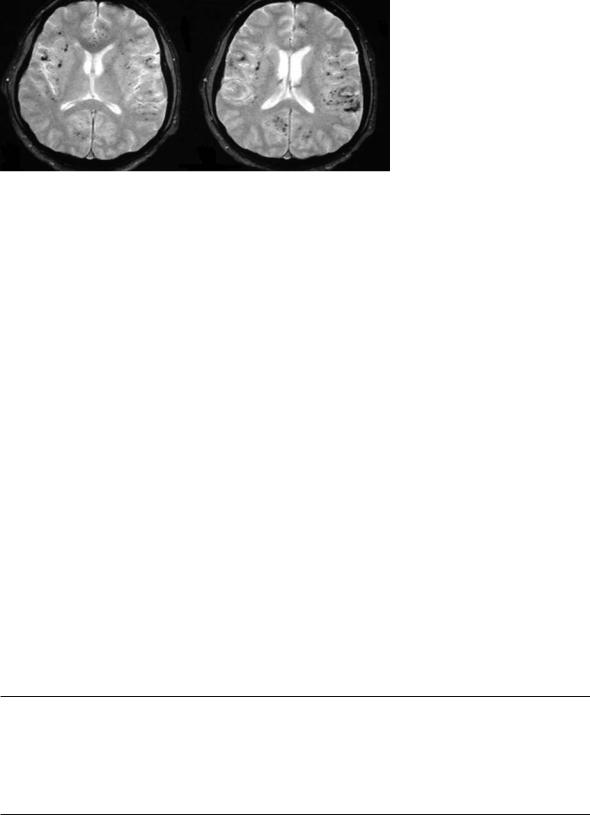
Fig. 12.2. MRI images of a 42 year-old man who presented with three stereotypic tingling spells in the right hand, each lasting for about 5–10 min, mimicking a TIA. Gradient-echo T2-weighted images [520/12.9 (TR/TE); flip angle, 30°], obtained through the level of lateral ventricles, show multiple millimetric hypointense foci of chronic hemorrhages, located in the cortical-subcortical region in both hemispheres. Pathologic examination of the biopsy material later showed severe destruction of leptomeningeal vessels with a mixed inflammatory cell infiltrate, consistent with the diagnosis of “primary angiitis of the CNS”
tions are smaller than 1 ml (Ay et al. 2004). Both acute and chronic infarctions of this size exhibit the same signal changes on CT and conventional MRI, do not demonstrate significant mass effect, and lack contrast enhancement. In addition, about one half of TIA patients harbor chronic multiple small silent infarctions that, in turn, further blurs confidence to call an infarction new and clinically-related to the TIA. As a result, conventional imaging techniques not only have the potential to misidentify a small chronic lesion as acute and clinically-related, but also pose a risk of missing TIA-related infarctions since they are extremely small.
DWI offers greater utility in identifying patients who have had ischemia as the cause of their transient neurological spell. The higher lesion to background contrast enables DWI to capture punctate infarctions (Gass et al. 2004; Gonzalez et al. 1999). Furthermore, DWI provides a unique opportunity to differentiate acute infarction from chronic lesions (Marks et al. 1996; Schlaug et al. 1997). This feature not only allows to age an infarction but also to temporally tie an imaging finding to the clinical transient event. Fueled by these advantages, DWI can identify infarctions related to the clinical symp-
Table 12.2. Studies of DWI in patients with TIA
toms in a subset of patients with TIA. To date, there are seven studies with DWI (Table 12.2) in TIAs that convincingly demonstrate that an acute infarction occurs during transient spells in about 50% of patients (range 21%-67%) (Ay et al. 2002; Bisschops et al. 2002; Crisostomo et al. 2003; Engelter et al. 1999; Kidwell et al. 1999; Rovira et al. 2002; Takayama et al. 2000).
12.3
Conventional MRI Versus DWI in Patients with TIA
The major drawback of conventional MRI in the study of patients with TIA is its limited sensitivity to detect as well as to age small infarctions. By comparing to DWI, it is possible to estimate the amount of error that could be imposed by the use of conventional MRI in patients with TIA. In a recent study (Ay et al. 2002), the examiners first reviewed T2-weighted images (T2w) with clinical information in hand and determined infarction(s) in the contra-lateral hemisphere to the symptoms or in the
Reference |
Patient |
Number (%) with acute |
Number (%) with multiple |
Mean time from symptom |
|
number |
infarction on DWI |
acute infarctions on DWI |
onset to MRI |
Ay et al. (2002) |
57 |
27 (47%) |
11 (19%) |
39 h |
Bisschops et al. (2002) |
44 |
21 (47%) |
Not mentioned |
< 72 h |
Crisostomo et al. (2003)a |
78 |
16 (21%) |
Not mentioned |
23 h |
Engelter et al. (1999) |
40 |
14 (35%) |
5 (13%) |
36.5 h |
Kidwell et al. (1999) |
42 |
20 (48%) |
Not mentioned |
17 h |
Rovira et al. (2002) |
58 |
39 (67%) |
Not mentioned |
5 days |
Takayama et al. (2000) |
19 |
7 (37%) |
Not mentioned |
Not mentioned |
aThis study underestimates the rate of infarction since some patients with infarction on DWI were called stroke and not included
188 |
H. Ay and A. Gass |
arterial territory indicated by the symptoms (clinically appropriate lesion). The same procedure was repeated for FLAIR images in a blinded fashion with regard to DWI. Finally, diffusion-weighted images were rated in conjunction with T2w and FLAIR. T2w missed the acute infarction on DWI in 42% and misidentified in 27% of the patients. Similarly, FLAIR images missed the acute infarction in 5% and misidentified in 32% of patients. Overall, conventional MRI misses or misidentifies the acute infarction on DWI in about one half of the patients with TIA. DWI should be the technique of choice for use in the evaluation of patients with TIA.
12.4
DWI Characteristics of TIA-Related Infarctions
1.TIA-related infarctions on DWI are often very small (Ay et al. 2002; Kidwell et al. 1999; Rovira et al. 2002). As mentioned before, 96% of infarctions on DWI are smaller than 1 ml in volume. The mean infarction load (total volume of all
acute infarctions if there are multiple) on DWI has been reported to be 1.5±1.8 ml (Ay et al. 2005). An infarction load of less than 1.8 ml is associated with reversible clinical deficit within 24 h with 79% sensitivity and 78% specificity. Two other DWI studies have produced similar results. Ay et al. (2002) found that the infarction size was less than 15 mm in diameter in 85% of 27 TIA patients with infarction identified by DWI, of which 83% were punctate (< 5 mm). Rovira et al. (2002) estimated TIA-related infarctions range from 2 to 40 mm in diameter (mean, 15 mm). Figures 12.3 and 12.4 present examples of small hyperintense lesions on DWI that represent the remnants or “footprints” of a recent ischemia.
2.TIA-related infarctions do not occur, a priori, in silent parts of the brain. Acute infarctions in patients with TIA are distributed across a wide range of brain regions including brainstem, internal capsule, subcortical gray matter, cortex, and subcortical white matter (Ay et al. 2002; Kidwell et al. 1999). The volume of infarction, however, is not constant throughout the brain; it varies with respect to location. The volume that is associated with TIA is smallest for deep-brainstem penetrator infarctions, larger for isolated cortical infarctions, and the largest for those located in relatively silent brain regions (Ay et al. 2005).
3.TIA-related infarctions can be multiple. Estimates of multiple infarctions range from 13% to 19% of all TIAs (Ay et al. 2002, 2005; Engelter et al. 1999). DWI’s ability to recognize the “plurality”, and importantly, the bilaterality of small acute infarctions that are temporally related to each other and the symptoms, is important because multiple acute lesions on DWI are associated with an identifiable, and potentially modifiable stroke etiology in about 90% of the patients (Ay et al. 2002). In contrast, only about one third of TIA patients with normal DWI exhibit an identifiable stroke etiology. The presence of multiple small acute lesions within both hemispheres or both anterior and posterior circulation indicates a proximal source of embolism as the operative mechanism (such as cardiac or aortic embolism). A string of punctate DWI lesions in the internal watershed territories is often associated with low-flow state that results from severe stenosis or occlusion of proximal large arteries. Identification of multiple small infarctions on DWI serves as a powerful guide to institute the most appropriate algorithms for etiologic investigations as well as to determine the best means of preventive stroke care.
4.DWI lesions in patients with TIA represent permanent ischemic brain injury. Although it is possible that DWI changes can fully reverse with rapid reconstitution of the cerebral blood flow (usually within 6 h of symptom onset), either by means of early spontaneous reperfusion or pharmacological thrombolysis (Kidwell et al. 1999, 2000; Lo et al. 1994), it is often too late for such a reversal in patients with TIA; the mean time from symptom onset to MRI ranges from 17 h to 5 days in the DWI studies listed in Table 12.2, once again emphasizing that a timely evaluation in patients with TIA (during or soon after symptoms) is not quite possible due to delays in seeking medical attention.
5.The occurrence of infarction on DWI cannot be reliably predicted on the basis of symptom duration (Ay et al. 2005). Although, there are reports that suggest the presence of a relationship between symptom duration and probability of infarction on DWI, the association is not absolute (Crisostomo et al. 2003; Engelter et al. 1999; Kidwell et al. 1999; Rovira et al. 2002); a transient ischemia associated with symptoms lasting for as short as a few minutes can be associated with infarction whereas a spell lasting for as long as 20 h may not cause any signal changes on DWI. This is, in part, due to the fact that in addition to duration, sever-

Transient Ischemic Attacks |
189 |
|
|
Fig. 12.3a-c. A 57-year-old man with right arm |
|
|
|
and leg weakness and right homonymous field |
|
a |
|
defect for about 20 min. Diffusion weighted |
|
|
images (a) obtained 21 h after symptom onset |
||
|
|
||
|
|
demonstrate small acute infarctions in the |
|
|
|
left parieto-occipital region, the left parietal |
|
|
|
lobe, and the left frontal lobe (arrows). MR |
|
|
|
angiographic images through the neck (b) |
|
|
|
demonstrate signal loss in the left internal |
|
|
|
carotid artery at the skull base (arrow). This |
|
|
|
is associated with eccentric hyperintensity on |
|
|
|
T1-weighted images (not shown) consistent |
|
|
|
with a dissection. 3D time-of-flight imaging |
|
|
|
(c) demonstrates that there is compromise of |
|
|
|
the flow-related enhancement in the intracra- |
|
|
|
nial internal carotid artery as well as the left |
|
|
|
MCA branches (arrow). Further questioning |
|
|
|
revealed that the patient had been hit on the |
|
b |
c |
head by the bicycle rack of his car in the morn- |
|
ing of admission |
|||
|
|
a |
b |
|
|
|
Fig. 12.4a-d. A 76-year-old man who presented |
|
|
with a transient episode of left lower extremity |
|
|
weakness lasting for 1 min. Diffusion weighted |
|
|
images (a) obtained 24 h after symptoms show |
|
|
several punctate foci of DWI bright areas in |
|
|
bilateral MCA territories (arrows). The volume |
|
|
of these small lesions ranges from 0.07 to 0.7 ml. |
|
|
These foci are difficult to distinguish on the |
|
|
ADC maps (b). Axial FLAIR images (c) dem- |
|
|
onstrate subtle hyperintensity in the regions |
|
|
hyperintense on DWI whereas only the lesion |
|
|
(arrow) not neighboring the cortical sulci is |
|
|
subtly distinguishable on T2-weighted images |
|
|
(d). Multiple embolism has been judged to be |
c |
d |
the mechanism as the patient had atrial fibril- |
lation and was not on warfarin |