

Книги по МРТ КТ на английском языке / Magnetic Resonance Imaging in Ischemic Stroke - K Sartor R 252 diger von Kummer Tobias Back
.pdfDisturbed Proton Diffusion |
117 |
7Disturbed Proton Diffusion
Tobias Neumann-Haefelin
CONTENTS
7.1 |
Molecular Basis of Disturbed Proton Diffusion 117 |
7.1.1 |
Basics of Diffusion 117 |
7.1.2Molecular Pathophysiology of Restricted Diffusion
During Cerebral Ischemia 118
7.1.3Relationship Between Restricted Diffusion
|
and Cerebral Blood Flow 119 |
7.2 |
Imaging of Diffusion 120 |
7.2.1Diffusion-weighted Imaging 120
7.2.2 Diffusion Tensor Imaging 122
7.3Diffusion-weighted Imaging (DWI) –
Pathophysiological and Clinical Aspects 122
7.3.1Time Course of Diffusion Changes
in Acute Stroke 122
7.3.2 Enlargement of DWI Lesions 125
7.3.3Potential Reversibility of Diffusion Abnormalities 126
7.3.4ADC as a Predictor of Infarction? 126
7.3.5DWI as Part of Integrated MR Examinations
|
in Acute Stroke 127 |
7.3.6 |
DWI Negative Stroke 127 |
|
References 128 |
7.1
Molecular Basis of Disturbed Proton Diffusion
7.1.1
Basics of Diffusion
Diffusion is a physical process that involves the random motion of molecules as they collide with other molecules (Brownian motion) and, on a macroscopic scale, move from one part of a system to another. The average distance that molecules move per unit time is described by a physical constant called the diffusion coefficient, D (in units of mm2/s). In pure water, molecules diffuse at a rate of approximately 3×10⁻³ mm2 s-1 at 37°C. The factors influencing diffusion in a solution (or self-diffusion in a pure liquid) are molecular weight, intermolecular
T. Neumann-Haefelin, MD
Department of Neurology, Goethe University of Frankfurt,
Schleusenweg 2–16, 60528 Frankfurt/Main, Germany
interactions (viscosity), and temperature (Beaulieu 2002; le Bihan 2003; Moseley and Butts 1999). For comparison, at 20°C the diffusion coefficient of water is approximately 2×10⁻³ mm2 s-1.
In MRI, water protons are of principal interest due to their abundance and dominant contribution to the MR signal. The remainder of this chapter will focus on physiological and pathophysiological aspects of water proton diffusion, although it should be mentioned that proton diffusion of other metabolites has also been investigated with MR spectroscopy (Nicolay et al. 2001).
In the brain, diffusion of water molecules is substantially slower than in pure water. This is in part due to cellular membranes and fiber tracts hindering the free movement of water molecules. In addition, even in the extracellular space where diffusion is less restricted than intracellularly, there exists a matrix consisting of “sticky” macromolecules such as proteoglycans and glycosaminoglycans leading to slower diffusion than in pure liquids. Therefore, it is the apparent diffusion coefficient (ADC) that is measured in biological tissue and not the physical diffusion coefficient as measured in pure liquids. The ADC in normal brain (as measured with MRI) varies between 0.67 and 0.83×10⁻³ mm2 s-1 in gray matter and 0.64 and 0.71×10⁻³ mm2 s-1 in white matter (Fiehler et al. 2002a). During diffusion times of about 50–100 ms, as they are used in diffusion imaging with MRI, water molecules move in the brain on average over distances around 10–15 µm, bouncing into, crossing or interacting with many tissue components (le Bihan and van Zijl 2002).
If there is a systematic (i.e., highly ordered) tissue substructure such as in white matter, diffusion is usually more restricted in one than in another direction, i.e., the molecular mobility of water is not the same in all directions. In white matter, diffusion is less restricted parallel to than perpendicular to fiber tracts. If diffusion is different along various directions, then it is termed anisotropic diffusion. In stroke imaging the avoidance of the confounding effects of anisotropy is a common goal. However,
118 |
T. Neumann-Haefelin |
diffusion anisotropy can also be exploited (with diffusion tensor imaging) to map out the orientation of white matter tracts, assuming that the direction of the fastest diffusion indicates the overall orientation of the fibers (le Bihan and van Zijl 2002).
The molecular basis of diffusion anisotropy in white matter is still only partially understood, although numerous studies have provided a better understanding of the relationship between diffusion and the underlying microstructural components (for review see Beaulieu 2002). Anisotropic diffusion is clearly related to the ordered arrangement of myelinated fibers in nerve and white matter. However, the relative contributions of various structural components of white matter are not known in detail. Experimental work indicates that axonal membranes are critical structures determining the degree of anisotropy. Myelination can modulate the degree of anisotropy, but is not necessary for significant anisotropy. Other structural or physiological components such as neurofilaments and microtubules as well as fast axonal transport are probably not critical for diffusion anisotropy (Beaulieu 2002).
7.1.2
Molecular Pathophysiology of Restricted Diffusion During Cerebral Ischemia
During cerebral ischemia, water proton mobility declines rapidly, which may be measured with dif- fusion-weighted imaging (DWI) or other methods (Nicholson and Sykova 1998). In animal models of focal ischemia, the ADC declines by about 30%– 50% starting within a few minutes following onset
of ischemia, the exact time course depending on the severity of ischemia. In global ischemia models (in particular cardiac arrest models), where the degree of ischemia can be controlled better than in focal ischemia models, a pronounced drop of the ADC occurs at 1–2 min following complete circulatory arrest and occurs at the time of anoxic depolarization, which in turn is the result of energy failure. The rapid and pronounced drop of the ADC is preceded by an earlier, more modest ADC decline (of only ~ 5%), which occurs almost immediately and may reflect intracellular water shifts from a gradual predepolarization leakage of sodium ions or a gradual build up of intracellular lactate, resulting from anaerobic metabolism (de Crespigny et al. 1999, 2001). The time course of diffusion changes during ischemia is probably very similar in humans, although data on the initial phase of stroke are limited. In humans, diffusion changes have been found as early as ~ 39 min following stroke onset (Neumann-Haefelin et al. 2000b).
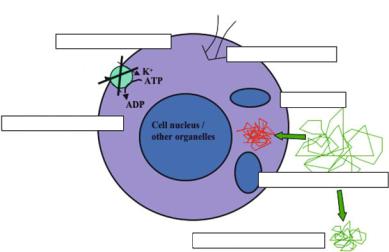
Pathophysiologically, the pronounced ADC decline during ischemia occurs at the same time as anoxic depolarization. Anoxic depolarization is the consequence of energy failure with secondary failure of ion pumps (in particular Na+/K+-ATPase), which are necessary to maintain ion gradients over cell membranes. The resulting influx of Na+-ions is accompanied by a water shift from the extrato the intracellular space (cytotoxic edema) without a net uptake of water (Fig. 7.1).
While this association between the ischemiaassociated ADC decline and energy failure/anoxic depolarization is undisputed, it is still a matter of debate what exactly leads to the restriction in water proton diffusion. As already mentioned above, water
Na+
2. Failure of Na+/K+ ion pumps
3. Intrac. Na+ accumulation
Na+
4. Water influx
H2O
1. Energy failure: ATP depletion
5. Cell swelling (Cytotoxic edema)
6. Shrinkage of extracellular space
Fig. 7.1. Pathophysiology of abnormal diffusion in cerebral ischemia. Cascade of metabolic changes leading to a decrease in diffusion of water protons in cerebral ischemia. The main steps leading to significant diffusion reductions are shown, while modest changes may also be found with incomplete energy failure. [Reproduced with permission from Neumann-Haefelin and Moseley (2003)]
Disturbed Proton Diffusion |
119 |
diffusion in the extracellular space (ECS) is faster than in the intracellular space (ICS). Thus, the shift of water from the fast-diffusing ECS compartment to the slow-diffusing ICS could be responsible for the net decrease of the ADC (Benveniste et al. 1992; Moseley et al. 1990a; van der Toorn et al. 1996a,b; van Gelderen et al. 1994). This initial hypothesis has been the most popular one in the past. Alternatively, assuming that water diffusion in the ECS dominates the ADC signal, the changes of the ECS could theoretically explain the ADC decrease during ischemia. The ECS shrinks by about 50% during the early phase of ischemia (from 20% to 10% of a given volume) and is associated with a parallel ICS increase from 80% to 90%. This ECS shrinkage leads to an increase in tortuosity, which could potentially explain part of the ADC decrease during ischemia (Latour et al. 1994; Sykova et al. 1994). Recent studies, however, using methods that allow separate determination of extraand intracellular ADC, indicate that the ICS contribution to the ADC dominates the DWI signal, both under normal conditions and during ischemia, while the decrease of extracellular ADC from ~ 1.6 mm2 s-1 to 1.3 mm2 s-1 cannot (fully) explain the global ADC decrease during ischemia (Duong et al. 1998; Silva et al. 2002).
On a cellular level, there is evidence that the ICS contribution to the ADC is in part an active process including energy-dependent “cytoplasmic streaming” (Wheatley 1985), i.e., – from a cellular point of view – a purposeful movement of cytoplasm within the cell rather than passive diffusion. Hypothetically, energy failure during ischemia may result in a sudden termination of this process abruptly stopping active intracellular water movements. The relative contribution of the various processes to the ADC decline during ischemia will need further investigation; fortunately, although interesting from an academic point of view, the exact mechanisms underlying disturbed diffusion at the cellular level are of only limited relevance for the clinical interpretation of diffusion changes, which may be safely viewed as an indicator of severe tissue compromise during ischemia.
Disturbances of proton diffusion are not unique to cerebral ischemia. Reduced diffusion has also been found in various experimental conditions including spreading depression (Busch et al. 1995) and periinfarct depolarizations (Gyngell et al. 1994; Rother et al. 1996), hypoglycemia (Hasegawa et al. 1996), following cortical application of noxious substances [blockers of the Na+-/K+-ATPase (Benveniste et al. 1992), excitotoxins (Verheul et al. 1994)] and
after electrical cortical stimulation (Prichard et al. 1995). In humans, reduced diffusion has been reported in patients with seizures by several groups, mostly in status epilepticus (Lansberg et al. 1999). In addition, visual stimulation as typically used in fMRI experiments was shown to lead to minimal ADC reductions (Darquie et al. 2001; Flacke et al. 2000). The common feature of these non-ischemic states is that they are associated with relative energy failure and disturbances of cellular ion homeostasis leading to (at least some degree of) cell swelling.
7.1.3
Relationship Between Restricted Diffusion and Cerebral Blood Flow
The relationship between ADC change and regional cerebral blood flow (rCBF) has been studied in detail (for review see Hossmann and Hoehn-Berlage
1995). In experimental studies low ADC (~ < 80% of normal) was found in areas with severely reduced rCBF and depletion of high energy phosphates (i.e., ATP) (Hoehn-Berlage et al. 1995). Moderately reduced ADC (~ 90% of normal) was found in areas with less severe rCBF reduction and tissue acidosis (mainly due to lactate accumulation). Different perfusion thresholds for ADC changes have been reported, ranging between 15 to 20 ml/100g/min in gerbils (Busza et al. 1992) and 34–41 ml/100 g/min in rats (Kohno et al. 1995). Partially, this difference may be due to species differences, but may also reflect differences in defining thresholds for ADC change. In addition, the perfusion threshold for ADC changes has been shown to increase as a function of time.
Recent studies in humans have largely confirmed the (non-linear) relationship between ADC and rCBF found in experimental studies. After a gradual decline (with the ADC not falling below 90% of normal), an abrupt drop occurs below an rCBF threshold of 15–24 ml/100 g × min, depending on the time after symptom onset (Fig. 7.2) (Lin et al. 2003). However, these rCBF threshold values are based on perfusion measurements with MRI and the reliability of absolute perfusion measurements with MR perfusion imaging (PI) is still debated (Calamante et al. 2002). Assuming the thresholds are correct, ADC may drop below 90% when rCBF is still in the penumbral range (~12–22 ml/100 g /min). This is in line with a back-to-back MRI and positron emission tomography (PET) studies (Guadagno et al. 2004) showing that some areas with reduced dif-
120 |
T. Neumann-Haefelin |
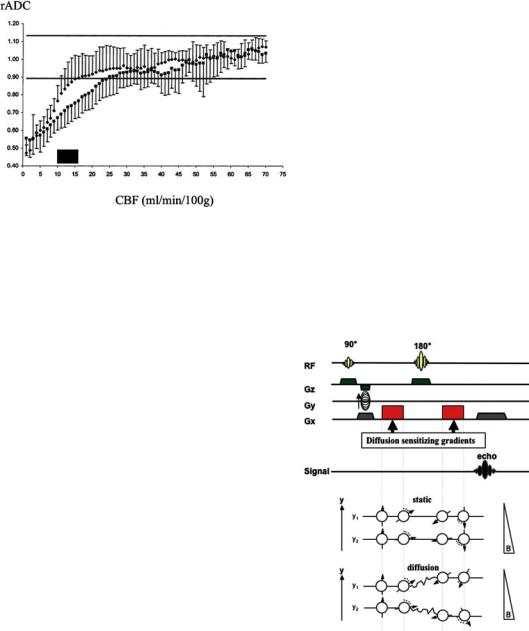
Fig. 7.2. Relationship between relative (rADC) and cerebral blood flow (CBF). ADC drops to below normal at CBF values around 15–24 ml/min/100 g, as shown in a pixel-wise comparison between diffusion and perfusion imaging in acute stroke patients. A lower threshold (15 ml/min/100 g) was found for patients imaged earlier (up to 4 h; ) compared to the value (24 ml/min/100 g) of those patients imaged between 4.5 and 6.5 h ( ). The data show that the ADC threshold increases with time. [Reproduced with permission from Lin et al. (2003)]
fusion may have increased oxygen extraction fraction (OEF), which is a clear indicator of tissue viability and a characteristic finding of the penumbra. Together with the studies correlating CBF measurements with DWI, these findings conclusively show that reduced diffusion does not necessarily mean irreversible tissue damage.
7.2
Imaging of Diffusion
7.2.1
Diffusion-weighted Imaging
Historically, the first diffusion-weighted NMR pulse sequences were described as early as 1965 by Stejskal and Tanner, long before MR imaging was introduced. The theoretical foundations of DWI and the introduction as a clinical imaging technique were laid out in the mid-1980s (for review see le Bihan 1995), by combining MRI pulse sequences with methods that had been previously developed to encode molecular diffusion effects through the use of pairs of magnetic field gradient pulses. In 1990, Moseley and coworkers first demonstrated in two land-mark articles (Moseley et al. 1990a,b) that DWI could detect regional ischemia (in cats) earlier than conventional MRI techniques. In subsequent years, Warach and coworkers ( 1992, 1995, 1996a),
as well as others (Marks et al. 1996; Sorensen et al. 1996), demonstrated successful application of DWI to human stroke patients. Particularly the development of ultra-fast imaging techniques (such as echo-planar imaging, EPI) and improvements in MR hardand software have now lead to a situation where DWI is a very fast and robust technique that is easily applicable in the acute stroke situation [for general reviews on DWI in acute stroke see Baird and Warach (1998); Beauchamp et al. (1999) Neumann-Haefelin et al. (2000b)].
The vast majority of DWI studies are still performed by adding “Stejskal Tanner” pulse gradients to a spin-echo imaging sequence (Fig. 7.3). These extra gradient pulses are located symmetrically before and after the 180° refocusing pulse of a spinecho sequence. The first gradient pulse causes molecules to acquire phase shifts, while the second gradient pulse will cancel the phase shifts by rephasing the (stationary) spins. In the case of moving spins, signal
a
b
Fig. 7.3a,b. Diffusion-weighted imaging. a A typical pulse sequence is shown with two strong diffusion-sensitizing gradients arranged symmetrically around the 180° radio-fre- quency pulse. The first of the two diffusion-sensitizing gradients leads to dephasing of water protons, while the second gradient leads to an exact rephasing, provided the water protons do not move between the gradients. If the water protons change their location between the two gradients, as in diffusion, the second gradient will lead to incorrect rephasing (b). Therefore, the spins will not perfectly realign after the second gradient, which results in a smaller signal. Conversely, if diffusion is restricted, the spins will rephase more accurately, leading to a stronger signal on the diffusion weighted images. [Reproduced with permission from Neumann-Haefelin and
Moseley (2003)]
Disturbed Proton Diffusion |
121 |
amplitude is attenuated by the incomplete rephasing during gradient 2 of the dephasing induced by gradient 1. For thorough recent reviews on technical aspects of DWI see Bammer et al. (2003); Huisman (2003); Roberts and Rowley (2003).
The degree of diffusion weighting can be quantified by a parameter known as the b-value and is influenced by characteristics of the diffusion gradients including their strength (G), duration (G) and the interval between the two gradients (∆). The relationship between signal intensity (SI) on DWI and the b-value is characterized by the following equation:
SI = SI0 × e-bD, with |
(7.1) |
b = γ 2δ2G2(∆–1/3δ) |
(7.2) |
where SI0 is the signal intensity on the T2-weighted image without diffusion weighting, D the diffusion coefficient and γ is the gyromagnetic ratio. As can be seen from Eq. 7.1, SI in DWI is equal to the signal intensity on a T2-weighted image (or b = 0 image) decreased by an amount of signal drop related to the diffusion coefficient and the applied b-value. In clinical practice, DWI is typically performed with a b-value of around 1000 s/mm2.
To calculate ADC maps (by solving Eq. 7.1 for D), at least one corresponding set of images is required with a low b-value (near to 0) to determine SI0. Clinically, ADC maps are useful to absolutely quantify the severity of diffusion abnormalities. In addition, they are used to rule out that high signal on DWI images is due to “T2 shine-through”. This phenomenon is due to the residual T2 contrast in DWI images, as the sequence rests on a T2-weighted sequence. Thus, if there is a strong signal on T2-weighted images, the signal drop induced by normal (or even supranormal) diffusion in DWI may not suffice to reduce the DWI signal to levels lower than normal.
On modern scanners diffusion gradient pulses can be applied in (at least) three orthogonal sam-
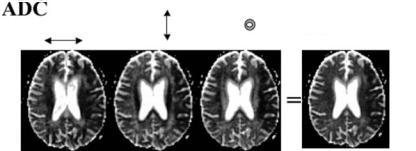
pling directions (x, y, z), resulting in images selectively sensitized to diffusion along these directions. In acute stroke, DWI is often performed with dif- fusion-sensitizing gradients applied in all three orthogonal directions, followed by averaging of the resulting images to suppress effects due to anisotropy (Fig. 7.4). The average images are commonly termed “trace” images, although – in a strict sense
– the “trace” is a measure derived from diffusion tensor imaging characterizing the average diffusivity after removal of effects due to anisotropy and fiber orientation. The use of “trace” images is particularly useful in small subcortical lacunar stroke close to fiber tracts, since these lesions may otherwise be obscured by high signal due to anisotropic diffusion.
Another method to optimize image contrast includes the addition of an inversion recovery pulse before the typical SE sequence to suppress signal from cerebrospinal fluid (CSF). This yields socalled fluid-attenuated inversion recovery (FLAIR)- or CSF-suppressed DWI images or ADC maps. With this approach, the partial-volume effect of cerebrospinal fluid can be substantially reduced, which is particularly relevant in cortical regions due to the frequent CSF contribution to individual voxels (Latour and Warach 2002). The technique may enhance lesion conspicuity in the vicinity of CSF and has been shown to be of value in research studies utilizing pixel-wise analyses to predict tissue fate. The technique is not yet implemented in many centers, although this may change in the near future.
DWI based on SE-sequences can be combined with different read-out strategies, but single-shot echo planar imaging (EPI) is by far the most widely used method clinically. With this ultra-fast imaging approach, in which the entire k-space is filled with a single read-out train, images can be acquired in fractions of a second. A DWI study covering the whole brain (~ 20 slices) with diffusion sensitizing gradients applied in three directions and two b-values will typically take less than 1 min. Earlier
ADC X |
Y |
Z |
Trace ADC |
|
Fig. 7.4. “Trace”ADC maps. Averaging of ADC maps obtained with diffusion gradients applied in the three orthogonal directions in space (x, y, z) yields “trace” ADC maps with relative suppression of anisotropic diffusion. (Courtesy of Prof. M. E. Moseley, Stanford University)
122 |
T. Neumann-Haefelin |
problems with motion artifacts are no longer a relevant issue.
However, EPI is susceptible to off-resonance effects, such as main field inhomogeneity, local susceptibility gradients, and chemical shift, which all may lead to severe image degradation (Bammer 2003). Image distortions due to susceptibility artifacts affect particularly brain regions near air cavities, such as around the posterior fossa and the skull base. Several strategies have been developed to overcome this problem, including parallel imaging using techniques such as SENSE as well as optimized ways of sampling k-space such as PROPELLER and spiral imaging. A detailed discussion of these imaging methods has been published (Bammer 2003).
7.2.2
Diffusion Tensor Imaging
Diffusion tensor imaging (DTI) is a “sophisticated” form of diffusion imaging that is not yet routinely used in clinical stroke. However, it is becoming increasingly popular as a research tool (Sotak 2002), particularly in small lacunar stroke (Gillard et al. 2001; Lie et al. 2004) and in patients with ischemic leukoaraiosis (O’Sullivan et al. 2001, 2004), and will, thus, be shortly described here.
In DTI, diffusion is no longer described by a single diffusion coefficient, but by an array of nine coefficients that fully characterize how diffusion in space varies according to direction (Basser 1995). With this approach, diffusion anisotropy can be exploited to provide details on tissue microstructure and fiber tracts (le Bihan 2003). To obtain sufficient information on the direction of diffusion, the full diffusion tensor needs to be sampled [for a review on theoretical foundations of DTI see Basser and Jones (2002)].
The tensor has three degrees of freedom and is represented by a 3×3 symmetric matrix (Dxx, Dxy, Dxz, Dyx, Dyy, Dyz, Dzx, Dzy, Dzz) (see Fig. 7.5a). To obtain the full diffusion tensor, diffusion measurements in all of these directions are required (minus those that are mathematically the same, i.e. Dxy=Dyx); therefore, the diffusion gradients need to be applied in at least six different non-collin- ear directions (at high b-values) to sample the full tensor data plus an additional image that needs to be sampled at a low b-value.
As it is difficult to display tensor data, the concept of “diffusion ellipsoids” has been proposed (le Bihan 2003). An ellipsoid is a three-dimensional
representation of the diffusion distance covered in space by molecules in a given diffusion time. This ellipsoid may also be viewed as a three-dimensional vector. The form of the ellipsoid may vary in tissue: isotropic diffusion is best represented by a sphere, while anisotropic diffusion may result in cigaror pancake-shaped ellipsoids.
DTI data contains specific information not only on the magnitude of diffusion, but also on the relative contribution of anisotropic vs. isotropic diffusion, as well as on the direction of diffusion. Each of these features of DTI data can be analyzed and displayed separately. First, the magnitude of overall diffusion within individual voxels may be displayed by maps showing the “mean diffusivity”. Secondly, the relative contributions of isotropic and anisotropic diffusion can be calculated and depicted in maps displaying various mathematically different, but qualitatively similar anisotropy indices, such as the fractional anisotropy (FA), relative anisotropy (RA) and volume ratios (VR) (see Fig. 7.5a); for information on the mathematical derivation of these indices from the diffusion tensor refer to le Bihan et al. (2001). As may be expected, higher anisotropy indices are found in white matter, particularly in fiber tracts. Finally, the spatial direction of anisotropic diffusion can be color-coded on eigenvector-maps, with different colors assigned to the three main orthogonal directions in space (typically: red for predominant left-right, green for anterior-posterior and blue for superior-inferior directions).
Finally, one of the most interesting extensions of DTI is the potential to track fibers [“in vivo MR tractography” (Bammer et al. 2003; Mori and van Zijl 2002)], by using the information on anisotropic directionality contained in the diffusion tensor. With these mathematically complex methods, it has become possible to track fibers from an initial set of seed points, which can be used to track the pyramidal tract or corpus callosum as shown in Fig. 7.5b.
7.3
Diffusion-weighted Imaging (DWI)
– Pathophysiological and Clinical Aspects
7.3.1
Time Course of Diffusion Changes in Acute Stroke
The time course of diffusion changes in acute cerebral ischemia has been studied in detail (Lansberg

Disturbed Proton Diffusion |
123 |
a
b
Fig. 7.5a,b. Diffusion tensor imaging (DTI). Example of a DTI study in a normal volunteer obtained at 3 Tesla. The tensor matrix with diffusion gradients applied in six directions is displayed on the left. The three images in parentheses (yx, zx, zy) were not acquired separately, as they are the same as those in the right upper part of the matrix (xy, xz, yz). From these images as well as one b0-image (not shown), the full tensor can be calculated. Three common indices of anisotropy, which can be extracted from the tensor, are displayed on the right side of (a). FA, fractional anisotropy; RA, relative anisotropy; VR, volume ratio. In addition, the fiber orientation is displayed on the color maps in the middle with red for predominant left-right, green for ante- rior-posterior and blue for superior-inferior directions (with color intensity based on the FA, RA and VR values, respectively). b An example of fiber tracking is shown with the pyramidal tract depicted in red and the corpus callosum in yellow. (Images acquired by Dr. C. Lienerth, Brain Imaging Center, Frankfurt)
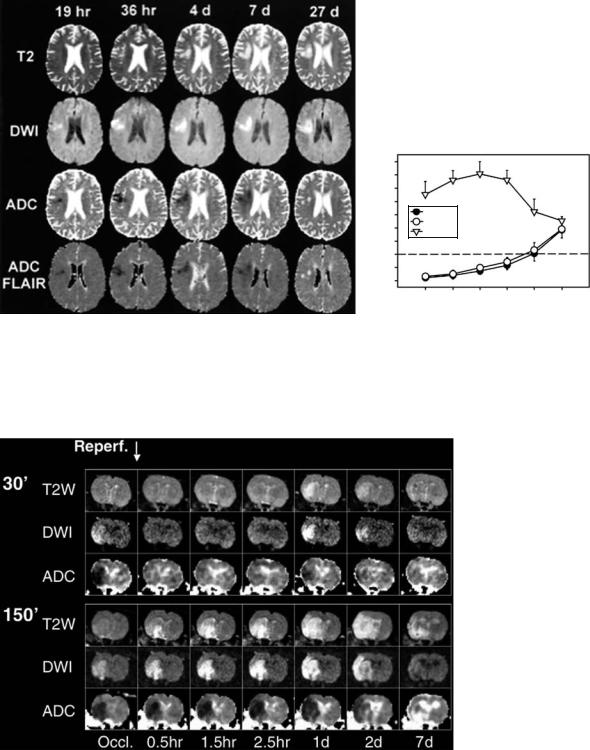
et al. 2001; Schlaug et al. 1997; Warach et al. 1996b). In human stroke, as a rule of thumb, ADC remains low for about 1 week, is pseudonormal for another week and then becomes supranormal (Fig. 7.6). Pseudonormal values may be found starting from day four after symptom onset. On the other hand, although there is substantial interindividual variability, it is relatively safe to assume that lesions are less than 10 days old if the ADC is still low (Lansberg et al. 2001). On DWI images, however, signal intensity may remain increased beyond 10 days due to the T2 contribution to the diffusion
signal. Pathophysiologically, the subacute pseudonormalization of the ADC and subsequent increase to supranormal values is believed to correspond to cell lysis of necrotic neurons and astrocytes, associated with an increase in extracellular space. This increase in ADC is accompanied by a decrease in diffusion anisotropy, particularly in white matter.
A more complex time course of ADC changes is seen in the presence of early reperfusion (see Fig. 7.7). In animal experiments, ADC abnormalities resolve during the early reperfusion phase following ischemia of short duration (e.g., in the rat suture occlu-
124 |
T. Neumann-Haefelin |
rADCconv/rADCFLAIR/rSIDWI
a
2.4
2.2
2.0
1.8
1.6
1.4
1.2
1.0
0.8
0.6
rADCconv rADCFLAIR rSIDWI
1 |
2 |
3–4 |
5–7 |
8–14 |
>14 |
|
|
Days post stroke |
|
b |
|
Fig. 7.6a,b. Evolution of DWI, ADC, and FLAIR-ADC signal changes over time. a Example of T2-weighted images, DWI, ADC and FLAIR-ADC in a single patient imaged at five time points during the first month following symptom onset. The area with increased signal intensity on DWI corresponds to low signal on ADC and FLAIR-ADC maps. Note the pseudonormalization of the ADC at 27 days despite persistently high signal on DWI due to “T2 shine-through”. b The average time course of DWI and ADC changes over time for a group of acute stroke patients. rSIDWI, relative signal intensity on DWI; rADCconv , relative signal intensity on conventional ADC maps; rADCFLAIR , relative signal intensity on FLAIR-ADC maps. [Reproduced with permission from Lansberg et al. (2001)]
Fig. 7.7. Transient ADC recovery and secondary ADC decline. Time course of ADC changes in a rat model of focal cerebral ischemia, as shown in two examples (30-min and 150-min suture occlusion). After 30 min of ischemia both DWI and ADC changes resolve during the early reperfusion period. This is followed by evolution of a secondary DWI abnormality at day 1 following ischemia, which is associated with a lesion seen on T2-weighted imaging. In contrast, no resolution of DWI or ADC changes is observed following 150-min occlusion (see lower part of the image). (The data were acquired in collaboration with A. Kastrup, A. de Crespigny and M.E. Moseley, Stanford University)
Disturbed Proton Diffusion |
125 |
sion model after up to ~ 90 minutes) (Li et al. 1999; Li et al. 2000b; Neumann-Haefelin et al. 2000a). If the duration of ischemia is very short (~ 10 min), the ADC recovers permanently (Li et al. 2000a). With intermediate occlusion times, ADC may recover initially and decrease again slowly during the following 24 h to values similar to those found during ischemia (Olah et al. 2000). This is in striking contrast to permanent ischemia (in rats), where areas of diffusion abnormality reflect precisely the region of histological injury, breakdown of energy metabolism, and tissue acidosis at 7 h indicating completion of infarct evolution (Back et al. 1994). A generally similar time course of ADC changes following reperfusion has also been found in humans treated with intraarterial recanalizing therapies (Kidwell et al. 2000, 2002). In humans, this pattern may be seen with occlusion times of up to several hours, probably due to the somewhat slower evolution of ischemic changes in humans compared to rodents.
The pathophysiology behind the secondary ADC decline following transient ADC recovery is not fully understood. It is intriguing to speculate that the initially ischemic tissue remains salvageable during the phase of transient ADC recovery, since this suggests a longer time window for (e.g., neuroprotective) treatment than commonly assumed. Experimentally, normalization of ATP levels has been found during the recovery period (Olah et al. 2001) as well as resolution of intraischemic lactate accumulation (unpublished own observations). However, although this suggests metabolic tissue recovery, subtle histological abnormalities
are found during the early reperfusion period (Li et al. 2002; Ringer et al. 2001), and ADC recovery is not associated with functional recovery , indicating that there are ongoing tissue changes, which are not detected with current imaging methods. Potential mechanisms underlying the phenomenon include apoptosis, deranged mitochondrial metabolism and failure of protein synthesis.
7.3.2
Enlargement of DWI Lesions
Enlargement of diffusion abnormalities during the acute phase of stroke (Fig. 7.8) occurs in a substantial proportion of stroke patients. In a study by Baird et al. (1997), almost half of the patients showed DWI lesion enlargement. This lesion enlargement occurs more frequently in patients receiving their first DWI image very early during stroke evolution and was found to be particularly prominent in patients with proximal vessel occlusion (Rordorf et al. 1998). DWI lesion enlargement is not restricted to the first few hours, but may occur over several days, although the most prominent increases are found at early time points.
Despite the frequent increase in DWI lesion size, there is consensus that – at any given time point
– areas outside acute diffusion abnormalities, although threatened in the presence of hypoperfusion, are still viable. Thus, the increase in DWI lesion size reflects the evolution of tissue injury during stroke.
a |
|
|
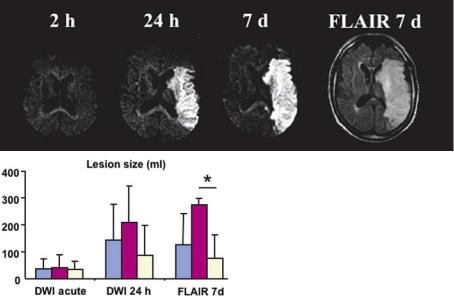
Fig. 7.8a,b. DWI lesion enlargement in patients with M1 occlusion. DWI |
|
lesion enlargement is frequent in patients with proximal vessel occlusion |
|
(M1 occlusion). a A prominent example is shown with dramatic lesion |
|
growth between the acute imaging time point and follow-up. b In addi- |
|
tion to showing the lesion growth for unselected patients with M1 occlu- |
|
sions (symptom onset < 6 h), the profound influence of early recanaliza- |
|
tion is demonstrated (blue, all patients; violet, subgroup with persistent M1 |
|
occlusion; bright yellow, early recanalization within 24 h). (The data were |
|
acquired in collaboration with O.C. Singer, Neurology, Frankfurt, and R. du |
b |
Mesnil de Rochemont, Neuroradiology, Frankfurt) |
126 |
T. Neumann-Haefelin |
DWI lesions expand into surrounding hypoperfused tissue (the DWI/PI mismatch). Lesion expansion is much more frequent in patients with a DWI/PI mismatch than in patients without mismatch. However, predicting the exact degree of lesion expansion is still challenging. Several semiquantitative perfusion parameters have been proposed including measurements of bolus delay (“time-to-peak,” TTP) (Grandin et al. 2002; Neumann-Haefelin et al. 1999) and relative CBF (Grandin et al. 2002), in an attempt to better define the severity of the perfusion deficit and, thus, the risk of infarction in the mismatch region. All studies found an association between the severity of perfusion abnormalities in the mismatch region and the likelihood of lesion expansion, but defining the outer borders of tissue at risk in individual patients is only possible with a substantial degree of uncertainty. Absolute quantification of PI, which would allow defining CBF ranges that are known to correspond to tissue at risk from PET studies, is still difficult (Calamante et al. 2002) due to theoretical problems with bolus delay and dispersion (see Chap. 6), particularly in the presence of proximal vessel occlusion.
In addition, factors other than the severity of the perfusion deficit are known to influence lesion dynamics (Warach 2001). Several studies have now shown that lesion expansion may be arrested by timely reperfusion, either occurring spontaneously or as a consequence of successful intervention (Jansen et al. 1999; Neumann-Haefelin et al. 2004; Schellinger et al. 2001). In addition, there are many other factors influencing lesion growth to a certain extent, such as intrinsic tissue factors (preexisting determinants of susceptibility), induced ischemic tissue tolerance induced by preceding vascular events, age, gender, serum glucose, temperature and blood pressure. Thus, it is not surprising that predicting lesion development is a complex issue.
7.3.3
Potential Reversibility of Diffusion Abnormalities
One of the intensely debated issues during the past few years was the issue of potential DWI lesion reversibility. Initially, it was believed that DWI abnormalities depict irreversibly damaged tissue in humans, i.e., the ischemic core. Only few convincing cases had been reported in the literature with resolution of DWI lesions (mostly small lesions, often located in white matter). There is still no doubt that
disturbed diffusion is a sign of severe ischemia and that DWI lesions are a good predictor of final infarct size. However, it became clear recently that – similar to the situation in animals – DWI abnormalities can also reverse in humans. Following the initial observation of DWI lesion reversal in patients treated by intra-arterial thrombolysis (Kidwell et al. 2000), another study found DWI lesion reversal (defined as shrinkage of the DWI lesion by more than 20%) in roughly 20% of hyperacute stroke patients (< 6 h) (Fiehler et al. 2004). Only patients with early recanalization showed significant regions with ADC normalization. Partial ADC normalization was much more frequent in patients imaged very early (< 3 h) indicating that time is the other important parameter determining potential viability of tissue with disturbed diffusion. Taken together, it may be safe to assume that only few patients will have diffusion abnormalities containing viable tissue (“tissue at risk”) beyond the first 3 h.
7.3.4
ADC as a Predictor of Infarction?
Predicting the fate of diffusion abnormalities (infarction or recovery) during the first few hours following symptom onset based on the severity of the acute ADC decline (or other imaging parameters) is not straightforward. It has been shown, both in experimental and clinical studies, that a relatively greater ADC decrease (compared to contralateral tissue) is associated with a greater risk of infarction (Pillekamp et al. 2001). This confirms the general experience that mild diffusion abnormalities – often located in the lesion periphery – are the first to reverse following reperfusion. However, there is no ADC threshold below which tissue will progress to infarction with certainty (Fiehler et al. 2002b). Even tissue with ADC reductions to 50% of contralateral values can occasionally survive, but this is comparatively rare. On a voxel basis, ADC values combined with CBF values (or other perfusion parameters) may be better at predicting tissue fate (Kidwell et al. 2003). In addition, various more complicated models using combinations of parameters have been proposed, but none of them are in widespread use. Possibly, in addition to current standard methods such as DWI and PI, spectroscopic imaging will be helpful in the future for the evaluation of tissue viability within DWI lesions; a recent study showed clear differences in lactate accumulation within the region of decreased ADC, again indicating that the severity