

Книги по МРТ КТ на английском языке / Magnetic Resonance Imaging in Ischemic Stroke - K Sartor R 252 diger von Kummer Tobias Back
.pdf54 |
T. Back |
of diminished water diffusivity in the extra- and the intracellular space (Szafer et al. 1995). Recently, the contribution of intraand extracellular water ADC could be separated in normal and ischemic brain. In normal brain, the volume-localized ADC was about 10% lower in the intracellular compartment compared to the unseparated condition where both, the intraand extracellular space contribute to the signal (Silva et al. 2002). Interestingly, in ischemic brain, this difference was frankly absent pointing to the notion that the intracellular ADC dominates and determines the overall water ADC under ischemic conditions (by part due to the drastic decrease of the extracellular space). To summarize, current knowledge links tissue diffusion changes to the development of cytotoxic cell swelling as an early hallmark of stroke pathology although the exact mechanisms remain unknown.
Histopathological studies have demonstrated in the rat MCA occlusion model that the ischemic area covered 10% of the hemisphere at 1 h, 22% at 2 h, 38% at 6 h and 50% at 12 h post occlusion (Garcia et al. 1993). It has to be taken into account that during the initial 3–6 h the lesion volume evaluations rather reflect gradual infarct maturation than actual growth as mentioned before. However, the observation of histological lesion enlargement between 6 and 24 h post-occlusion is a consistent finding (Fig. 4.9). The regional distribution of ATP or glucose as measured by bioluminescence techniques is a more reliable marker of ischemic lesions than histopathological changes in the very early stage of infarction. In a permanent MCA occlusion model, areas with grossly
reduced ATP/glucose enlarge significantly during the initial 2 h following MCA occlusion (Kohno et al. 1995b). In this animal study, ATP reduction was present in 22% of the ischemic hemisphere at 30 min and in 50% at 2 h post ischemia (Fig. 4.10). This considerable magnitude of lesion enlargement was also demonstrated for other variables, i.e., areas with solid acidosis (61% at 30 min; 70% at 2 h post occlusion) or regions that exhibit a disturbance of diffusion as measured by DWI (Gyngell et al. 1995; Kohno et al. 1995b) (Table 4.1).
The alterations of ATP content, glucose content, tissue pH or tissue diffusion all were dependent on distinct thresholds of CBF that increase with increasing ischemia times. ADC was reduced if CBF fell short of 0.34 ml/g/min (30-min ischemia) or 0.41 ml/g/min (2-h ischemia), respectively (Kohno et al. 1995b). This relationship was recently confirmed by a study in stroke patients using simultaneous measurements of ADC and quantitative perfusion maps (Lin et al. 2003). The authors showed that in patients who were examined 2-4 h after stroke onset, ADC values dropped abruptly if CBF was lower than 0.15 ml/g/ min. In a patient group imaged 4.5-6.5 h after symptom onset, the corresponding CBF threshold had increased to 0.24 ml/g/min (Lin et al. 2003). For a rough comparison between man and rat studies (as mentioned before), one has to double the human CBF values in order to meet comparable absolute values in small animal species. We recognize that there is a fair correspondence of CBF thresholds for altering diffusion in animals (35%-50% of control CBF) and man (30%-50% of control CBF). Decreased water diffusion
Permanent MCA occlusion/embolism
Area of lesion (Unit: mm square)
40.0
30.0
20.0
10.0
0.0
|
|
|
|
|
Histology (H & E) |
|
|
|
|
|
|
|
|
|
|
|
DW Imaging |
|
|
|||||
|
|
|
|
|
|
|
|
|
|
|
|
|
|
|
|
|
|
|
|
|
|
|
|
|
|
|
|
|
|
|
|
|
|
|
|
|
|
|
|
|
250 |
|
|
|
|
|
|
|
|
|
|
|
|
|
|
|
|
|
|
|
|
|
|
volume |
|
|
|
|
|
|||||
|
|
|
|
|
|
|
|
|
|
|
|
|
|
|
225 |
|
|
|
|
|
|
|
|
|
|
|
|
|
|
|
|
|
|
|
|
|
|
|
|
|
|
|
|
|
|
|
|
|
|
|
|
|
|
|
|
|
|
|
|
|
|
|
|
|
|
200 |
|
|
|
|
|
|
|
|
|
|
|
|
|
|
|
|
|
|
|
|
|
|
lesion |
|
175 |
|
|
|
|
|
|
|
|
|
|
|
|
|
|
|
|
|
|
|
|
|
|
|
150 |
|
|
|
|
|
|
|
|
|
|
|
|
|
|
|
|
|
|
|
|
|
|
|
inital |
|
|
|
|
|
|
|
|
|
|
|
|
|
|
|
|
|
|
|
|
|
|
|
|
|
125 |
|
|
|
|
|
|
|
|
|
|
|
|
|
|
|
|
|
|
|
|
|
|
|
|
|
|
|
|
|
|
|
|
|
|
|
|
|
|
|
|
|
|
|
|
|
|
|
|
of |
|
100 |
|
|
|
|
|
|
|
|
|
|
|
|
|
|
|
|
|
|
|
|
|
|
|
75 |
|
|
|
|
|
|
|
|
|
|
|
|
|
|
|
|
|
|
|
|
|
|
|
Percent |
|
|
|
|
|
|
|
|
|
|
|
|
|
|
|
|
|
|
|
|
|
|
|
|
|
50 |
|
|
|
|
|
|
|
|
|
|
|
|
|
|
|
|
|
|
|
|
|
|
|
|
|
|
|
|
|
|
|
|
|
|
|
|
|
|
|
|
|
|
|
|
|
|
|
|
|
|
25 |
|
|
|
|
|
|
|
|
|
|
|
|
|
|
|
|
|
|
|
|
|
|
|
|
0 |
|
|
|
|
|
|
|
|
|
|
|
|
|
|
|
|
|
|
|
|
|
|
|
|
|
|
0.5h |
2h |
3h |
5h |
8h |
||
|
0.5 |
1 |
2 |
3 |
4 |
6 |
12 |
24 |
48 |
72 |
96 168 |
|
|
|
|
|
|
|
||||||
|
|
|
|
|
|
|||||||||||||||||||
|
|
|
|
|
|
|
|
|
|
|
|
|
|
|
|
|||||||||
|
|
|
Time intervals after PMCAo (Unit: hour) |
|
|
|
|
|
|
|
|
|
after embolism |
|
|
|||||||||
|
|
|
|
|
|
|
|
|
|
|
|
|
|
|
|
|
|
|
|
|
|
|
|
|
Fig. 4.9. Lesion development in stroke models of permanent focal ischemia (PMCAo) visualized by histology (left) and diffu- sion-weighted (DW) imaging. [Adapted from Garcia et al. (1993) and Brinker et al. (1999)]

Insights from Experimental Studies
Table 4.1. Lesion growth determined 30 min and 2 h after middle cerebral artery occlusion in rats. Tissue alterations are presented as hemispheric lesion areas (HLA) that were assessed at the level of striatum. [Adapted from Kohno et al. (1995b)]
|
HLA at striatal level |
|
|
(% of hemisphere) |
|
|
|
|
|
30 min |
2 h |
|
|
|
ATP depletion |
22% |
50% |
(Infarct core) |
|
|
Perfusion deficit |
36% |
52% |
(CBF < 0.20 ml/g/min) |
|
|
Diffusion lesion |
54% |
67% |
Diffusion lesion minus ATP loss |
32% |
17% |
(“Metabolic penumbra”) |
|
|
|
|
|
CBF, local cerebral blood flow.
55
tion of ATP, tissue pH and other metabolites were performed simultaneously with histological assessment 7 h post MCA occlusion (Back et al. 1994a). The close correlation between ATP loss, tissue acidosis and hyperintensity in DWI clearly shows that at this timepoint the rapid phase of infarct development is over and turns into subacute and more chronic processes involving inflammatory and molecular responses (Fig. 4.11).
4.2.2.3
Composition of Focal Ischemic Lesions
occurs at CBF rates that alter the electrical function of the brain (i.e., correspond to the upper threshold of the ischemic penumbra), but do not necessarily lead to morphologic damage (Busza et al. 1992; Hossmann 1994) (see also Fig. 4.4). This notion is of high importance to understand the potential for reversibility of diffusion changes.
Figure 4.9 shows that lesion expansion can be documented by histology (somewhat masked by infarct maturation during the first hours) and DWI, pointing to the very first hours of evolving infarcts as the target of therapy to interfere with the most rapid lesion dynamics. At later timepoints, excellent congruence between histological damage, breakdown of energy metabolism, tissue acidosis and diffusion lesions could be shown. In this study, DWI and biochemical imaging of the regional distribu-
The close investigation of ischemic lesions and their correlates in MRI, CBF maps and biochemical imaging reveals that the response to ischemia is non-uni- form. In accordance to the penumbra concept, the densely ischemic infarct core exhibits lower ADC values (Hoehn-Berlage et al. 1995b) compared to borderzone areas that are exposed to less severe reductions of CBF (Back et al. 1995). The lesions, therefore, show a gradient of CBF values ranging from normal to very low and a parallel gradient of ADC values ranging from normal to about 55% that cover the distance between unaffected surrounding tissue, the ischemic penumbra and the infarct core in three dimensions (Back et al. 1995, 2000a). During the first hours of stroke, special attention should be paid to borderzone regions in which DWI shows hyperintensity, pH is decreased, but ATP remains normal, even in the presence of increased lactate concentrations.
|
Ischemic brain infarct of rat |
|
|
30 minutes occlusion |
2 hours occlusion |
||
DWI |
CBF |
DWI |
CBF |
ATP |
Glucose |
ATP |
Glucose |
Tissue pH |
Lactate |
Tissue pH |
Lactate |
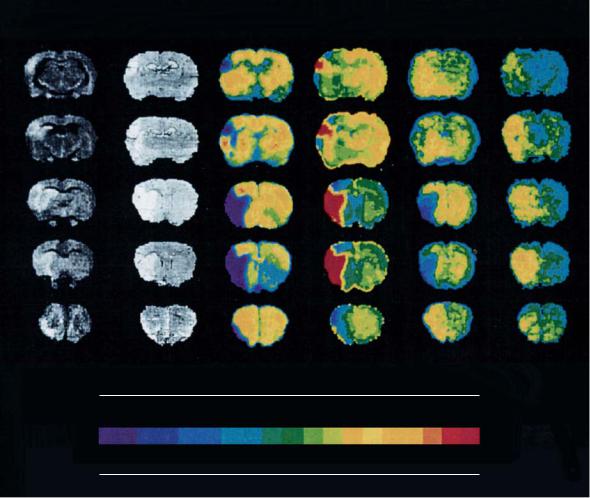
Fig. 4.10. Image combination showing diffusion-weighted images (DWI), maps of cerebral blood flow (CBF), bioluminescence images of ATP, glucose and lactate content, and tissue pH maps at 30-min (two left columns) and 2-h occlusion (two right columns) of the middle cerebral artery in rats. Hyerpintensity in DWI denotes ischemic changes; blue in CBF, ATP and glucose maps marks a reduction in flow, regional ATP and glucose content, respectively. Red in pH maps denotes tissue acidosis. Bright yellow indicates elevated tissue lactate levels. Note that the region with depleted ATP and glucose rapidly grows between 30 min and 2 h postocclusion. At both timepoints, hyperintensity in DWI corresponds well to the areas with diminished blood flow and tissue acidosis, but clearly exceeds the region with ATP loss. [Reproduced with permission from Kohno et al. (1995b)]
56 T. Back
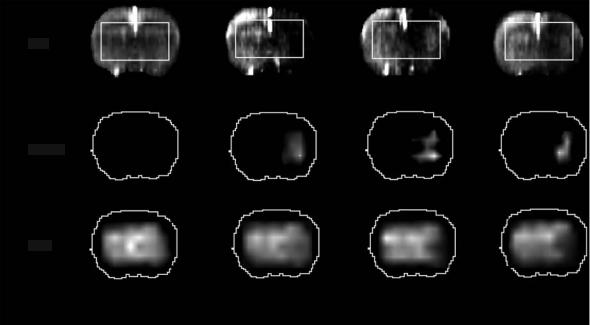
DWI Histology ATP pH Glucose Lactate
ATP |
0.5 |
1.5 |
2.5 |
3.5 |
4.5 |
5.5 |
(mmol/kg) |
pH |
7.7 |
7.4 |
7.1 |
6.8 |
6.5 |
6.2 |
(units) |
Glucose |
0.5 |
1.0 |
1.5 |
2.0 |
2.5 |
3.0 |
(mmol/kg) |
Lactate |
0 |
1.0 |
4.5 |
8.0 |
11.5 |
15.0 |
(mmol/kg) |
Fig. 4.11. Image combination showing diffusion-weighted images (DWI), histological sections and maps that display the regional distribution of ATP, glucose, lactate, and tissue pH. Permanent MCA occlusion was performed in a rat, all images were obtained 7 h postocclusion and are shown at five coronal levels ranging from posterior (first row) to anterior (last row). Note the high congruence of DWI, histology, ATP and pH maps, indicating that the rapid phase of infarct growth has ceased at this timepoint. [Reproduced with permission from Back et al. (1994a)]
By using a thresholding approach in a 3-D CBF data set, we could show that 54% of the total ischemic lesion volume could be attributed to the penumbra, only 46% to the infarct core at 1.5 h post MCA occlusion (Back et al. 1995). Those areas with pending infarction show potentially reversible changes that can be addressed by therapeutic interventions like recanalizing therapy and/or neuroprotective drugs.
Since the spatial progression of acute ischemic stroke is rather a common finding than exceptional, the ischemic penumbra is a “sleeping beauty” that may eventually die (Lassen and Vorstrup 1984). Penumbral regions are recruited into the infarct core during the initital hours of stroke development: the total lesion size expands, however, the ischemic
penumbra is shifted to more peripheral parts of the affected territory and gets restricted in size whereas the infarct core grows at its expense (Table 4.1). In the more complex human brain, the ischemic penumbra may be composed of regions that do show early changes in DWI and those, in which blood flow is altered, but water diffusion remains to be normal (the so-called diffusion-perfusion mismatch region) (Kidwell et al. 2003). By combining DWI with bolus-track perfusion imaging, it could be noted in animal and human stroke that the area with a perfusion deficit was larger than the lesion depicted by DWI. The early identification of such a diffu- sion-perfusion mismatch zone (perfusion reduced, diffusion normal) has been regarded of high thera-
Insights from Experimental Studies |
57 |
peutic interest because it may serve as a marker to properly select patients for thrombolytic therapy (Liu et al. 2000, Hacke et al. 2005). However, the consideration of the whole area with reduced perfusion also includes areas with oligemia that do not trigger pathology and, thus, leads to overestimate the tissue at-risk. A refined model of diffusionperfusion mismatch is presented in Fig. 4.12. The advent of quantitative MR perfusion imaging (see Chap. 6) will enable investigators to transfer well defined flow thresholds from animal experiments (e.g., the penumbral CBF range between 20%-40% of control) to the human situation and improve the prognostic modeling.
Several studies have indicated that the early measurement of the water ADC provides a valuable predictor of final tissue injury (reviewed in HoehnBerlage 1995). This notion has to be extended by adding information on the perfusion status of the tissue: in models of permanent vessel occlusion, DWI may indeed be an excellent surrogate marker for chronic tissue damage. However, if reperfusion is installed either by using a reversible occlusion model or by administration of recanalizing drugs such correlations become much weaker as recently demonstrated (van Dorsten et al. 2002).
4.2.2.4
Transient Occlusion: Reversibility of Changes
In experiments with transient vessel obstruction, the lesion growth, as visualized on DWI, can be reversed if the brain is reperfused within 1 h post occlusion
(Minematsu et al. 1992). Regions like the putamen and, depending on the stroke model, temporal parts of the cortex show consistent infarction. With ongoing ischemia, predominantly cortical areas are recruited into the process of lesion growth. This pattern may be explained first by the threshold relationship between flow reduction and ADC change which may be reversed if the critical CBF value is exceeded upon reperfusion. The protective or beneficial effect disappears if the duration of ischemia exceeds 2–3 h. To achieve reperfusion after defined durations of ischemia, procedures of mechanical reopening of obstructed arteries (e.g., by replacing an intraluminal filament) can be applied, even inside a magnet for MR investigations (Kohno et al. 1995a). The strong interest in thrombolysis has triggered many investigations of transient focal brain ischemia in which reperfusion is initiated by drug-induced clot lysis in animal models of embolic stroke (Busch et al. 1997; Zhang et al. 1997). The advantage of such models is, that the pathophysiology of intravascular thrombosis and thrombolytic therapy are well imitated; potential disadvantages are the reduced prediction of lesioned territories and the prolonged process of recanalization with delayed or undetermined timepoints of actual reperfusion (Schüler et al. 2001).
Figure 4.13 shows a rat brain undergoing 90-min occlusion of the MCA. It exhibits an initial diffusion abnormality that resolves nearly completely after reperfusion. At shorter occlusion times, the ADC is known to normalize throughout the entire brain. Interestingly, several hours up to 3 days after reperfusion of a mild ischemic insult, the lesion may reappear and, eventually, evolve into brain
Diffusion-perfusion mismatch in acute MCA stroke
Perfusion deficit (oligemia and ischemia)
Outer penumbra (DWI normal, PI: ischemia)
Inner penumbra (DWI pathol., pH high, ATP normal)
 Infarct core (ADC low, ATP lost, PI: severe ischemia)
Border between core and
Border between DWI lesion and PI lesion
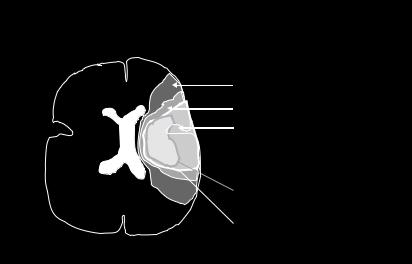
Fig. 4.12. Mismatch concept of diffusion lesion (smaller) and perfusion deficit (larger) in human territorial brain infarction. Acute MCA territory ischemia/oligemia with a smaller, centrally located diffusion disturbance showing the relationship between infarct core, ischemic penumbra and changes in DWI and PI. DWI, diffusionweighted imaging; PI, perfusion imaging; ADC, apparent diffusion coefficient; ATP, high energy phosphates; MCA, middle cerebral artery
58 |
T. Back |
Timecourse of ADC and T2 in reversible MCAO
ADC
T2
MCAO Reperfusion
0.5 h |
1.0 h |
8.5 h |
24 h |
7 d |
22 d |
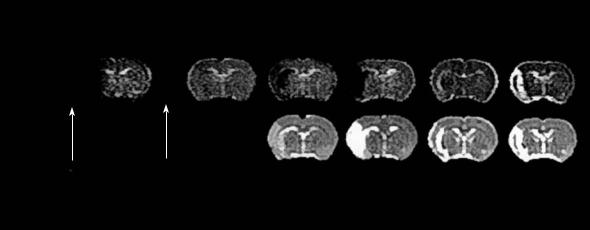
Fig. 4.13. Lesion evolution in reversible (90-min) middle cerebral artery occlusion (MCAO) in a rat. Upper row, quantitative images of the apparent diffusion coefficient (ADC); lower row, quantitative T2 images as measured serially over 22 days post stroke. Note the transient pseudo-normalization of the diffusion disturbance upon reperfusion and, second, after 7 days when initially reduced ADC values slowly shift to supernormal levels indicating the chronic infarct stage. [Reproduced with permission from Hoehn et al. (2001)]
infarction with reduced ADC and prolonged T2 signals completed at about 1 week post occlusion (Du et al. 1996; van Lookeren Campagne et al. 1999). Of note, the thrombolysis-induced reversal of DWI lesion volumes upon prompt recanalization has been also convincingly shown in acute human stroke (Kidwell et al. 2000) and confirmed in a larger patient cohort, recently (Parsons et al. 2002; see Chap. 2). The latter authors also observed that in a proportion of treated patients secondary DWI or ADC abnormalities would develop following early reversal. In those patients, hyperintensity in T2 images indicate the presence of ischemic infarcts. Kidwell and coworkers (2000), therefore, claim: “It is important for clinicians to be aware that some tissue that appears initially to be salvaged on early MRI scan when ADC normalizes, may nonetheless proceed to late tissue infarction.”
Whereas the initial recovery of ADC or DWI lesions really reflects a normalization of tissue energy metabolism (Olah et al. 2000), several studies suggest that the tissue under focus remains to be abnormal even in the presence of re-established perfusion. Theoretically, potential mechanisms of this late secondary ADC decline include reperfusion injury, possibly related to inflammatory responses, oxygen free radical production, ongoing excitotoxic processes emanating from the infarct core, and apoptosis (Hallenbeck and Dutka 1990; Peters et al. 1998).
The application of metabolic imaging assays of cerebral protein synthesis (CPS) shows that, despite
the normalization of energy metabolites, most of the territory affected by transient ischemia displays persisting suppression of CPS (Hata et al. 2000). With the exception of a small peripheral rim in the infarct border where CPS recovered between 6 h and 3 days, the sustained CPS suppression leads to secondary energy failure possibly mediated by mitochondrial dysfunction (Hata et al. 2000). In those secondary infarcts, the presence of prominent TUNEL staining and DNA fragmentation points to apoptosis as a major mechanism of cell death that could be diminished by inhibitors of protein synthesis (Du et al. 1996; Snider et al. 2001). Other authors have argued that the appearance of TUNEL-positive cells in this condition is associated with secondary energy failure due to DNA repair processes (Endres et al. 1997; Hata et al. 2000). Furthermore, in neonatal models of transient hypoxia/ischemia, the distinct and sustained increase of inorganic phosphate (Pi) over phosphocreatine (PCr) levels was documented by labeled phosphorous magnetic resonance spectroscopy (31P-MRS) which, in turn, was associated with reduced water ADC (Thornton et al. 1998). The close link between local energy status and ADC abnormalities could be confirmed both for the intra-ischemic and post-ischemic phase of transient ischemia: if local ADC fell below 77% of normal values ATP was depleted (Olah et al. 2001).
Very brief episodes of ischemia (e.g., 15 min) trigger delayed hyperintensity on T1-weighted MRI visible 1–4 weeks after the ictus in the striatum of humans and rats. It could be shown that these MRI
Insights from Experimental Studies |
59 |
changes correspond to striatal neurodegeneration with chronic inflammation and signs of oxidative stress associated with late-onset cognitive impairment (Fujioka et al. 2003). In the future, more detailed MRI studies exploring very mild ischemic insults will show which abnormalities can be depicted in more chronic stages. Such studies will elucidate more deeply the clinical condition of transient ischemic attacks (TIA) that, for a long time, have been regarded as fully reversible neurological deficits without long-term sequelae. Clinical MRI studies have found that up to 50% of TIA patients indeed show imaging abnormalities (Kidwell et al. 1999) the pathophysiological importance of which wait to be clarified in the future.
4.3
Treatment of Focal Cerebral Ischemia
The ischemic penumbra has been defined as the target of therapy in stroke. In principle, there are two strategies to address this issue. First, one can attempt to increase substrate availability above the threshold of irreversible tissue injury by recanalizing therapies. As we have seen, even slight increases in CBF may confer benefit to tissue in a state at-risk. Thrombolytic therapy is the prototype of this sort of intervention which has been successfully applied to stroke patients (NINDS Study Group 1995, Hacke et al. 2005). Second, there may be pharmacological strategies to decrease the vulnerability or increase the robustness of brain parenchyma, especially neurons, against ischemic injury without improving blood flow. The latter is termed neuroprotective therapy and has attracted strong interest after the discovery of glutamate antagonists that block excitotoxic actions in models of stroke (Choi 1992). It has to be mentioned, however, that tissue at-risk may not survive on longer terms unless perfusion is restored. Also, without reperfusion neuroprotective drugs have little chance to reach their target tissue in sufficient concentrations. This notion represents two reasons among others why so many clinical trials of neuroprotection in human stroke have failed (Grotta 1995).
4.3.1
Recanalizing Strategies and Risk of Hemorrhage
Animal models of embolic stroke enable us to study effects of fibrinolytic drugs like recombinant tissue
plasminogen activator (tPA) (Brinker et al. 1999). Thrombolysis with tPA should be administered as long as the target brain tissue is viable and reperfusion can be expected to reduce or prevent tissue damage. With ongoing ischemia times and increasing disturbance of the blood–brain barrier, tPA treatment may loose its benefit and harm by the induction of parenchymal hemorrhage. In the section on transient occlusion models, we have already learnt about the complex primary and secondary imaging abnormalities that accompany reperfusion. Obviously, the failure of a fibrinolytic drug to recanalize the obstructed artery does not reverse ischemic injury, but other factors, such as breakdown of the blood–brain barrier, microembolism and reperfusion injury, may play an additional role. It is desirable to look for predictors of therapeutic outcome with regard to both, tissue recovery and hemorrhagic complications to early identify salvageable brain tissue.
Repeated MR measurements of diffusion and perfusion (perfusion imaging, PI) in embolic models of stroke have not shown differences in lesion development compared to other types of permanent MCA occlusion as long as thrombolysis was not applied (de Crespigny et al. 1993). In PI, the territorial perfusion deficit is observed followed by DWI abnormalities and, later, changes in T2 that expand over time (Brinker et al. 1999). Phosphorous (31P) as well as proton MR spectroscopy are able to monitor the generation of lactate and high-energy phosphates due to anaerobic glycolysis that are coupled to a rapid consumption of glucose. When glucose availability drops, ATP production becomes compromised and causes the depletion of the PCr pool. The concentration of inorganic phosphate increases, eventually leading to a complete loss of ATP.
Several studies have evaluated the effect of tPA treatment administered at variable timepoints after clot embolization (Brinker et al. 1999; Busch et al. 1998; Franke et al. 2000; Jiang et al. 2000). Early lesion expansion as visible on DWI could only be reversed or slowed down if thrombolysis-induced reperfusion was initiated early after the onset of ischemia (Fig. 4.14). For example, if tPA was given at 1.5 h post occlusion the DWI lesion did not further enlarge whereas thrombolysis at later timepoints did not attenuate lesion growth (Brinker et al. 1999). Correlation analysis with other MR parameters revealed that areas with increased lactate or T2 values did not improve when tPA was started ≥ 3 h after the insult (Franke et al. 2000). By using histological means, other investigators however
60 |
T. Back |
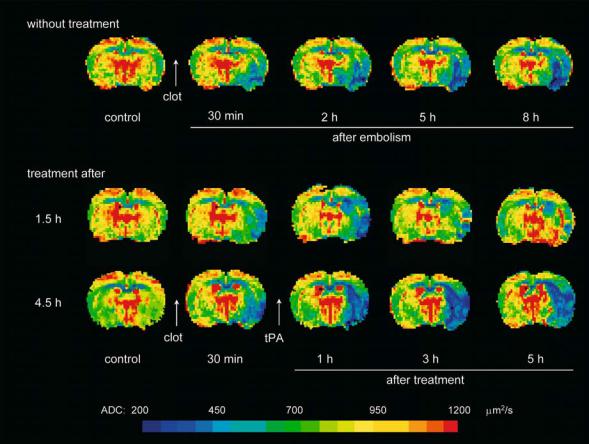
Fig. 4.14. Maps of the apparent diffusion coefficient (ADC) measured before and after embolic occlusion of the right middle cerebral artery in an animal without therapy (upper row) and in two animals with thrombolytic treatment initiated 1.5 h (middle row) and 4.5 h (lower row) after onset of ischemia. In the untreated animal, a decline of ADC was observed immediately after MCA occlusion that increased in size over time. Thrombolysis with recombinant tissue-type plasminogen activator (tPA) lead to the partial reversal of the ADC lesion over the first 5 h of therapy if started early. Late-onset thrombolysis at 4.5 h post occlusion did not reverse lesion growth, but was followed by a further lesion enlargement of the ischemic lesion. [Reproduced with permission from Hoehn et al. (2001)]
showed that tPA does reduce ischemic damage also at later timepoints as long as complete recanalization is achieved. In this study, the volume of complete infarction was significantly smaller in animals with successful reperfusion having a higher proportion of scattered neuronal injury of total lesion size (Back et al. 2002).
In contrast to the instantaneous and complete reperfusion as seen after removal of an occluding thread or filament, thrombolysis induces clot lysis in a delayed and often incomplete manner, both in humans and animals (Busch et al. 1998; Furlan et al. 1999; von Kummer et al. 1995; Schüler et al. 2001). This effect could be well monitored by PI showing that thrombolysis improves blood flow, but leads to incomplete reperfusion in a sense that pre-ischemic CBF values are rarely restored (Busch
et al. 1998; Franke et al. 2000). Potential explanations for this observation include: (i) the possibility of clot fragmentation and down-stream embolism with more peripheral obstruction of the capillary bed, and (ii) too slow recanalization that prompts cell swelling but does not sufficiently supply glucose and oxygen to the ischemic tissue, thereby leading to a vicious circle of cell swelling, compression of the microcirculation and impaired blood flow. Indeed, MR angiography has been successfully applied to a thromboembolic stroke model of rats to characterize intracranial vessel occlusion patterns as well as the time lag between tPA treatment and vessel reopening. Combined occlusions of the circle of Willis and the MCA had recanalization times of 70–80 min post tPA treatment whereas selective MCA occlusion was recanalized after about 20 min. The type of occlu-
Insights from Experimental Studies |
61 |
sion predicted outcome as evidenced by ADC and T2 relaxation time maps (Hilger et al. 2002). The efficacy of tPA treatment in an experimental setting seems to depend also greatly on composition and generation of the occluding clot: thrombin-induced blood clots injected into the internal carotid artery, induced a delayed type of cerebral reperfusion upon tPA therapy compared to spontaneously forming clots (Niessen et al. 2003). Incomplete reperfusion patterns lead to sustained reduction of ADC, increases in T2 and blood–brain barrier permeability, thereby triggering edema formation.
The combination of tPA therapy with other drugs may enhance the effect of thrombolysis. It could be shown that the addition of hirulog, a novel antithrombin, to tPA therapy improved and accelerated reperfusion, but did not result in a better outcome (Yenari et al. 1997). Antiadhesion molecule antibodies can be also combined with tPA. The antiCD18 antibody in combination with tPA significantly reduced lesion volume (Chopp et al. 1999). To date, the combination of thrombolytics with antagonists of the glycoprotein IIb/IIIa receptor are expected to be of substantial benefit. In myocardial infarction, rate and degree of recanalization could be clearly improved although the dose of the fibrinolytic drug was half of the usual (Antman et al. 1999). This improvement was achieved without increasing the risk of major bleeding. Similarly, the first observations of combined thrombolysis with tPA and antiGP IIb/IIIa drugs in brain ischemia have proven to be very promising in man and animal models of stroke (Shuaib et al. 2002; Straub et al. 2004). More detailed studies employing MR imaging and spectroscopy will be able to explore the potentials of this new therapeutic approach. Another novel development is the iv administration of high-dose albumin that has been shown to dramatically reduce ischemic edema along with a marked reduction of ischemic damage and better functional outcome (Belayev et al. 1998). Treated animals showed only very mild changes in ADC compared to saline treatment. Albumin also lead to higher ADC values within unlesioned brain regions – an effect as yet unexplained.
Alternatively, a better preselection of patients who may benefit from thrombolytic therapy or who may suffer from hemorrhagic complications, is an appealing approach. The idea is to characterize ischemic tissue subareas by information from DWI, PI, MRS, T1or T2-weighted images in order to estimate the volume of tissue at-risk that may profit from recanalization. We have already reviewed the mismatch
concept of diffusion lesion and perfusion deficit. Using a spectroscopic imaging sequence, Franke et al. (2000) could demonstrate that the probability of metabolic tissue recovery, defined as the reversal of an increased lactate concentration in the ischemic region, clearly declines with increasing tissue lactate content before thrombolysis (Fig. 4.15). This probability was shown to be independent of treatment delay. Metabolic recovery could be predicted knowing metabolic disturbances alone. In another study the relative ADC, T2, and perfusion values before thrombolysis were tested for their ability to predict outcome (Pillekamp et al. 2001). The probability of tissue damage 5 h after tPA treatment increased with the severity (i.e., degree of reduction) of ADC changes prior to thrombolysis. Pretreatment PI or T2 relaxometry also correlated with outcome, but
–alone or in combination with pretreatment ADC maps – did not improve injury prediction over that obtained by ADC alone (Pillekamp et al. 2001). In a recent MR study in human stroke patients, the prolongation of the mean transit time (MTT) in PI indicating impaired CBF, differed significantly between the regions that became infarcted or salvaged tissue on day 90 (Butcher et al. 2003). Relative CBF was 10% lower in infarcted tissue than in salvaged regions. The authors also showed that
–when reperfusion occurred – tissue with more severely prolonged MTT (i.e., lower CBF) was rescued from infarction relative to patients with persistent hypoperfusion. In addition, the magnitude of early reversal of the perfusion deficit proved to be the best predictor of favorable clinical outcome in another study (Chalela et al. 2004). MRI was performed prior to and soon after tPA therapy in acute stroke patients; the decrease of the hypoperfusion volume on MTT maps by > 30%, but not of DWI lesions, was a strong independent predictor of good clinical outcome evidenced by a 3-month Rankin score < 2 (Chalela et al. 2004).
The predictability of hemorrhagic complications remains a controversial issue. Knight et al. (1998) described that the post-reperfusion parenchymal enhancement of contrast agent on T1-weighted MRI predicted petechial hemorrhage after 24 h. By contrast, Neumann-Haefelin et al. (2001) could not predict the occurrence of hemorrhagic transformation between day 2 and 7 on the basis of early blood– brain barrier disruption or ADC changes in a reversible suture occlusion model of stroke. However, in an embolic stroke model the hemorrhagic transformation of infarction was significantly more frequent in tPA-treated animals. In those animals, hemorrhagic
62 |
T. Back |
PI
Lactate
NAA
|
|
1.5 h after |
2 h after |
5 h after |
||
control |
|
|
|
|
|
|
|
|
|
embolism |
|
thrombolysis |
|
Fig. 4.15. Perfusion images (PI) and spectroscopic imaging maps of lactate and N-acetyl-aspartate (NAA) before and after embolic occlusion of the middle cerebral artery. Thrombolysis was applied 1.5 h after embolism and lead to a partial reperfusion of the affected territory (upper row). There was a clear increase in lactate that was partially reversed upon thrombolytic reperfusion. NAA maps showed a decreased signal in the ischemic hemisphere that did not recover. [Reproduced with permission from Franke et al. (2000)]
transformation occurred in the ischemic core region and could be predicted by a disturbance of the blood–brain barrier before treatment by Gadolin- ium-DTPA contrast enhancement, but not by ADC, T2, or perfusion imaging (Neumann-Haefelin et al. 2002). The region of bleeding co-localized with prior contrast enhancement in those animals.
It has to be mentioned, that in the clinical context the occurrence of hemorrhagic transformation is a part of the natural history of territorial infarcts occurring in 40%–60% of cases (Jorgensen and Torvik 1969) and behaving differently from parenchymal hematomas that are associated with worse outcome especially in the setting of thrombolytic therapy (Fiorelli et al. 1999). Molina et al. (2002) showed prospectively in a series of tPA-treated patients, that the occurrence of hemorrhagic transformation as visible on CT scans on day 3 to 4, was a marker of successful recanalization and lead to reduced infarct size and improved clinical outcome. Nonetheless, one would wish that the benefit of thrombolytic therapy could be conferred without producing mild hemorrhagic signs. It is also controversial whether or not the detection of old microbleeds by T2* imaging prior to thrombolytic treatment is of significance for outcome (Derex et al. 2004; Kidwell et al. 2002).
4.3.2
Neuroprotective Strategies
Interventions by drug application can be properly monitored by MRI, especially DWI. This is of particular interest because any therapeutical strategy will be most effective if applied during the early ischemic period, i.e., the initial 6 h after vessel occlusion when changes of lesion size and lesion composition are most rapid as already shown above. Table 4.2 lists the most important studies in this field showing that – depending on the animal model and the time of reperfusion – a drug-related reversal of the diffusion lesion is rather the exception than the rule (Busch et al. 2002; Ebisu et al. 2001; Gill et al. 1996; HoehnBerlage et al. 1997; Kucharczyk et al. 1991; Lo et al. 1994; Minematsu et al. 1993b; Muller et al. 1995; Seega and Elger 1993). Histologically confirmed positive treatment effects are in most cases ref lected by a slowing of the lesion enlargement during the first hours of ischemia and/or reperfusion. Even in the case of early DWI lesion regression one has to consider the possibility of late lesion reappearance as shown earlier in this chapter.
Insights from Experimental Studies |
|
|
63 |
||
Table 4.2. Selected studies that employ MRI to monitor drug effects in models of stroke |
|
||||
|
|
|
|
|
|
Authors |
Year |
Neuroprotective drug |
Species Animal model |
Result |
|
|
|
|
|
|
|
Kucharczyk |
1991 |
sodium-calcium channel blocker |
cat |
perm MCAO |
smaller DWI lesion, MRS: |
et al. |
|
(RS-87476) |
|
|
lactate reduced |
Seega et al. |
1993 |
serotonin antagonist |
rat |
perm MCAO |
reduced edema formation |
|
|
(levemopamil) |
|
|
(T2) |
Minematsu |
1993 |
non-comp NMDA antagonist |
rat |
3-h MCAO + reperfusion |
better DWI lesion regression |
et al. |
|
(MK-801) |
|
|
post reperfusion |
Lo et al. |
1994 |
non-comp NMDA antagonist |
rat |
perm MCAO + reperfusion DWI lesion regression |
|
|
|
(MK-801) |
|
|
|
Müller et al. |
1995 |
free radical scavenger (U74389G) |
rat |
2-h MCAO + reperfusion |
better DWI lesion regression |
|
|
|
|
|
post reperfusion |
Gill et al. |
1996 |
MK-801 |
rat |
perm MCAO |
slower lesion progression |
Hoehn-Berlage |
1997 |
cation channel blocker |
rat |
perm MCAO |
slower lesion progression |
et al. |
|
(LOE 908 MS) |
|
|
|
Ebisu et al. |
2001 |
immunosuppressant FK 506 |
rat |
perm MCAO |
slower lesion progression |
Busch et al. |
2002 |
tPA |
rat |
embol MCAO |
slower lesion progression |
|
|
|
|
|
|
Perm, permanent; embol, embolic; MCAO, middle cerebral artery occlusion; MRS, magnetic resonance spectroscopy; noncomp, non-competitive
Several authors have investigated the cerebroprotective effects of NMDA receptor antagonists by using DWI. Minematsu et al. (1993a,b) studied CNS-1102 in two different models: permanent MCA occlusion and 3-h occlusion followed by 21 h of reperfusion. The drug was given 15 min after vascular occlusion and infusion was continued for 3 h to obtain constant plasma levels. The comparison of lesion size on DWI at 3 h post occlusion with histological analysis after 24 h showed a good spatial correspondence in the reversible ischemia model, both with and without treatment. In the permanent occlusion model, DWI hyperintensity at 3 h post occlusion slightly underestimated the lesion size as assessed on histological sections – due to a certain growth of lesions between the two timepoints. Reductions of infarct size by 66% in the permanent ischemia model and by 40% in the reversible model were observed. Similar observations were made with MK-801, a noncompetitive NMDA receptor blocker (Gill et al. 1996; Lo et al. 1994). Gill et al. (1996) observed a progressive increase in the volume of hyperintensity over the total observation time for both, treated and placebo groups. However, the lesion size in MK-801 treated animals was consistently smaller on DWI with less marked signal changes. Hoehn-Berlage et al. (1997) made similar measurements when a cation channel blocker was applied (Fig. 4.16).
The development of the excitotoxicity hypothesis of ischemic damage along with the advent of potent glutamate antagonists provided the theoretical basis of what has been named neuroprotection. The failure of more than 40 clinical trials that have applied neuroprotectants to stroke patients, to show a clear clinical benefit has, however, raised concerns about
this concept (Grotta 1995; Weir et al. 2004). Apart from considerations of correct drug dosage, limited therapeutic time window, and the heterogeneity of stroke syndromes, it is questionable whether the drugs can arrive at their target unless reperfusion is installed to some degree. Therefore, strategies to combine thrombolysis and neuroprotective agents have been developed and recently reviewed (Chen et al. 2002). In own experiments, the combination of tPA with the NMDA receptor antagonist memantine was unable to reduce tissue damage in embolic stroke (Back et al. 2004). Future studies that target molecular responses like the action of serine proteases on protease-activated receptor 1 (PAR-1) (Junge et al. 2003) or the activation of newly discovered acidsensing ion channels that are calcium permeable (Chu et al. 2002), may reveal intriguing insights. The successful translation of experimentally proven strategies into the clinical field may require a better design of trials (Weir et al. 2004) that may – as one potent measure – implement MRI prior to treatment in order to better define and select stroke patients (Warach 2001).
4.4
Delayed Effects After Cerebral Ischemia
In the previous sections we have, by part, already reviewed delayed effects after cerebral ischemia, such as the risk of hemorrhagic complications that may occur as petechial bleedings or parenchymal hematoma. We have seen that the blood–brain barrier opens to various degrees with a substantial time