

3troubleshootingjunos
.pdfNot
Troubleshooting JUNOS Platforms
InteractiveReproductionSh ll Su ort
Based a Fr BSD op rating system, the JUNOS Software CLI supports an escape to a UNIX shell. While the possibilities can seem endless, we stress that designers highly customized JUNOS Software, and did not design it to act as a Web server or as some type of UNIX device. You can do serious damage to the Juniper Networks platform if
foryou do not observe great care and caution when operating in a shell. Access to an inte active shell is controllable through login class permissions. Once at a shell, you can su to root, if you know the root password, or if you have not set it.
Juniper Networks does not officially support use of the shell because the CLI offers all that you should need in normal circumstances. For advanced troubleshooting activities, or for advanced functionality like automated shell scripts (for which Juniper Networks support is not expected or sought), the shell can be a real boon.
Users who wish to add production scripting functionality to their networks should consider operational scripts, commit scripts, and event scripts. The coverage of these scripts is outside of the scope of this course.
Continued on next page.
Troubleshooting Tool Kit for JUNOS Platforms • Chapter 3–45

Troubleshooting JUNOS Platforms
Some Shell Support Details
From a troubleshooting and operational analysis perspective, a few good reasons for escaping a shell exist. These reasons include the following:
• |
Access to standard utilities and programs like tar, gzip, top, ps, |
|
kill, vi, and so forth, offer experienced UNIX users the tools they need |
|
to perform advanced troubleshooting tasks like compressing a core file |
|
Reproduction |
|
or manually editing a configuration file when the CLI is not available; |
• |
Use sysctl to access and modify (under the guidance of JTAC) various |
|
kernel parameters like TCP window sizes, the number of available |
|
protocol sockets, and so forth; and |
• |
Establish a connection to the embedded hosts (con rollers) w h the |
|
PFE complex to access diagnostic and log data held in NVRAM. |
Not |
for |
|
Chapter 3–46 • Troubleshooting Tool Kit for JUNOS Platforms
Troubleshooting JUNOS Platforms
|
|
Reproduction |
|
|
|
|
|
||
|
|
Interactive Sh ll Case Study: tcpdump |
||
|
|
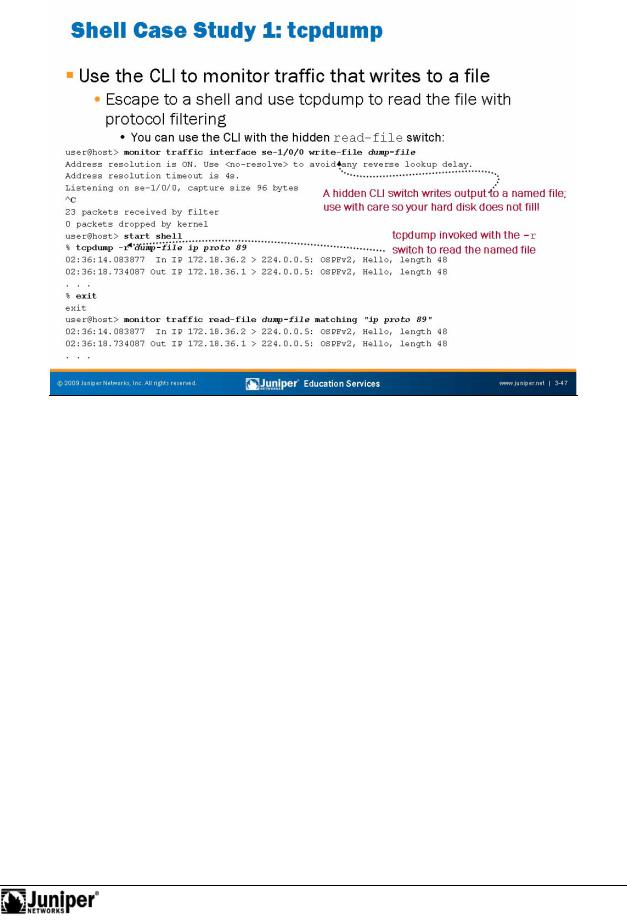
The slide shows how writing monitored traffic to a file allows the use of protocol |
||
|
|
filtering and standard protocol analysis tools like tcpdump. Note that in real-time |
||
|
|
mode, protocol filtering does not function because the Layer 2 headers are stripped in |
||
|
|
ha dwa before the monitoring of traffic occurs. To work around this problem, JUNOS |
||
|
|
Softwa e writes pseudo-Layer 2 headers when writing monitored traffic to a file. The |
||
|
|
p esence of these headers accommodates protocol filtering actions. |
||
|
|
On the slide, we start by issuing a monitor traffic interface se-1/0/0 |
||
|
|
c mmand using the hidden write-file switch and a target file name of |
||
|
|
dump-file. Note that the write-file switch is hidden because failing to stop the |
||
Not |
traffic monitoring could result in the /var file system becoming full. While this |
|||
|
forcondition should not crash the router, it impacts the router’s ability to conduct |
|||
|
|
on-going logging and tracing activities. |
||
After the traffic monitoring ceases, we escape to a UNIX shell and invoke tcpdump with the –r switch to tell it to read the contents of the named file.
Continued on next page.
Troubleshooting Tool Kit for JUNOS Platforms • Chapter 3–47

Troubleshooting JUNOS Platforms
|
Interactive Shell Case Study: tcpdump (contd.) |
|
|
The following example shows how similar results are possible within the CLI using the |
|
|
hidden read-file switch and a protocol filter expression: |
|
user@host> monitor traffic read-file dump-file matching ? |
||
Possible completions: |
|
|
<matching> |
Expression for headers of receive packets to match |
|
|
|
Reproduction |
user@host> monitor traffic read-file dump-file matching "ip proto 89" |
||
19:00:18.203725 Out IP 10.0.13.2 > 224.0.0.5: OSPFv2, Hello, length: 48 |
||
19:00:22.938474 Out IP 10.0.13.1 > 224.0.0.5: OSPFv2, Hello, length: 48 |
||
. . . |
|
|
Not |
for |
|
|
|
|
Chapter 3–48 • Troubleshooting Tool Kit for JUNOS Platforms
Not
Troubleshooting JUNOS Platforms
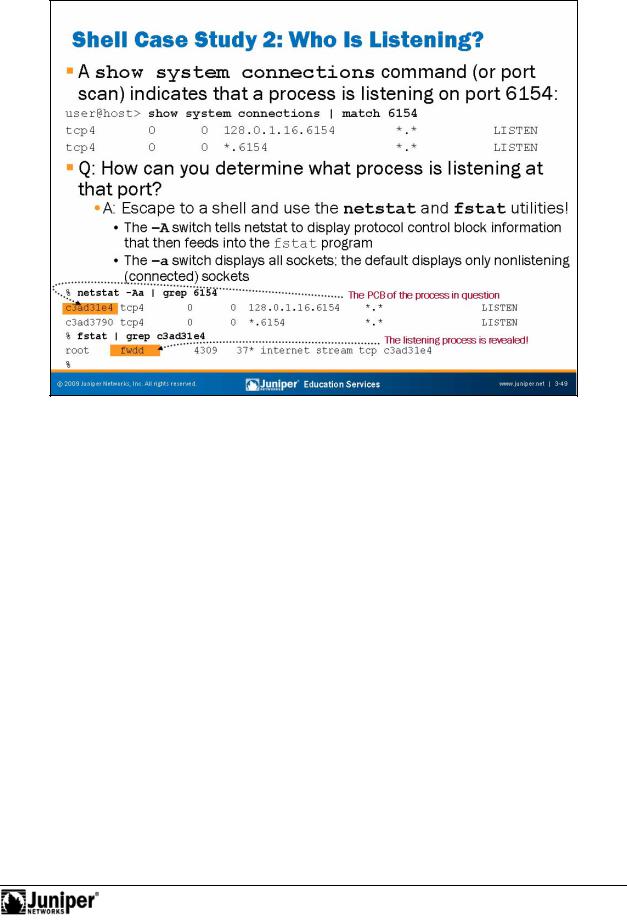
What IsReproductionList ning on TCP Port 6154?
In some cas s, you must d termine exactly what process has opened a TCP or UDP port to list for conn ctions. Such an event might stem from a curious operator who questions the output of a show system connections command, as shown on the slide, or as a result of a security audit involving port scanning.
forH w to Determine What Process Opened a Port
By escaping to a shell and using the standard BSD netstat and fstat commands, y u can determine what process is listening on a given port using the steps outlined on the slide. You begin by issuing a netstat –Aa command that displays all listening and connected sockets (the –a switch), along with the related protocol control block (PCB) information (the –A switch). In this example, the grep utility saves some parsing work by matching only lines containing the value 6154. The result of this command is the PCB information needed for the subsequent fstat command. Once again, grep matches only the lines of interest.
The output of the fstat command makes it clear that the culprit is the fwdd process, which is the packet forwarding engine forwarding process.
Troubleshooting Tool Kit for JUNOS Platforms • Chapter 3–49
Troubleshooting JUNOS Platforms
|
|
|
|
Reproduction |
|
|
|
|
|
|
|
|
|||
|
|
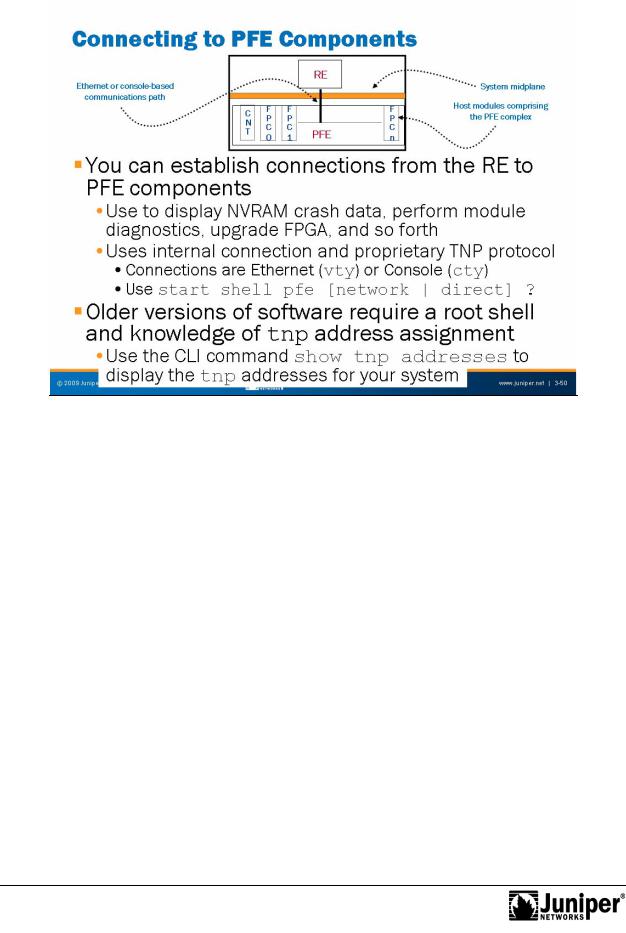
Connecting to PFE Com |
nts |
||||
|
|
You can use the int rnal conn |
ctivity between the RE and PFE, along with the Trivial |
||||
|
|
Network Protocol (TNP), to stablish connections to embedded hosts (controllers) |
|||||
|
|
within the PFE complex. The term embedded host refers to a PFE component with its |
|||||
|
|
own mic op ocessor and microkernel. Examples include system Control Boards and |
|||||
|
|
FPCs. |
|
|
|
|
|
|
|
In m |
|
st cases, the only reason to connect to a PFE component is to access diagnostic |
|||
|
|
in |
mati n in the form of log entries or core files retained in the affected component's |
||||
|
|
NVRAM. On m st platforms you use virtual terminal (vty) connectivity over an |
|||||
|
|
Ethernet c mmunications channel. The use of vty requires that you specify the |
|||||
Not |
correct tnp address. Some platforms also support console (asynchronous) access |
||||||
|
forusing a serial type of connection known as a cty. |
||||||
By parsing entries in the syslog, you can determine what PFE component has reported a crash, and therefore to which embedded host you must connect to obtain crash and log data for submission to JTAC.
Continued on next page.
Chapter 3–50 • Troubleshooting Tool Kit for JUNOS Platforms

Troubleshooting JUNOS Platforms
Connecting to PFE Components (contd.)
To connect to a PFE component, issue use the start shell pfe command with the network switch for Ethernet access or the direct switch for console access. Use the context sensitive help feature to display tnp address or name assignment:
user@host> start shell pfe network ? |
|
Possible completions: |
Reproduction |
fpc0 |
Connect to Flexible PIC Concentrator 0 |
fpc1 |
Connect to Flexible PIC Concentrator 1 |
fpc2 |
Connect to Flexible PIC Concentrator 2 |
fpc3 |
Connect to Flexible PIC Concentrator 3 |
fpc4 |
Connect to Flexible PIC Concentrator 4 |
fpc5 |
Connect to Flexible PIC Concentra or 5 |
fpc6 |
Connect to Flexible PIC Concentra or 6 |
fpc7 |
Connect to Flexible PIC Concentra or 7 |
user@host> start shell pfe network fpc1
Older Versions of Software
If you are running older versions of JUNOS Software, whether connecting by vty or cty, you might need to be at a r t shell pr mpt to forge a connection from the RE to a PFE component. When using a vty c nnection, you should first issue the show tnp addresses CLI command so that y u know which address to specify. You can also use the tnpdump command, which is an alias to the show tnp addresses command at the shell om .
Not |
for |
|
Troubleshooting Tool Kit for JUNOS Platforms • Chapter 3–51
Troubleshooting JUNOS Platforms
|
|
|
|
Reproduction |
|
|
|
|
|
|
|
|
|||
|
|
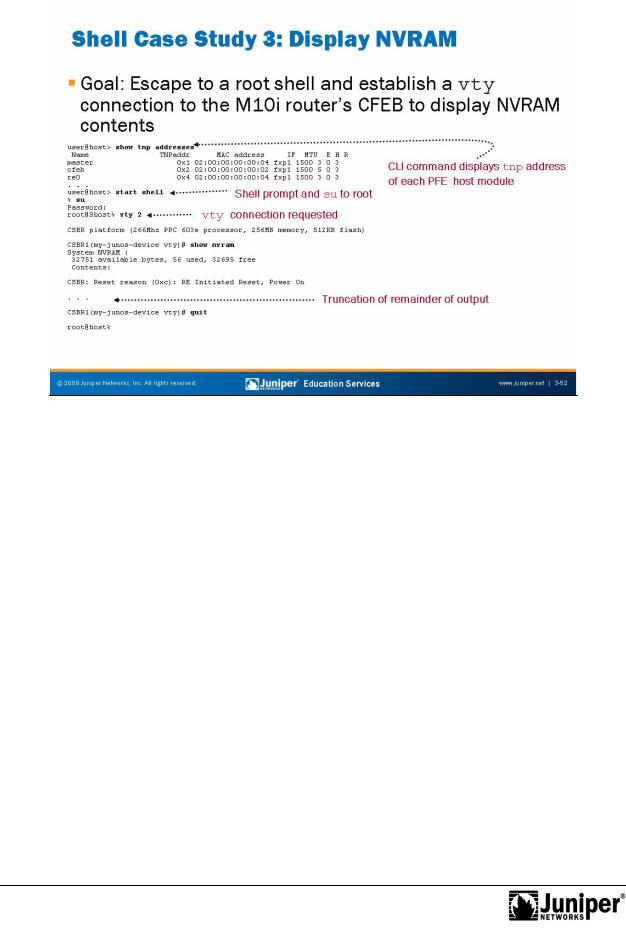
Shell Case Study: Dis lay NVRAM |
|
|
|
||
|
|
The example on the slide b gins by issuing the show tnp addresses command to |
|||||
|
|
obtain the list of tnp ndpoints for the platform in ques |
(an M10i router). In this |
||||
|
|
example the goal is to connect to the M10i router’s CFEB, which is currently using tnp |
|||||
|
for |
|
|
|
|||
|
|
add ess 2. |
|
|
|
|
|
|
|
Armed with the knowledge of the CFEB’s tnp address, we escape to a shell and issue |
|||||
|
|
an su to the ot so as to execute a vty 2 command. The slide shows that the |
|||||
|
|
c |
nnecti n is successful by virtue of receiving the login banner from the CFEB. Once |
||||
|
|
c |
nnected, we issue a show nvram command to obtain diagnostic information for |
||||
|
|
use by JTAC. When done, we break out of the vty connection and return to the root |
|||||
Not |
shell with a quit (or exit) command. |
|
|
|
|||
|
|
|
|
|
|
||
Chapter 3–52 • Troubleshooting Tool Kit for JUNOS Platforms
Troubleshooting JUNOS Platforms
|
|
|
Reproduction |
|
|
|
|
|
|
||
|
|
Troubleshooting Tools: Core Files for Diagnostic Analysis |
|||
|
|
The slide highlights the topic we discuss next. |
|||
Not |
for |
|
|
|
|
|
|
|
|
||
Troubleshooting Tool Kit for JUNOS Platforms • Chapter 3–53
Troubleshooting JUNOS Platforms
|
|
c upt a memoReproductiony pointer or result in an illegal instruction. |
|
|
|
|
|
||
|
|
Complexity of Mod rn Com ut rs and Operating Systems |
||
|
|
The complexity of mod rn comput rs and operating systems leads to equally complex |
||
|
|
bugs! It is very difficult to diagnose transient software failures (for example, a random |
||
|
|
crash or reboot), because so many potential causes for these types of faults exist. In |
||
|
for |
|||
|
|
most cases, a c ash is the result of a programming error or the failure to anticipate a |
||
|
|
pa ticular set of events and the software interaction that ensues. However, a crash |
||
|
|
can also stem f om hardware-related causes. In the latter case, a memory error might |
||
|
|
Because transient software failures are so difficult to diagnose, well-written code |
||
|
|
inc rp rates the ability to dump the program’s environment in the form of memory |
||
Not |
pointers, instructions, and register data to a file in the event of a panic or other |
|||
serious malfunction. A software engineer using a debugger and a version of the |
||||
executable containing debugging symbols can analyze the resulting core file. The |
||||
result of this analysis is generally a very good idea of the sequence of events that led |
||||
to the crash, and armed with this information, you can take corrective actions. For |
||||
example, you can perform a software patch or hardware Return Materials |
||||
Authorization (RMA). |
||||
While it might sound bad, it is actually quite beneficial that JUNOS Software has the |
||||
ability to dump various types of core files for diagnostic use. In most cases, core files |
||||
generate automatically as a result of a failure, but you can also generate cores on |
||||
demand. JUNOS Software can generate core files relating to the JUNOS Software |
||||
kernel itself, to the processes that run above that kernel, or to the embedded host modules within the PFE.
Chapter 3–54 • Troubleshooting Tool Kit for JUNOS Platforms