

3troubleshootingjunos
.pdfNot
Troubleshooting JUNOS Platforms
|
Reproduction |
|
|
||
|
|
||||
Displaying the Status of a S ecific FPC |
|||||
The show chassis fpc detail command shows detailed information about the |
|||||
FPCs install |
|
in the syst m. Adding an FPC number, as in the example on the slide, |
|||
limits the output to the specified FPC. The sample output fields are as follows: |
|||||
for |
• |
State: Displays the state of the FPC slot: |
|||
|
– |
Dead: Indicates that the slot is held in reset because of errors. |
|||
|
– |
Diag: Indicates that the slot is being ignored while the FPC is |
|||
|
|
running diagnostics. |
|||
|
– |
Dormant: Indicates that the slot is held in reset. |
|||
|
– |
Empty: Indicates that no FPC is present. |
|||
|
– |
Online: Indicates that the FPC is online and running. |
|||
|
|
– |
Present: Indicates that the chassis process detects the FPC but |
||
|
|
|
it is either not supported by the current version of JUNOS Software |
||
|
|
|
or it is in the wrong slot. The output also states either Hardware |
||
|
|
|
Not Supported or Hardware Not In Right Slot. FPC is |
||
|
|
|
coming up but it is not yet online. |
||
Continued on next page.
JUNOS Platforms Hardware Troubleshooting • Chapter 4–25

Troubleshooting JUNOS Platforms
Displaying the Status of a Specific FPC (contd.)
– Probed: Indicates that the probe is complete and awaits PFE restart.
– Probe-wait: Indicates that the slot is waiting for probing.
• Logical slot: Displays the slot number.
• Total CPU DRAM: Displays the amount of DRAM available to the FPC’s CPU.
• Total SRAM: Displays the amount of SRAM in use by the FPC’s CPU.
• Total SDRAM: Displays the total amount of memory used f r st r ng packets and notifications.
|
Please note that depending the platform, the output field de ails m ght vary. |
|
|
for |
Reproduction |
Not |
|
|
|
|
|
Chapter 4–26 • JUNOS Platforms Hardware Troubleshooting
Not
Troubleshooting JUNOS Platforms
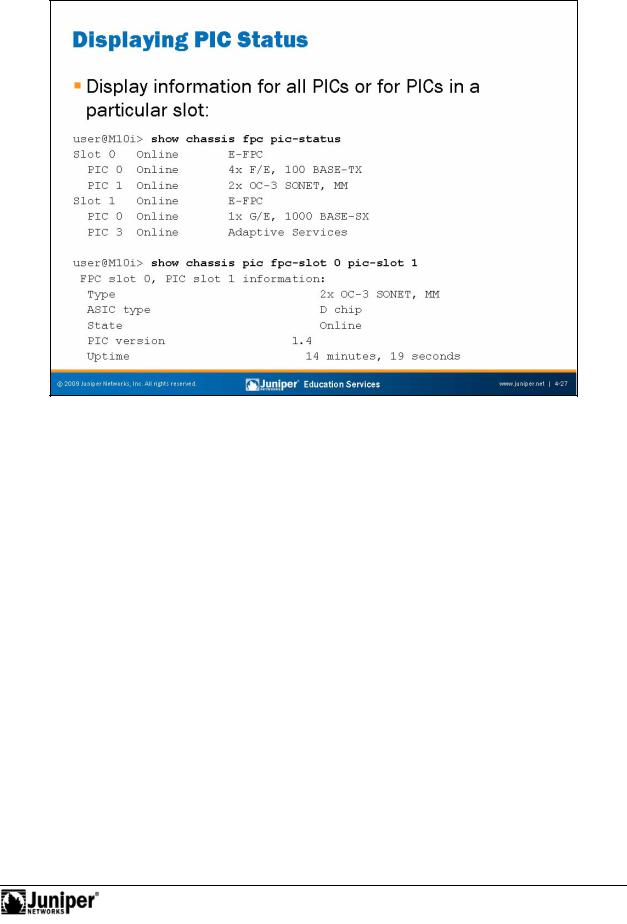
Displaying PIC Status
The show chassis fpc pic-status command displays information for all PICs. The following are the output fields:
|
• |
State: Indicates the state of the FPC slot, which can be one of the |
|
|
|
following: |
|
|
|
– |
Dead: Indicates that the FPC is held in reset because of errors. |
for |
Reproduction |
||
|
– |
Diag: Indicates that the slot is being ignored while the FPC runs |
|
|
|
diagnostics. |
|
|
– |
Dormant: Indicates that the slot is held in reset. |
|
|
– |
Empty: Indicates that no FPC is present. |
|
|
– |
Online: Indicates that the FPC is online and running. |
|
|
|
– |
Present: Indicates that the chassis process detects the FPC but |
|
|
|
it is either not supported by the current version of JUNOS Software |
|
|
|
or it is in the wrong slot. The output also states either Hardware |
|
|
|
Not Supported or Hardware Not In Right Slot. FPC is |
|
|
|
coming up but it is not yet online. |
Continued on next page.
JUNOS Platforms Hardware Troubleshooting • Chapter 4–27

Troubleshooting JUNOS Platforms
Displaying PIC Status (contd.)
– Probed: Indicates that the probe is complete and that the slot awaits PFE restart.
– Probe-wait: Indicates that the slot is waiting for probing.
• |
PIC type: Displays the type of PIC at each PIC location and the number |
|
of ports the PIC. |
To display detailsReproductionabout a specific PIC, use the show chassis pic fpc-slot fpc_slot_number pic-slot pic slot number command.
Not |
for |
|
Chapter 4–28 • JUNOS Platforms Hardware Troubleshooting
Not
Troubleshooting JUNOS Platforms
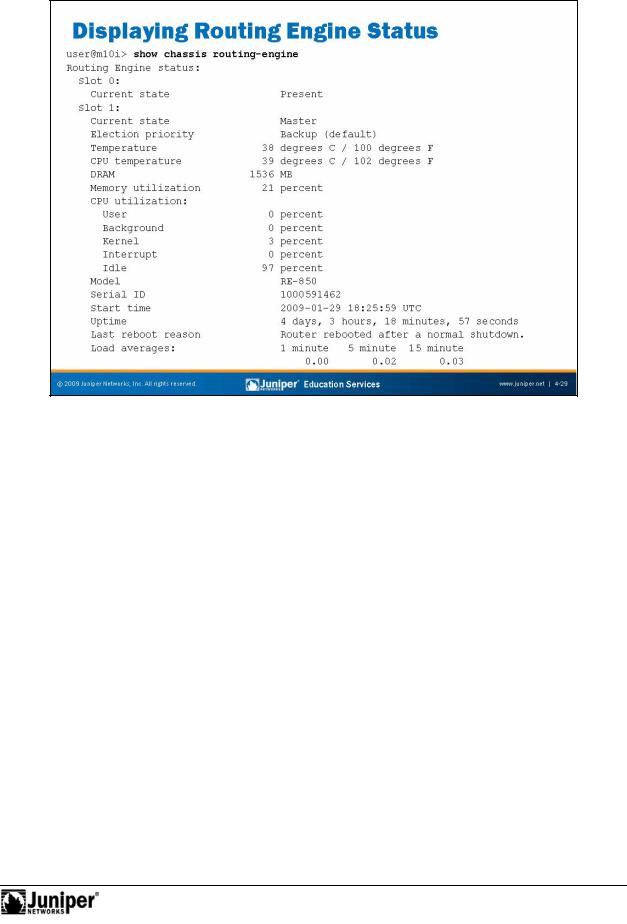
Displaying Routing Engine Status
The show chassis routing-engine command displays information about the Routing Engine. The following are the output fields:
|
• |
Slot: Indicates the slot number for the RE systems that support RE |
||
|
|
redundancy; |
||
|
• |
Current state: Indicates the current state of the RE on systems that |
||
for |
Reproductionsupport RE redundancy; |
|||
• |
Election priority: Specifies election priority for the RE on systems |
|||
|
that support RE redundancy; |
|||
• |
Temperature: Displays the temperature of the air flowing past the RE; |
|||
• |
DRAM: Displays the total DRAM available to the RE’s processor; |
|||
• |
CPU utilization: Displays information about the RE’s CPU |
|||
|
||||
|
|
utilization, which include the following: |
||
|
|
– |
User: Displays the percentage of CPU time in use by user |
|
|
|
|
processes; |
|
– Background: Displays the percentage of CPU time in use by background processes;
– Kernel: Displays the percentage of CPU time in use by kernel processes;
Continued on next page.
JUNOS Platforms Hardware Troubleshooting • Chapter 4–29

Troubleshooting JUNOS Platforms
Displaying Routing Engine Status (contd.)
– Interrupt: Displays the percentage of CPU time in use by interrupt processes; and
– Idle: Displays the percentage of CPU time that is idle.
• Model: Displays the RE model;
• Serial ID: Provides the identification number of the RE in this slot for systems that support RE redundancy;
• Start time: Displays the time at which the Routing Engine started running;
• Uptime: Displays how long the Routing Engine has been runn ng;
• Last reboot reason: Provides a reason for the last reboo ; and
• Load averages: Displays the Routing Engine load averages for the last 1, 5, and 15 minutes.
For systems with redundant REs installed, you can specify the RE slot number or see information about all REs installed in the system, as in the following example taken from an M320 platform:
user@host> show chassis routing-engine |
|
|
|||
Routing Engine status: |
|
|
|
|
|
Slot 0: |
|
|
Master |
|
|
Current state |
|
|
|
||
Election priority |
44 |
Master (default) |
|
||
Temperature |
degrees C / 111 degrees F |
||||
CPU temperature |
51 |
gr s C / 123 degrees F |
|||
DRAM |
|
3584 |
MB |
|
|
Memory utilization |
11 |
p rc nt |
|
|
|
CPU utilization: |
0 |
percent |
|
|
|
User |
|
|
|
||
Background |
0 |
percent |
|
|
|
Kernel |
3 |
percent |
|
|
|
Interrupt |
0 |
percent |
|
|
|
Idle |
|
97 |
percent |
|
|
Model |
|
Reproduction |
|||
ID |
|
RE-A-2000 |
|
|
|
Serial |
|
1000702757 |
|
|
|
Start |
ime |
|
2009-02-06 07:56:24 PST |
||
Uptime |
|
|
11 days, 1 hour, 20 minutes, 36 seconds |
||
Last reboot reason |
|
Router rebooted after a normal shutdown. |
|||
L ad averages:for |
|
1 minute |
5 minute |
15 minute |
|
Not |
|
0.00 |
0.05 |
0.05 |
|
|
|
|
|
||
Chapter 4–30 • JUNOS Platforms Hardware Troubleshooting

Troubleshooting JUNOS Platforms
Displaying Routing Engine Status (contd.)
Routing Engine status: |
|
|
Slot 1: |
|
Backup |
Current state |
|
|
Election priority |
47 |
Backup (default) |
Temperature |
degrees C / 116 degrees F |
|
CPU temperature |
59 |
degrees C / 138 degrees F |
DRAM |
Reproduction |
|
3584 |
MB |
|
Memory utilization |
13 |
percent |
CPU utilization: |
47 |
percent |
User |
||
Background |
0 |
percent |
Kernel |
24 |
percent |
Interrupt |
1 |
percent |
Idle |
29 |
percent |
Model |
|
RE-A-2000 |
Serial ID |
|
1000699981 |
Start time |
|
2008-12-30 16:07:53 PST |
Uptime |
|
48 days, 17 ho rs, 9 min tes, 2 seconds |
Last reboot reason |
|
0x1:power cycle/fail re |
Use the show chassis uting-engine bios command to display the revision level of the RE’s BIOS:
user@host> show chassis routing-engine bi s
Routing Engine BIOS Version: 1.5
Not |
for |
|
JUNOS Platforms Hardware Troubleshooting • Chapter 4–31
Troubleshooting JUNOS Platforms
Not
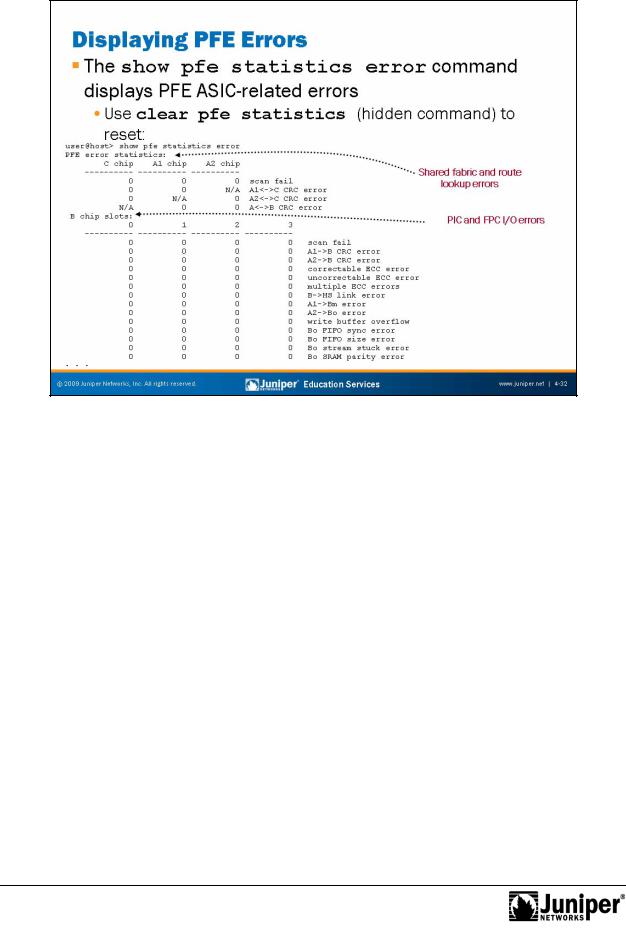
The show pfe statistics rror command displays information about errors that might occur within the PFE’s application-specific integrated circuits (ASIC) or internal communications paths. To clea PFE statistics, use the CLI’s hidden clear
forpfe statistics command.
The slide p ovides a sample display for error statistics taken from an M10i platform.
Displaying PFEReproductionErrors
The key eas n for issuing the show pfe statistics error command is to determine if a system has a chronic error condition versus a transient burst of errors, as might be caused by incorrect FPC removal. Put another way, PFE errors are primarily c ncern when you observe the error counts to be incrementing when the system is in an otherwise stable state (for example, you are not removing or inserting any FRUs.
Chapter 4–32 • JUNOS Platforms Hardware Troubleshooting
Not
Troubleshooting JUNOS Platforms
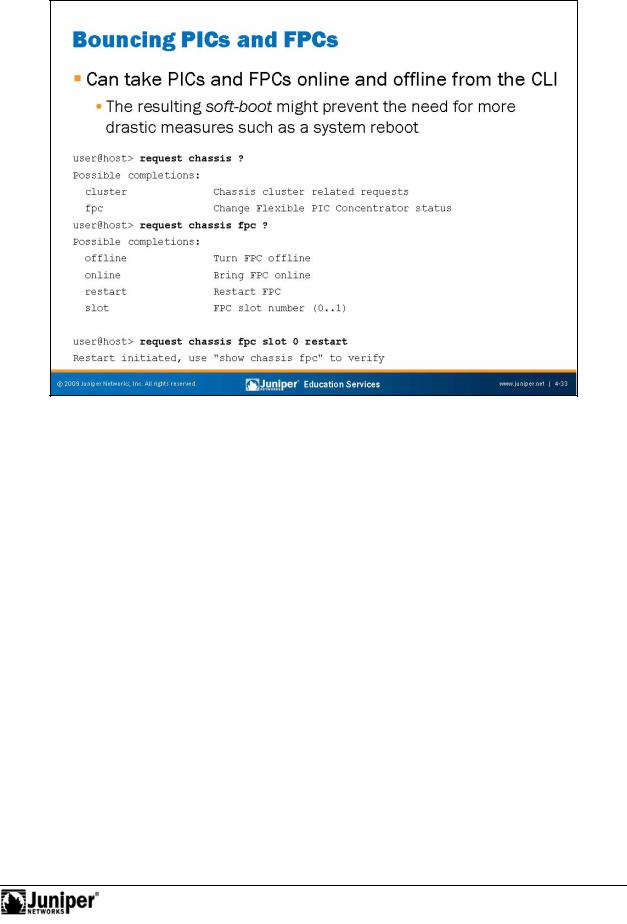
You can restart or take an FPC online and offline from the CLI with a request chassis fpc slot-number [restart | online | offline] command. Similarly, a PIC can be bounced with a request chassis pic fpc-slot slot-number pic-slot slot-number [online | offline] command. The
forexample illustrates the basic CLI syntax for restarting the FPC in slot 0. In some cases, bouncing an FPC or a problematic PIC might alleviate the need for more drastic
RestartingReproductionHardware Com onents
acti ns like a system reboot. The following capture shows the result of restarting an FPC as it progresses through the offline, present, and online status through the utput of a series of show chassis fpc commands:
Continued on next page.
JUNOS Platforms Hardware Troubleshooting • Chapter 4–33

Troubleshooting JUNOS Platforms
Restarting Hardware Components (contd.)
user@host> show chassis fpc |
CPU Utilization (%) |
Memory |
Utilization (%) |
||||
Slot |
State |
Temp |
|||||
(C) |
Total |
Interrupt |
DRAM (MB) Heap |
Buffer |
|||
0 |
Offline |
---Restarted by cli command--- |
2 |
49 |
|||
1 |
Online |
37 |
1 |
0 |
1024 |
||
2 |
Online |
38 |
1 |
0 |
1024 |
2 |
49 |
3 |
Online |
40 |
1 |
0 |
1024 |
2 |
49 |
4 |
Online |
39 |
1 |
0 |
1024 |
2 |
49 |
5Empty
6Empty
7Empty
user@host> show chassis fpc |
CPU Utilization (%) |
Memory |
Utiliza ion (%) |
||||
Slot |
State |
Temp |
|||||
(C) |
Total |
Interrupt |
DRAM (MB) Heap |
Buffer |
|||
0 |
Present |
39 |
1 |
0 |
1024 |
2 |
49 |
1 |
Online |
37 |
|||||
2 |
Online |
38 |
1 |
0 |
1024 |
2 |
49 |
3 |
Online |
40 |
1 |
0 |
1024 |
2 |
49 |
4 |
Online |
39 |
1 |
0 |
1024 |
2 |
49 |
5 |
Empty |
|
Reproduction |
||||
7 |
Empty |
|
|||||
6 |
Empty |
|
|
|
|
|
|
7 |
Empty |
|
|
|
|
|
|
user@host> show chassis fpc |
CPU Utilization (%) |
Memory |
Utilization (%) |
||||
Slot |
State |
Temp |
|||||
(C) |
Total |
Int rru |
DRAM (MB) Heap |
Buffer |
|||
0 |
Online |
37 |
0 |
0 |
0 |
0 |
0 |
1 |
Online |
37 |
1 |
0 |
1024 |
2 |
49 |
2 |
Online |
38 |
1 |
0 |
1024 |
2 |
49 |
3 |
Online |
40 |
1 |
0 |
1024 |
2 |
49 |
4 |
Online |
39 |
1 |
0 |
1024 |
2 |
49 |
5 |
Empty |
for |
|
|
|
|
|
6 |
Empty |
|
|
|
|
|
|
|
|
|
|
|
|
||
Not |
|
|
|
|
|
|
|
Chapter 4–34 • JUNOS Platforms Hardware Troubleshooting