

3troubleshootingjunos
.pdfTroubleshooting JUNOS Platforms
Process and Miscellaneous Log Files (contd.)
Not
• |
dcd: The device control process communicates with the Packet |
||
|
Forwarding Engine (PFE) to track the status and condition of the router's |
||
|
interfaces. The dcd configures interfaces on the basis of information in |
||
|
the configuration file and the hardware present in the device. You can |
||
|
configure physical interfaces before the hardware is present; likewise, a |
||
|
router can contain unconfigured FPCs and PICs. Check the dcd log for |
||
Reproduction |
|||
|
interface-related entries when troubleshooting interface problems. |
||
• |
eccd: The error correction control process deals with memory errors. If |
||
|
you suspect bad or failing memory, check this l g. |
||
• |
mastership: The mastership log records even s related to hardware |
||
|
redundancy. |
|
|
• |
mgdd: The management process controls he CLI process. No log file |
||
|
associated with this process exists. |
||
• |
sampled: The sampling process handles tasks related to packet |
||
|
sampling. Check this log when tro bleshooting or monitoring a sampling |
||
|
configuration. |
|
|
• |
snmpd: The SNMP process han |
les tasks related to SNMP. Check this |
|
|
log when troublesh |
ting r m |
nitoring SNMP. Note that wherever |
|
possible, the SNMP ifIndex values are persistent across reboots or in |
||
|
the event of ha dwa e additi ns and deletions that result from PIC or FPC |
||
|
insertion and em |
val. This persistence is the default behavior and is |
|
|
achieved by sto ing SNMP indexes in the /var/db/dcd.snmp ix file. |
||
• |
vrr : The virtual router redundancy protocol (VRRP) process handles |
||
|
the activiti s r lated to this protocol. Check this log when troubleshooting |
||
|
or monitoring VRRP. |
|
|
Entries Also Written to the Main Syslog File
forThe ent ies written to individual process log files also write into the main syslog file (messages). Generally speaking, you begin by analyzing the messages file for signs
t uble. Once you identify trouble relating to a particular process, you can parse or m nitor the files of that process to reduce the amount of information through which y u must wade.
Troubleshooting Tool Kit for JUNOS Platforms • Chapter 3–35
Troubleshooting JUNOS Platforms
Not
Interpreting Syst m Log Entri s
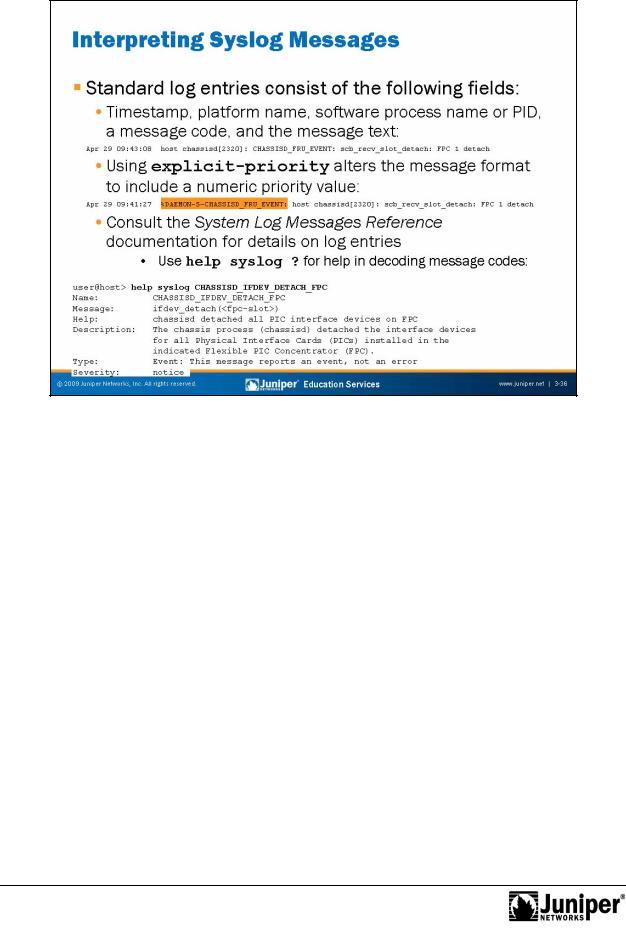
When using the standard syslog format, each log entry written to the messages file consists of the following fi lds:
• |
timestamp: Time of logging the message. |
|
• |
name: The configured system name. |
|
• |
P ocess name or PID: The name of the process (or the Process ID [PID] |
|
|
|
Reproduction |
|
when a name is not available) that generated the log entry. |
|
• |
message-code: A code that identifies the general nature and purpose of |
|
|
the message. In the example shown, the message code is |
|
|
CHASSISD_IFDEV_DETACH_FPC: ifdev_detach(1). |
|
• |
message-text: Additional information related to the message code. |
|
for |
|
|
When you add the explicit-priority statement, the syslog message format alters to include a numeric priority value. In this case the value 0 is for the most significant and urgent messages (emergency), while 7 denotes debug level messages.
Consult the System Log Messages Reference documentation for a full description of the various message codes and their meanings—better yet, use the CLI’s help function to obtain this information. The example shows the operator obtaining help on the meaning of the CHASSISD_IFDEV_DETACH_FPC: ifdev_detach(1) message code. Based on the output, it becomes relatively clear that the message code relates to the chassisd processing disconnecting the interfaces associated with a given FPC, and that this process is considered an event rather than an error.
Chapter 3–36 • Troubleshooting Tool Kit for JUNOS Platforms
Not
Troubleshooting JUNOS Platforms
Hear TracingReproductionand Think Debug
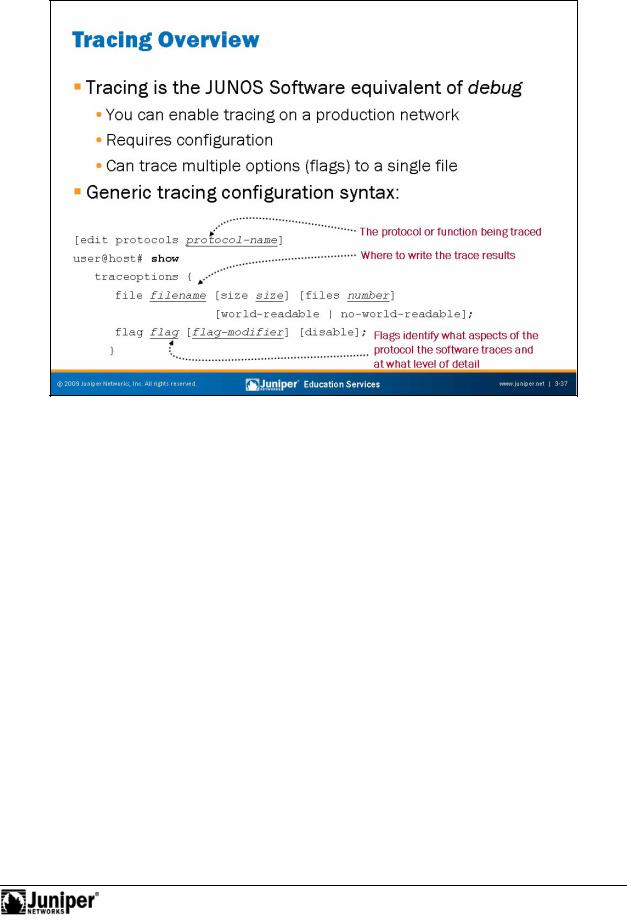
Tracing is the JUNOS Software term for what other vendors sometimes call debug. In most cases wh you nable tracing (through configuration), you create a trace file that stores decoded protocol information. You analyze these files using standard CLI
forlog file syntax like show log logfile-name. Because of the design of Juniper Netwo ks routing platforms, you can enable detailed tracing in a production network without significantly impacting performance. Even so, you should always remember to tu n t acing off once you complete your testing to avoid unnecessary resource
c nsumption.
Generic Tracing Configuration
The slide shows a generic tracing stanza that, if applied to the [edit protocols] portion of the configuration hierarchy, would result in tracing of the specified routing protocol’s events. Specified routing protocol tracing operations track the flagged routing operations and record them in the specified log file.
Continued on next page.
Troubleshooting Tool Kit for JUNOS Platforms • Chapter 3–37

Troubleshooting JUNOS Platforms
Generic Tracing Configuration (contd.)
The following are configuration options for tracing: |
|
|
• |
file filename: Specifies the name of the file in which to store |
|
|
information. |
|
• |
size size: Specifies the maximum size of each trace file, in kilobytes |
|
|
Reproduction |
|
|
(KB), megabytes (MB), or gigabytes (GB). When a trace file named |
|
|
trace-file reaches this maximum size, it receives compression a d |
|
|
is renamed trace-file.0.gz. When the trace file again reaches its |
|
|
maximum size, trace-file.0.gz is renamed trace-file.1.gz, |
|
|
and trace-file is compressed and renamed trace-f le.0.gz. |
|
|
This renaming scheme continues until it reaches the max mum number |
|
|
of allowable trace files. The software then overwrites he |
ldest race file. |
|
If you do not specify a maximum number of tra e files w |
h he f les |
|
option, the default number of files to keep is ten. If you spe ify a |
|
|
maximum file size, you also must specify a maximum number of trace |
|
|
files with the files option. You can se xk, xm, or xg to specify |
|
|
kilobytes, megabytes, or gigabytes, respectively. The default range is |
|
|
128 KB. |
|
• |
flag flag: Specifies a tracing operation to perform. You can specify |
|
|
multiple flags. |
|
• |
files number: Specifies the maximum number of trace files. When a |
|
|
trace file named trace-file eaches its maximum size, JUNOS |
|
|
Software renames it ace-file.0, then trace-file.1, and so |
|
|
forth, until it reaches the maximum number of trace files. The software |
|
|
then ov rwrit s the old st trace file. The default is ten files. |
|
Including the traceoptions stat m |
nt at the [edit interfaces |
interface-name] hi rarchy l v |
l allows you to trace the operations of individual |
router interfaces. You can also trace the operations of the interface process, which is |
|
the device control process. |
|
for |
|
When t acing a specific interface, the software does not support the specification of a |
|
trace file. The JUNOS Software kernel does the logging in this case, so the software |
|
places the t acing information in the system’s messages file. In contrast, global |
|
inte face t acing supports an archive file; by default it uses /var/log/dcd for global |
|
inter ace tracing. |
|
Not |
|
Chapter 3–38 • Troubleshooting Tool Kit for JUNOS Platforms
Troubleshooting JUNOS Platforms
ProtocolReprTracing oduction
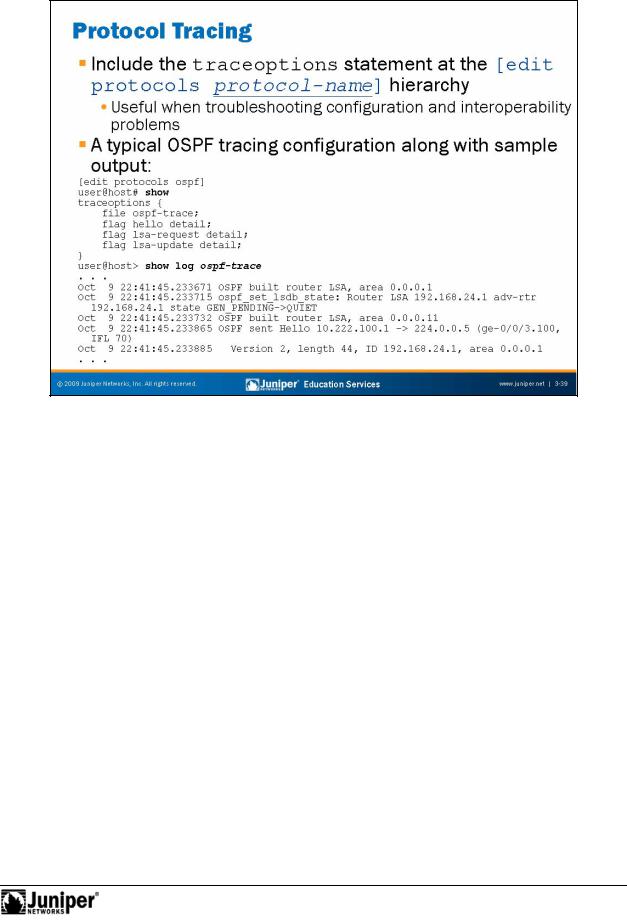
You trace the op rations of a specific protocol by including the traceoptions statement at the [ dit protocols protocol-name] hierarchy. In most cases you should be selective in what you trace because selecting the all keyword can ove whelm you with endless minutia. The sample OSPF stanza the slide reflects a typical t acing configuration that provides details about important events like hello message or OSPF link-state advertisement (LSA) details. In most cases you should use the detail switch with a given protocol flag for the added information often needed in tr ubleshooting scenarios.
|
Sample Output |
for |
|
Not |
|
The slide shows a sampling of the results obtained with the tracing configuration. As with any log file, you simply enter a show file trace-file-name command to view the decoded protocol entries. The sample trace output reflects the receipt of an OSPF hello message from 10.222.100.1 and goes on to show some of the hello protocol parameters.
Troubleshooting Tool Kit for JUNOS Platforms • Chapter 3–39
Troubleshooting JUNOS Platforms
Jan 7 |
|
18:22:40 Parsing c nfigReproductionfile |
|
|
|
|
|
||||
|
|
Viewing Logs and Trac |
s |
||
|
|
By default, log and trace fil |
s are stored in /var/log. To view stored log files, use |
||
|
|
the command show log. |
call that the CLI automatically pauses when it has more |
||
|
than one screen’s worth of information, and that at this more prompt, you can enter a |
||
Display hisforwahelp text: |
h |
||
|
d slash (/) character to conduct a forward search. As a hint, enter h when at a |
||
|
mo e p ompt for a context help screen of available commands: |
||
---(Help for CLI aut m |
e)--- |
c or C |
|
Clear all match and except strings: |
|||
Display all line matching a regexp: |
m or M <string> |
||
Not |
|
e or E <string> |
|
Display all lines except those matching a regexp: |
|||
D n't h ld in automore at bottom of output: |
N |
||
H ld in au |
more at bottom of output: |
H |
|
M ve d wn half display: |
TAB, d, or ^D |
||
M ve d wn |
ne line: |
Enter, j, ^N, ^X, ^Z, or Down-Arrow |
|
Chapter 3–40 • Troubleshooting Tool Kit for JUNOS Platforms

Troubleshooting JUNOS Platforms
Viewing Logs and Traces (contd.)
|
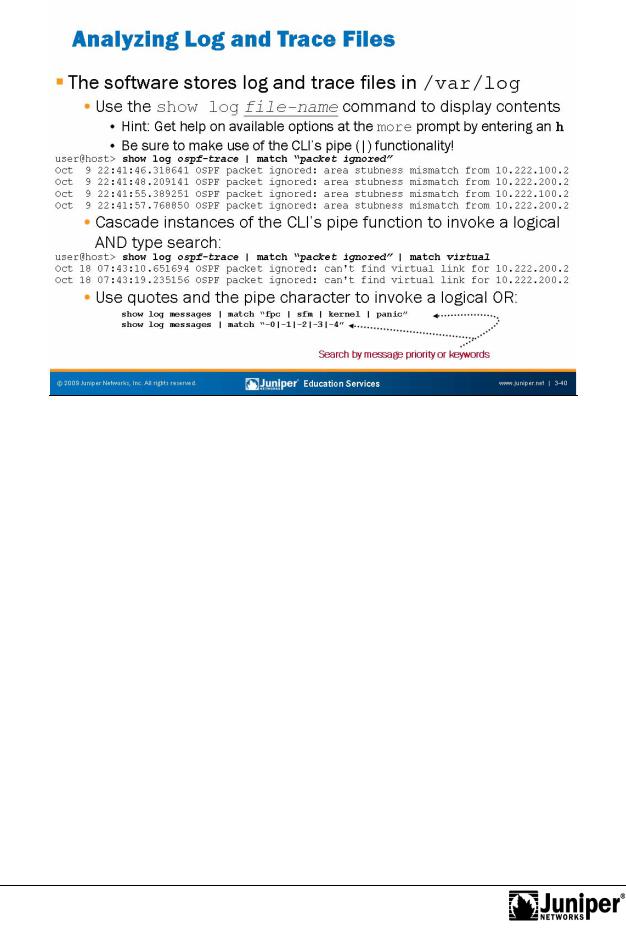
Being able to cascade multiple instances of the CLI’s pipe functionality is a real |
|
|
benefit when you must search a long file for associated entries. In the example, the |
|
|
match function cascades so that only lines containing the words packet ignored |
|
|
and virtual are displayed; this cascading creates a logical AND type matching |
|
|
function. Being able to search for multiple criteria in a logical OR fashion is extremely |
|
|
handy, especially when you are not quite sure what it is that you are seeking. The slide |
|
|
provides two examples of a logical OR search. The basis for the former is |
|
|
human-readable keywords while the latter makes use of explicit message priority |
|
|
codes to display all messages ranging from level 0 (emergency) to level 4 (war i g). |
|
|
Note that searching by messag priority requires enabling sysl g pr r ty with the |
|
|
explicit-priority keyword. |
|
|
for |
Reproduction |
Not |
|
|
|
|
|
Troubleshooting Tool Kit for JUNOS Platforms • Chapter 3–41
Troubleshooting JUNOS Platforms
|
|
|
Reproduction |
|
|
|
|
|
|
||
|
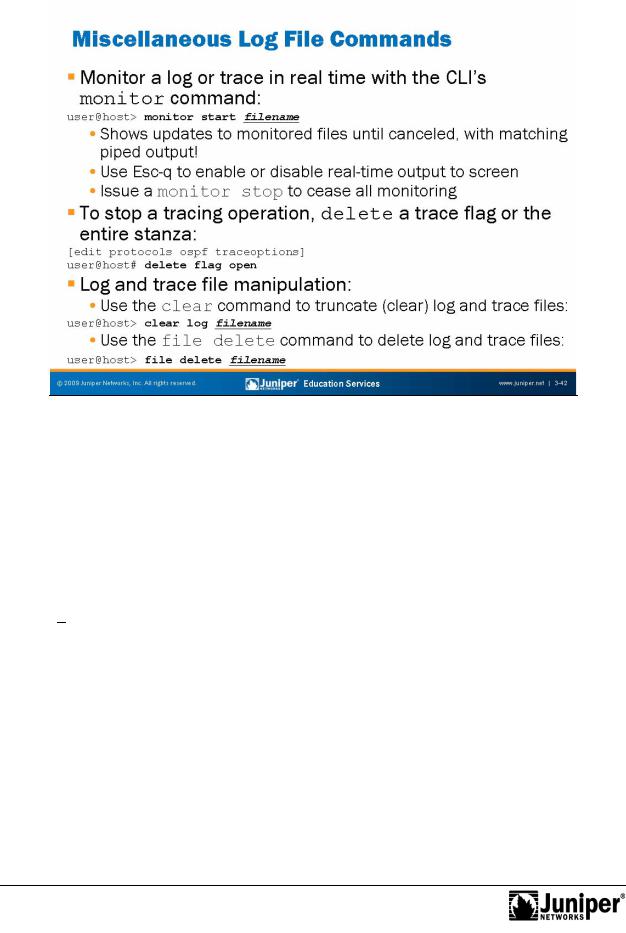
Monitoring Logs and Trace Fil s |
||||
|
Use the monitor CLI command to view real-time log information. You can monitor |
||||
|
several log files at one time. You can identify the messages from each log by |
||||
|
filename, where filename is the name of the file that displays entries. This line |
||||
|
displays initially and when the CLI switches between log files. |
||||
|
for |
|
|
|
|
|
Using Esc+q enables and disables syslog output to screen; using monitor stop |
||||
|
ceases all m nito ing. Note that you can us the CLI’s match functionality to monitor a |
||||
|
ile in |
eal time, while displaying only entries that match your search criteria. To make |
|||
|
use |
the functionality, use a command in the following form: |
|||
Not |
start messages | match fail |
||||
lab@San Jose> m ni |
|||||
Stopping Tracing Through Configuration
If you do not delete or disable all trace flags, tracing continues in the background, and the output continues to write to the specified file. The file remains on the Routing Engine hard disk until it is either deleted manually or overwritten according to the traceoptions file parameters. To disable all tracing at a particular hierarchy, issue a delete traceoptions command at that hierarchy and commit the changes.
Continued on next page.
Chapter 3–42 • Troubleshooting Tool Kit for JUNOS Platforms

Troubleshooting JUNOS Platforms
Log and Trace File Manipulation
To truncate files used for logging, use the clear log filename command. To delete a file, use the file delete command. You can also use wildcards with delete, compare, copy, list, and rename operations.
|
for |
Reproduction |
Not |
|
|
|
|
Troubleshooting Tool Kit for JUNOS Platforms • Chapter 3–43
Troubleshooting JUNOS Platforms
|
|
|
Reproduction |
|
|
|
|
|
|
||
|
|
Troubleshooting Tools: Int ractive UNIX Shell |
|||
|
|
The slide highlights the topic we discuss next. |
|||
Not |
for |
|
|
|
|
|
|
|
|
||
Chapter 3–44 • Troubleshooting Tool Kit for JUNOS Platforms