

3troubleshootingjunos
.pdfTroubleshooting JUNOS Platforms
|
|
•ReproductionItem: Shows information for the chassis component about the |
|
|
|
|
|
|
|||
|
|
Displaying Chassis Inv ntory |
|||
|
|
The output of the show chassis hardware command displays the hardware |
|||
|
|
components install in the platform. This command is useful when troubleshooting |
|||
|
|
or upgrading your device. The (edited) sample shown on the slide is from a T640 |
|||
|
|
outer with redundant Routing Engines (RE). |
|||
|
|
The following are the show chassis hardware command output fields: |
|||
|
|
|
backplane, the power supplies, the maxicab (the connection between the |
||
|
|
|
Routing Engine and the backplane), the System Control Board (SCB), and |
||
Not |
|
each of the FPCs and their PICs. |
|||
|
Version: Displays the revision level of the chassis component. |
||||
|
for• |
||||
|
|
• |
Part number: Displays the part number of the chassis component. |
||
|
|
• |
Serial number: Displays the serial number of the chassis component. |
||
|
|
|
The serial number of the backplane is also the serial number of the |
||
|
|
|
router chassis. |
||
|
|
• |
Description: For the power supplies, it displays the type of supply; for |
||
|
|
|
the PICs, it displays the type of PIC. |
||
Continued on next page.
JUNOS Platforms Hardware Troubleshooting • Chapter 4–15

Troubleshooting JUNOS Platforms
Displaying Chassis Inventory (contd.)
JUNOS Software has a show chassis hardware clei-models command. The output from this command provides information in a format suitable for conducting inventory. The clei-models option means Common Language Equipment Identifier Code barcode and model number for orderable field-replaceable units (FRUs). The following sample output is from an M320 router:
|
|
|
Reproduction |
|
user@host> show chassis hardware clei-models |
|
|||
Hardware inventory: |
Part number CLEI code |
FRU model number |
||
Item |
Version |
|||
Midplane |
REV 07 |
710-009120 |
CHAS-BP-M320-S |
|
FPM Display |
REV 05 |
710-009351 |
CRAFT-M320-S |
|
CIP |
REV 05 |
710-005926 |
CIP-M320-S |
|
PEM 0 |
Rev 05 |
740-009149 |
PWR-M-AC-S |
|
PEM 1 |
Rev 05 |
740-009149 |
PWR-M-AC-S |
|
PEM 2 |
Rev 05 |
740-009149 |
PWR-M-AC-S |
|
PEM 3 |
Rev 05 |
740-009149 |
PWR-M-AC-S |
|
Routing Engine 0 REV 07 |
740-014082 |
RE-A-2000-4096-S |
||
Routing Engine 1 REV 07 |
740-014082 |
RE-A-2000-4096-S |
||
. . . |
|
|
|
|
Not |
for |
|
|
|
|
|
|
|
|
Chapter 4–16 • JUNOS Platforms Hardware Troubleshooting
Troubleshooting JUNOS Platforms
|
|
Reproduction |
|
|
||
|
|
|
||||
|
|
Listing Alarm Conditions |
||||
|
|
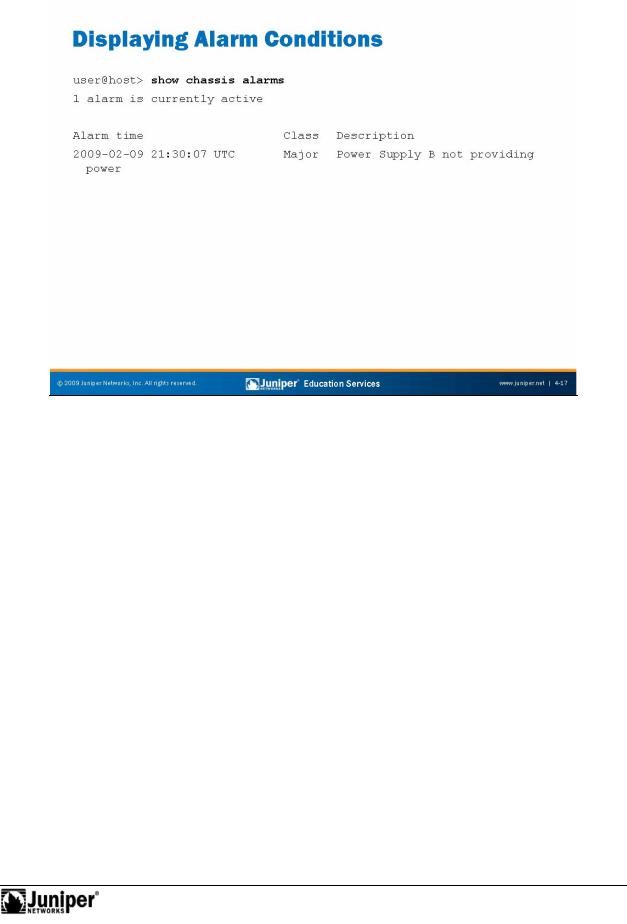
The show chassis alarms command lists all of the alarm conditions that |
||||
|
|
currently exist in the vice. You can disable some alarms; however, you cannot |
||||
|
|
disable safety-related and chassis component alarms. |
||||
|
for |
|
|
|
||
|
|
P essing the alarm cutoff (ACO) button, located on the Craft Interface, manually |
||||
|
|
silences the alarm to an external device connected to the alarm relay, but it does not |
||||
|
|
em ve the alarm messages from the display (if present on the device) nor does it |
||||
|
|
extinguish the alarm LEDs. In addition, new alarms that occur after silencing an |
||||
|
|
external device reactivate the external device. |
||||
Not |
The llowing are the show chassis alarms output fields: |
|||||
• |
Alarm time: Displays the date and time of the alarm; |
|||||
|
|
|||||
|
|
• |
Class: Displays the severity class for this alarm (it can be minor or |
|||
|
|
|
major); and |
|||
|
|
• |
Description: Displays information about the alarm. |
|||
JUNOS Platforms Hardware Troubleshooting • Chapter 4–17
Troubleshooting JUNOS Platforms
|
|
|
OK,ReproductionTesting (during initial power-on), Failed, or Absent. For |
|
the |
|
|
|
|
|
|||
|
|
Displaying Environm ntal Information |
||||
|
|
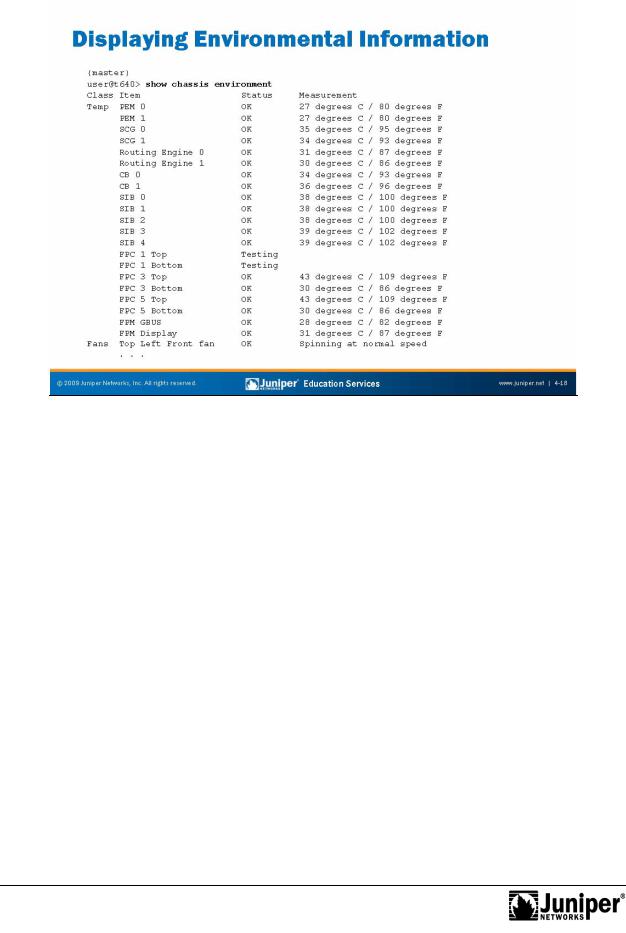
The show chassis |
nvironm nt command displays environmental information |
|||
|
|
about the device chassis, including the temperature, and information about the fans, |
||||
|
|
power supplies, and |
outing Engine. The truncated example is from a T640 platform. |
|||
|
|
The following a e the output fields: |
||||
|
|
• |
Power: Displays information about each power supply. The status can be |
|||
|
|
|
M120, M320, and T Series platforms, information displays about the |
|||
|
|
|
PEM. |
|
|
|
Not |
• |
Temp: Displays the temperature of air flowing through the chassis. |
||||
|
|
|
|
|
||
|
for• Fans: Displays information about the fans. The status can be OK, |
|||||
|
|
|
Testing (during initial power-on), Failed, or Absent. Measurement |
|||
|
|
|
indicates whether the fans are spinning at normal or high speed. |
|||
|
|
• |
Other: Depending upon the platform, various other fields might be |
|||
|
|
|
present. For example, for T Series platforms, the display includes |
|||
|
|
|
information on the SONET Clock Generator (SCG), Control Board (CB), |
|||
|
|
|
SIBs, the Switch Processor Mezzanine Board (SPMB) and the Connector |
|||
|
|
|
Interface Panel (CIP). The sample on the slide does not show these fields. |
|||
Chapter 4–18 • JUNOS Platforms Hardware Troubleshooting
Troubleshooting JUNOS Platforms
|
|
|
Reproduction |
|
|
|
|
|
|
||
|
|
CPU Temp rature |
|||
|
|
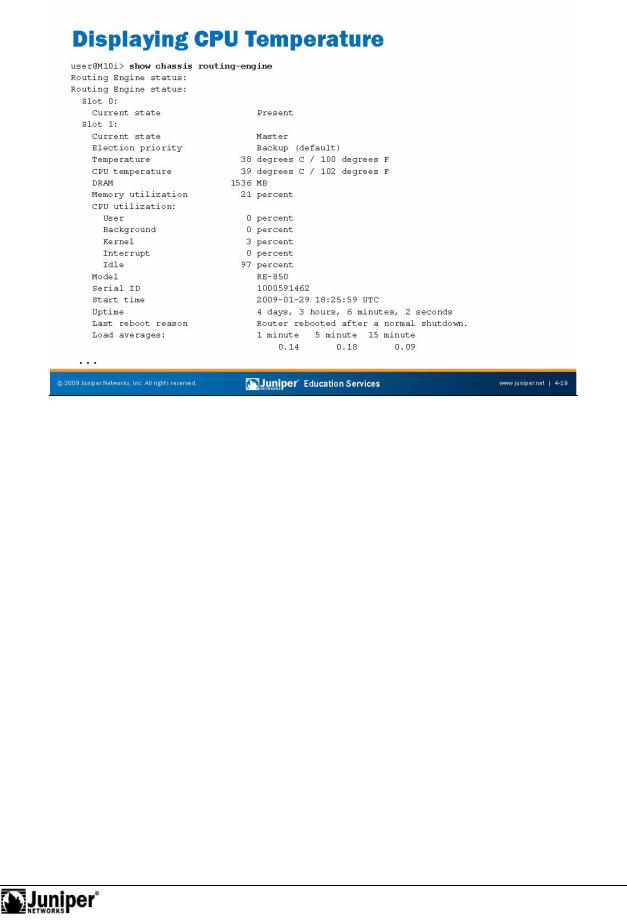
In addition to the ambi nt t mperature surrounding the system components, you can |
|||
|
|
see the actual CPU mp rature of the Routing Engine. |
|||
Not |
for |
|
|
|
|
|
|
|
|
||
JUNOS Platforms Hardware Troubleshooting • Chapter 4–19
Troubleshooting JUNOS Platforms
Not
Displaying Craft Int rface
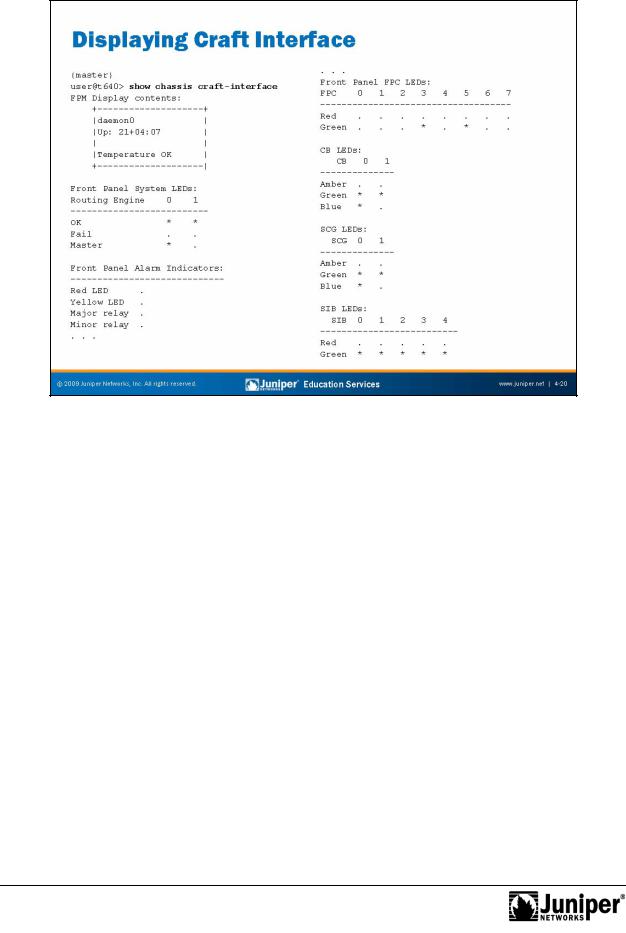
The show chassis craft-int rface command shows all current messages. The capture shown is from a T640. Output fields include the following:
• |
FPM Display contents: Displays contents of the Front Panel |
|
|
Module display. |
|
• |
|
outer-name: Shows the name of the router. |
• |
|
Reproduction |
Up: Shows how long the router has been operational in days, hours, |
||
|
minutes, and seconds. |
|
• |
message: Displays information about the router traffic load, the power |
|
|
supply status, the fan status, and the temperature status. The display of |
|
|
this information changes every 2 seconds. |
|
for |
|
|
• |
Front Panel System LEDs: Displays the status of the Front Panel |
|
|
System LEDs. A dot (.) indicates the LED is not lit. An asterisk (*) |
|
|
indicates that the LED is lit. |
|
• |
Front Panel Alarm Indicators: Displays the status of the Front |
|
|
Panel Alarm Indicators. A dot indicates the relay is off. An asterisk |
|
|
indicates that the relay is active. |
|
Continued on next page.
Chapter 4–20 • JUNOS Platforms Hardware Troubleshooting

Troubleshooting JUNOS Platforms
Displaying Craft Interface (contd.)
•Front Panel FPC LEDs: Displays the status of the Front Panel FPC LEDs. A dot indicates the LED is not lit. An asterisk indicates that the LED is lit.
Not |
for |
|
•MCS, SFM, SCG, CB, and SIB LEDs: Displays the status of the
ReproductionMIscellaneous Control Subsystem (MCS), SCG, CB, Switching and Forwarding Module (SFM), and SIB LEDs as supported by a given
platform. A dot indicates that the LED is not lit. An asterisk i dicates that the LED is lit. When neither a dot no an asterisk displays, o board is present in that slot.
JUNOS Platforms Hardware Troubleshooting • Chapter 4–21
Troubleshooting JUNOS Platforms
|
|
|
Reproduction |
|
|
|
|
|
|
||
|
|
Displaying System Control Board Status |
|||
|
|
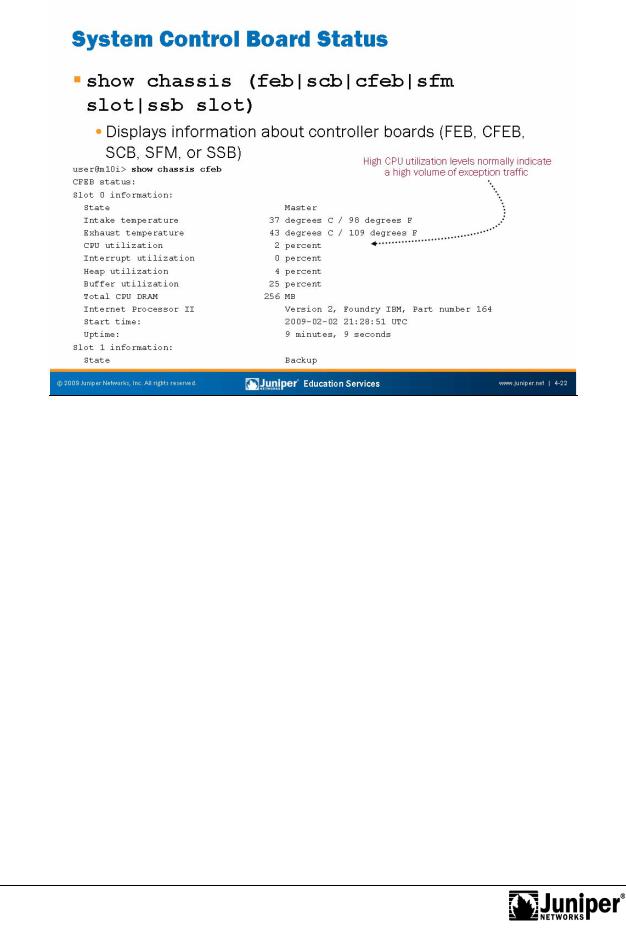
The show chassis (f b | scb | | cfeb | sfm slot | ssb slot ) |
|||
|
|
command displays information about the system controller boards—either Forwarding |
|||
|
|
Engine Board (FEB), Compact Forwarding Engine Board (CFEB), SCB, SFM, or System |
|||
|
|
and Switch Boa (SSB). The following are the output fields: |
|||
|
|
• |
Intake temperature: Displays the temperature of the air passing by |
||
|
|
|
the controller in both Celsius and Fahrenheit; |
||
|
|
• |
Exhaust temperature: Displays the temperature of the air flowing |
||
|
|
|
past the exhausts; |
||
|
|
• |
CPU utilization: Displays the total percentage of the CPU used by |
||
|
forthe controller’s processor; |
||||
Not |
• |
Interrupt utilization: Out of the total CPU percentage in use by |
|||
|
the controller’s processor, displays the percentage in use for interrupts; |
||||
• |
Heap utilization: Displays the percentage of heap space in use by |
||||
|
the controller’s processor; |
||||
• |
Buffer utilization: Displays the percentage of buffer space in use |
||||
|
by the controller’s processor; |
||||
• |
DRAM: Displays the total DRAM available to the controller’s processor; |
||||
Continued on next page.
Chapter 4–22 • JUNOS Platforms Hardware Troubleshooting

Troubleshooting JUNOS Platforms
Displaying System Control Board Status (contd.)
•Start time: Displays the time when the controller started running; and
•Uptime: Displays how long the controller has been running.
Because the controller board CPU is not involved in actual packet forwarding, you
should expect to see a very low level of CPU utilization in most cases. Aside from hardwareReproductionand environmental monitoring, the controller board CPU is primarily for
processing exception traffic. This traffic tends to take the form of Packet Forwardi g
Engine (PFE)-generated ICMP error messages or traffic that requires directi |
to the |
host RE for processing. Examples of exception traffic include Internet C tr |
l Message |
Protocol (ICMP) echo exchanged packets with expired time l ve (TTL), which is one of the IP options, or traffic that is sampled or counted (or bo h) as part f a firewall filter.
Not |
for |
|
JUNOS Platforms Hardware Troubleshooting • Chapter 4–23
Troubleshooting JUNOS Platforms
Not
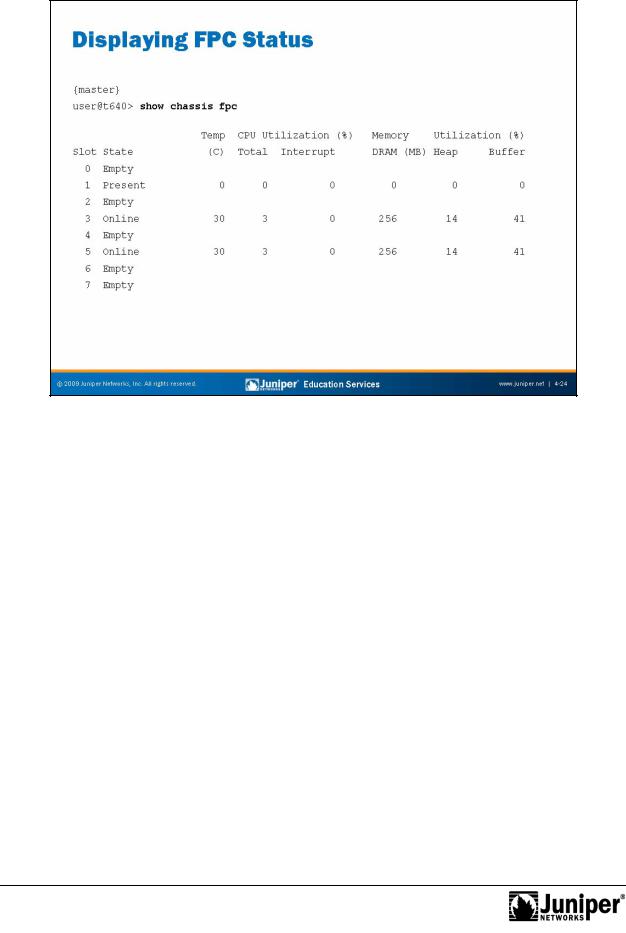
Displaying FPC Status
The show chassis fpc command displays the status of the installed FPCs. The sample is from a T640 platform. Th following are the output fields:
• |
Slot: Displays the FPC slot number. |
• |
State: Displays the state of the FPC. |
• |
TempReproduction(C): Displays the temperature of the air passing by the FPC, in |
|
deg ees Celsius. |
• |
CPU Utilization (%): Displays the total percentage of CPU in use |
|
by the FPC’s processor. |
• |
Interrupt CPU Utilization (%): Of the total CPU percentage |
|
used by the FPC’s processor, displays the percentage in use for |
for |
|
|
interrupts. |
• |
Memory DRAM: Displays the total DRAM (in megabytes) available to the |
|
FPC’s processor. |
• |
Heap Utilization (%): Displays the percentage of heap space |
|
(dynamic memory) used by the FPC’s processor. If this number exceeds |
|
80%, it might indicate a software problem (a memory leak). |
• |
Buffer Utilization (%): Displays the percentage of buffer space |
|
used by the FPC’s processor for buffering internal messages. |
Chapter 4–24 • JUNOS Platforms Hardware Troubleshooting