

3troubleshootingjunos
.pdfTroubleshooting JUNOS Platforms
|
|
|
Reproduction |
|
|
|
|
|
|
|
|||
|
|
Network Utiliti s and A lications: Part 2 |
||||
|
|
JUNOS Software off rs support for Telnet, SSH or SCP, and FTP. As with the ping and |
||||
|
|
traceroute utiliti s, th se applications support switches that are useful in |
||||
|
|
troubleshooting. The following are some of the key switches: |
||||
|
|
for |
• |
no-resolve: This switch disables the normal reverse lookup |
||
|
|
|
performed the host address specified in a telnet command. Use |
|||
|
|
|
|
|||
|
|
|
|
this switch when sessions take a long time to open because of the |
||
|
|
|
|
inability to perform the reverse lookup. |
||
|
|
|
• |
port: The port switch allows you to specify a destination port other than |
||
Not |
|
|
the default port normally associated with that service. |
|||
|
• |
routing-instance: This switch supports VPN and routing instance |
||||
|
|
|
||||
|
|
|
|
context for applications like Telnet and FTP. A classic use would be to |
||
|
|
|
|
establish a Telnet connection from a provider edge (PE) router to an |
||
|
|
|
|
attached customer edge (CE) device, which, being part of a VPN, would |
||
|
|
|
|
reside in a specific routing table and instance. |
||
|
|
|
• |
source: As with ping, altering the source address used in a connection |
||
|
|
|
|
request might uncover problems with routing that prevent connection |
||
|
|
|
|
establishment when sourcing traffic from the egress interface (the |
||
|
|
|
|
default). |
||
Troubleshooting Tool Kit for JUNOS Platforms • Chapter 3–25
Troubleshooting JUNOS Platforms
|
|
Reproduction |
|
|
|
|
|
||
|
|
Network Utilities and A lications: Part 3 |
||
|
|
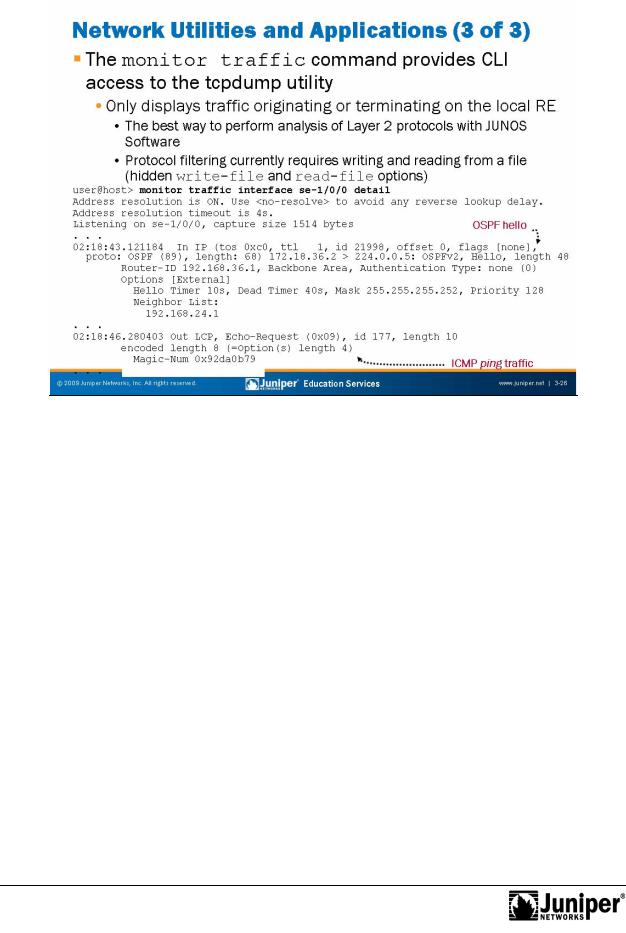
The monitor traffic command provides CLI-based access to the tcpdump utility. |
||
|
|
This command monitors only traffic originating or terminating local the RE. This |
||
|
|
capability is the best way to monitor and diagnose problems at Layer 2 with JUNOS |
||
|
for |
|||
|
|
Softwa e because tracing, which is similar to debug on equipment from other |
||
|
|
vendo s, does not function for Layer 2 protocols. We cover tracing subsequent |
||
|
|
pages that deal with system logging. |
||
|
|
N te that p t col filtering functions (for example, matching on only UDP traffic sent |
||
|
|
m a specific port) are currently not supported for real-time monitoring because in |
||
Not |
real-time m de, the Layer 2 headers are stripped at ingress, which prevents filtering |
|||
on protocol types. As a workaround, you can write the monitored traffic to a file and hen read the file with a tcpdump-capable application like Ethereal. We provide an example of how to achieve protocol filtering with the JUNOS Software monitor
raffic command in a subsequent case study.
Chapter 3–26 • Troubleshooting Tool Kit for JUNOS Platforms
Troubleshooting JUNOS Platforms
|
|
|
Reproduction |
|
|
|
|
|
|
||
|
|
Troubleshooting Tools: Th Craft Interface Panel |
|||
|
|
The slide highlights the topic we discuss next. |
|||
Not |
for |
|
|
|
|
|
|
|
|
||
Troubleshooting Tool Kit for JUNOS Platforms • Chapter 3–27
Troubleshooting JUNOS Platforms
|
|
Reproduction |
|
|
|
|
|
|
|||
|
The Craft Interface |
|
|
|
|
|
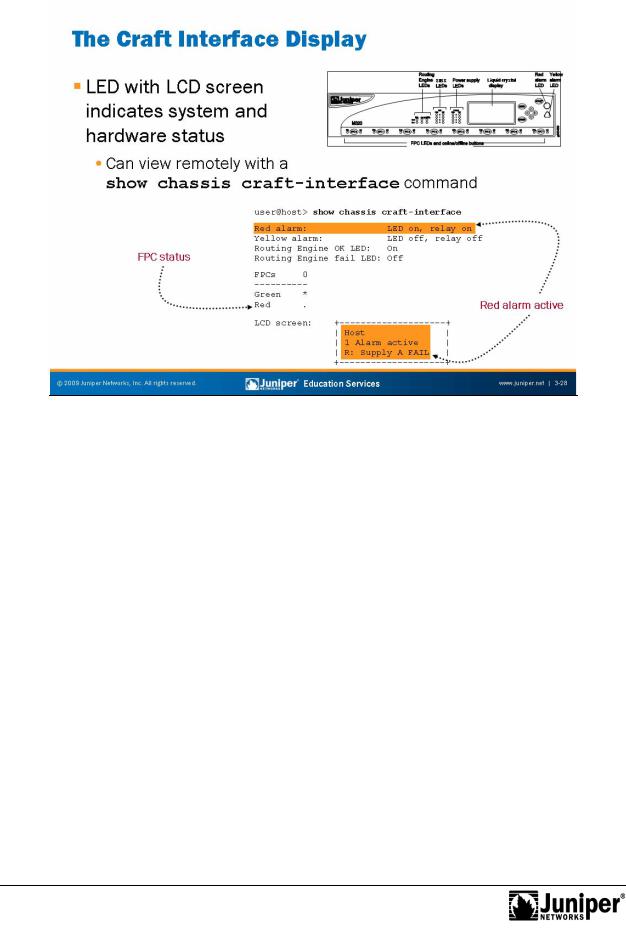
The craft interface pan l for syst |
ms that support the LCD status screen is an |
|||
|
excellent troubleshooting and op |
rational analysis tool because it provides |
|||
|
component and system alarm status in a manner that is easy to interpret. When |
||||
|
for |
|
|
|
|
|
wo king emotely you can issue a show chassis craft-interface command |
||||
|
to obtain an ASCII representation of the LEDs and messages that the craft interface |
||||
|
displays. |
|
|
|
|
Not |
|
|
|
|
|
Chapter 3–28 • Troubleshooting Tool Kit for JUNOS Platforms
Not
Troubleshooting JUNOS Platforms
Reproduction |
|
|
|
|
|||
Displaying M ssag s the LCD Screen |
|||
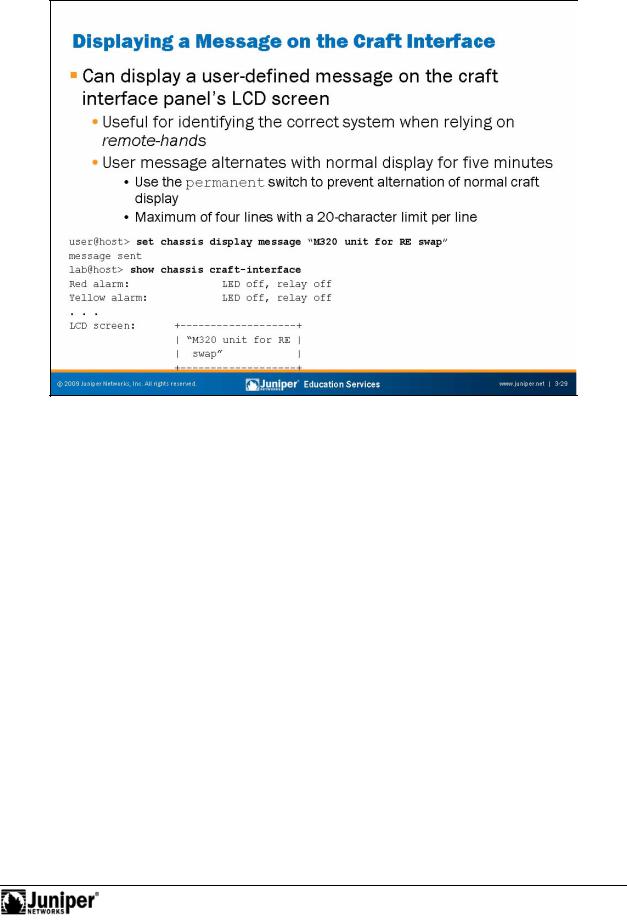
Displaying m |
ssag s the craft interface panel's LCD screen can be helpful when |
||
you want to id |
ntify a syst m or communicate in some way with a person that is local |
||
to that machine. By default, the custom user message alternates with the normal LCD
for |
|
message display (system status messages that alternate every few seconds). Use the |
|
pe manent switch with the set chassis display operational mode command |
|
to |
ce only the display of the custom message. |
N |
te that the custom message times out after five minutes, and the display returns to |
the default system status message rotation. This command is applicable only to platf rms that have an LCD screen.
Troubleshooting Tool Kit for JUNOS Platforms • Chapter 3–29
Troubleshooting JUNOS Platforms
|
|
|
Reproduction |
|
|
|
|
|
|
||
|
|
Troubleshooting Tools: Syst m Logs and Protocol Tracing |
|||
|
|
The slide highlights the topic we discuss next. |
|||
Not |
for |
|
|
|
|
|
|
|
|
||
Chapter 3–30 • Troubleshooting Tool Kit for JUNOS Platforms
Not
Troubleshooting JUNOS Platforms
SyslogReproduction
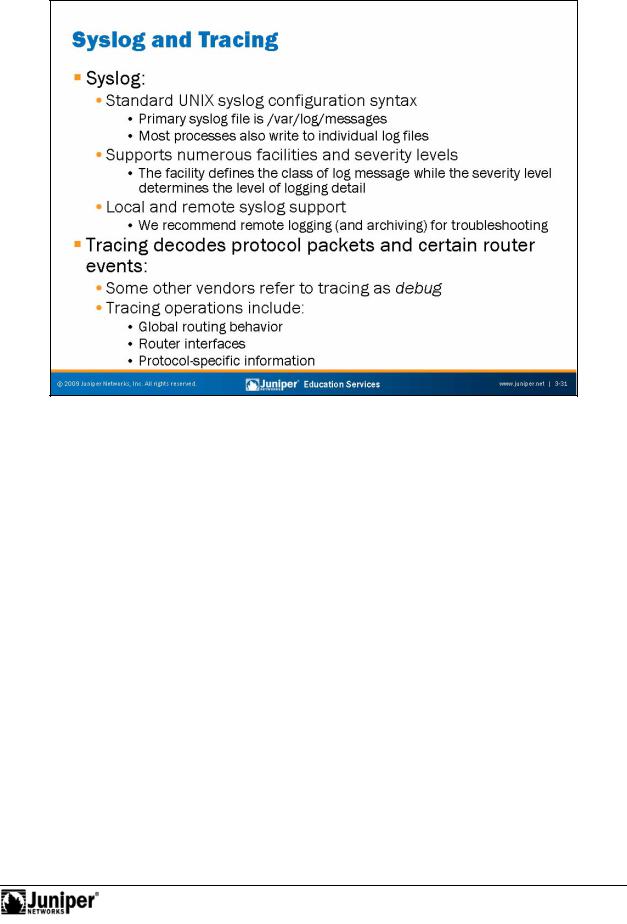
Syslog operations use a UNIX syslog-style mechanism to record system-wide, high-level op rations, such as interfaces going up or down or users logging in to or out of the router. You configure these operations by using the syslog statement at the
for[edit system] hierarchy level and the options statement at the [edit outing-options] hierarchy level.
The esults of tracing and logging operations go in files that the router stores in the /va /log directory. You use the show log file-name command to display the c ntents of these files.
Tracing Operations
Tracing operations allow you to monitor the operation of routing protocols by decoding the sent and received routing protocol packets. In many ways, tracing is synonymous with the debug function on equipment made by other vendors. Note that because of the design of some hardware-based Juniper Networks platforms, you can enable reasonably detailed tracing in a production network without negative impact on overall performance or packet forwarding.
Troubleshooting Tool Kit for JUNOS Platforms • Chapter 3–31
Troubleshooting JUNOS Platforms
Not
Syslog Options Example
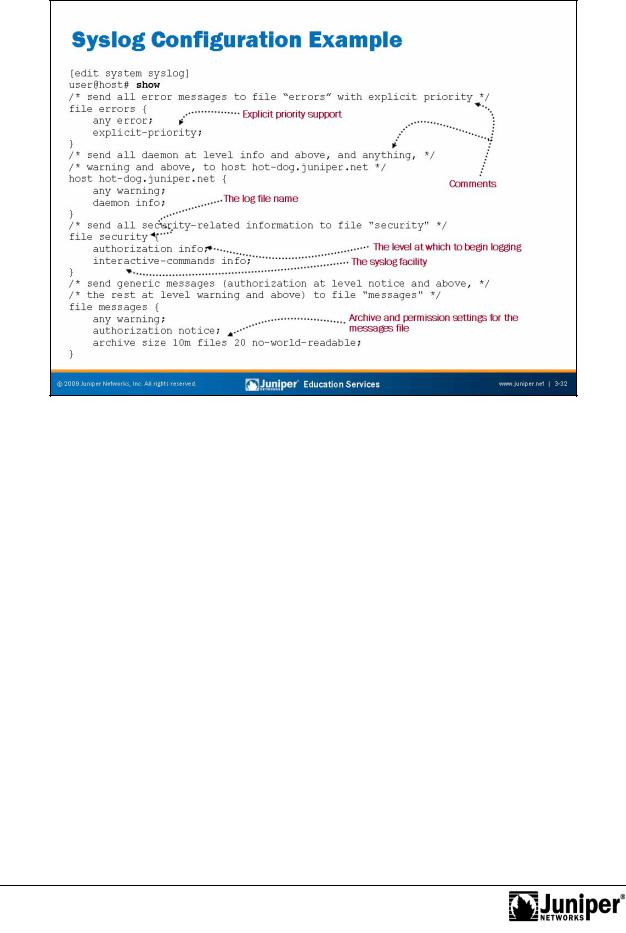
The example on the slide shows various syslog configurations that result in messages written to local log fil s and to a mote host. General syslog configuration options include the following:
• |
a chive: Configures archive system logging files; |
• |
console: Configures the types of syslog messages to log to the system |
|
c nsole;Reproduction |
• |
facility: Displays the class of log messages; |
• |
file filename: Configures the types of syslog messages to log to the |
|
specified file; and |
for |
|
• |
files number: Displays the maximum number of system log files. |
You can configure support for explicit priority in syslog messages. This configuration alters the normal syslog message format by adding a numeric priority value. The explicit priority value can simplify the task of parsing log files for important messages. For example, you can search for all messages at priority 7. The presence of explicit priority also accommodates the use of tools that designers developed to parse the logs generated by equipment from other vendors.
Continued on next page.
Chapter 3–32 • Troubleshooting Tool Kit for JUNOS Platforms

|
|
|
|
|
Troubleshooting JUNOS Platforms |
|
|
Syslog Options Example (contd.) |
|
||
|
|
The following table illustrates the mapping of numeric codes to message severity: |
|||
|
|
|
|
||
|
|
0 |
emergency |
System panic or other condition that causes the |
|
|
|
|
|
routing platform to stop functioning |
|
|
|
|
|
|
|
|
|
1 |
alert |
Conditions that require immediate correction, such as a |
|
|
|
|
|
Reproduction |
|
|
|
|
|
corrupted system database |
|
|
|
2 |
critical |
Critical conditions, such as hard disk err rs |
|
|
|
3 |
error |
Error conditions that generally have less ser us |
|
|
|
|
|
consequences than errors in the emergency, alert, and critical |
|
|
|
|
|
levels |
|
|
|
4 |
warning |
Conditions that warrant monitoring |
|
|
|
5 |
notice |
Conditions that are no |
errors b t might warrant |
|
|
|
|
special handling |
|
|
|
6 |
info |
Events or nonerror con |
itions of interest |
|
|
7 |
debug |
Software debugging messages; specify this level only when so |
|
|
|
|
|
directed by a technical support representative |
|
|
|
The following are examples f a sysl g message, both with and without an explicit |
|||
|
|
priority, respectively: |
|
|
|
Aug 21 12:36:30 router1 chassisd[522]: %DAEMON-6 CHASSISD PARSE COMPLETE: |
|||||
Aug 21 12:36:30 router1 chassisd[522]: CHASSISD PARSE COMPLETE: Using new |
|||||
configuration |
|
|
|
||
Not |
for |
|
|
|
|
|
|
|
|
|
|
Troubleshooting Tool Kit for JUNOS Platforms • Chapter 3–33
Troubleshooting JUNOS Platforms
Not
Process and Miscellan ous Log Files
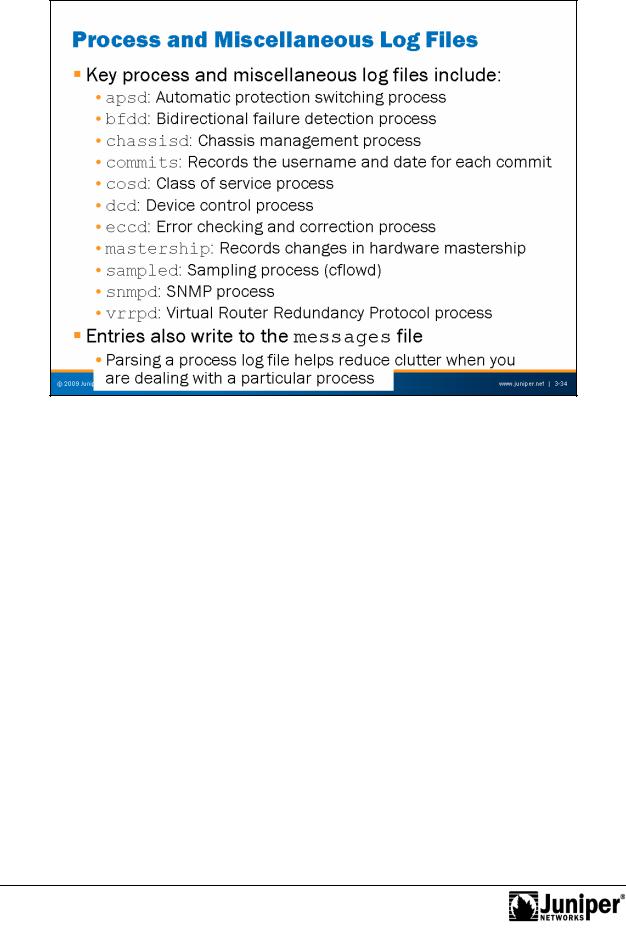
The primary system log file is the m ssages file. However, some of the processes that run under JUNOS Software maintain their own log files named after their respective process. No requirement exists to configure th router to keep these logs. Note that in many cases, the software also writes the entries found in these logs to the main messages file. Key process log files include the following:
• |
apsd: The automatic protection switching process handles events |
|
|
Reproduction |
|
|
elegated to SONET Automatic Protection Switching (APS). View this log |
|
|
when you are dealing with an APS issue. |
|
• |
bfdd: The bidirectional failure detection process functions to provide |
|
for |
rapid detection of failures in the forwarding plane to expedite routing |
|
protocol convergence. |
||
chassisd: The chassisd process is responsible for monitoring and |
||
• |
||
|
managing the hardware present in the physical router chassis, including |
|
|
ASICs, power supplies, fans, and temperature sensors, as well as |
|
|
managing hot-swap events. |
|
• |
commits: This log file records the commit activities on the router in the |
|
|
form of date and time, user, and mode. |
|
• |
cosd: The class of service process monitors class-of-service events in |
|
|
the chassis. |
Continued on next page.
Chapter 3–34 • Troubleshooting Tool Kit for JUNOS Platforms