


46 |||| CHAPTER 1 FUNCTIONS AND MODELS
1.4
(a, d ) |
y=d |
(b, d ) |
x=a |
|
x=b |
(a, c) |
y=c |
(b, c) |
FIGURE 1
The viewing rectangle +a,!b, by +c,!d,
2
_2 |
2 |
_2
(a) +_2,!2, by +_2, 2,
4
_4 |
4 |
_4
(b) +_4,!4, by +_4, 4,
FIGURE 2 Graphs of Ä=≈+3
GRAPHING CALCULATORS AND COMPUTERS
In this section we assume that you have access to a graphing calculator or a computer with graphing software. We will see that the use of such a device enables us to graph more complicated functions and to solve more complex problems than would otherwise be possible. We also point out some of the pitfalls that can occur with these machines.
Graphing calculators and computers can give very accurate graphs of functions. But we will see in Chapter 4 that only through the use of calculus can we be sure that we have uncovered all the interesting aspects of a graph.
A graphing calculator or computer displays a rectangular portion of the graph of a function in a display window or viewing screen, which we refer to as a viewing rectangle. The default screen often gives an incomplete or misleading picture, so it is important to choose the viewing rectangle with care. If we choose the x-values to range from a minimum value of Xmin ! a to a maximum value of Xmax ! b and the y-values to range from a minimum of Ymin ! c to a maximum of Ymax ! d, then the visible portion of the graph lies in the rectangle
+a, b, * +c, d, ! '!x, y" # a ( x ( b, c ( y ( d(
shown in Figure 1. We refer to this rectangle as the +a, b, by +c, d, viewing rectangle. The machine draws the graph of a function f much as you would. It plots points of the
form !x, f !x"" for a certain number of equally spaced values of x between a and b. If an x-value is not in the domain of f, or if f !x" lies outside the viewing rectangle, it moves on to the next x-value. The machine connects each point to the preceding plotted point to form a representation of the graph of f.
EXAMPLE 1 Draw the graph of the function f !x" ! x2 $ 3 in each of the following viewing rectangles.
(a) +"2, 2, by +"2, 2, |
(b) +"4, 4, by +"4, 4, |
(c) +"10, 10, by +"5, 30, |
(d) +"50, 50, by +"100, 1000, |
SOLUTION For part (a) we select the range by setting Xmin ! "2, Xmax ! 2, Ymin ! "2, and Ymax ! 2. The resulting graph is shown in Figure 2(a). The display window is blank! A moment’s thought provides the explanation: Notice that x2 # 0 for all x, so
x2 $ 3 # 3 for all x. Thus the range of the function f !x" ! x2 $ 3 is +3, '". This means that the graph of f lies entirely outside the viewing rectangle +"2, 2, by +"2, 2,.
The graphs for the viewing rectangles in parts (b), (c), and (d) are also shown in Figure 2. Observe that we get a more complete picture in parts (c) and (d), but in part (d) it is not clear that the y-intercept is 3.
30 |
1000 |
_10 |
|
|
10 |
_50 |
|
|
50 |
|
|
|
|
||||
|
|
|
|
_ |
|
||
_ |
5 |
|
|
100 |
|
||
|
(c) +_10,!10, by +_5, 30, |
|
|
(d) +_50,!50, by +_100, 1000, |
|||
M

|
|
|
|
|
|
|
|
|
SECTION 1.4 |
GRAPHING CALCULATORS AND COMPUTERS |||| |
47 |
|||||||||||||
|
|
|
|
|
|
|
We see from Example 1 that the choice of a viewing rectangle can make a big differ- |
|||||||||||||||||
|
|
|
|
|
|
|
ence in the appearance of a graph. Often it’s necessary to change to a larger viewing |
|||||||||||||||||
|
|
|
|
|
|
|
rectangle to obtain a more complete picture, a more global view, of the graph. In the next |
|||||||||||||||||
|
|
|
|
|
|
|
example we see that knowledge of the domain and range of a function sometimes provides |
|||||||||||||||||
|
|
|
|
|
|
|
us with enough information to select a good viewing rectangle. |
|
||||||||||||||||
|
|
|
|
|
|
|
EXAMPLE 2 Determine an appropriate viewing rectangle for the function |
|
||||||||||||||||
|
|
|
|
|
|
|
f !x" ! s |
8 " 2x2 |
and use it to graph f. |
|
|
|
|
|
|
|
|
|||||||
|
|
|
|
|
|
|
SOLUTION The expression for f !x" is defined when |
|
|
|
|
|
||||||||||||
|
|
|
|
|
|
|
|
|
8 " 2x2 # 0 &? 2x2 ( 8 &? x2 ( 4 |
|
||||||||||||||
4 |
|
|
|
|
|
|
|
&? # x # ( 2 &? "2 ( x ( 2 |
|
|||||||||||||||
|
|
|
|
|
|
|
Therefore the domain of f |
is the interval +"2, 2,. Also, |
|
|||||||||||||||
|
|
|
|
|
|
|
0 |
s |
|
|
|
|
( |
s |
|
! |
2 |
s |
|
/ 2.83 |
|
|||
|
|
|
|
|
|
|
( |
|
8 " |
2x2 |
|
8 |
|
2 |
|
|||||||||
_3 |
|
|
|
|
|
3 |
so the range of f is the interval [0, 2s |
|
]. |
|
|
|
|
|
|
|
|
|||||||
2 |
|
|
|
|
|
|
|
|
||||||||||||||||
|
|
|
|
|
|
|
|
|
|
|
|
|||||||||||||
|
|
|
|
|
|
|
We choose the viewing rectangle so that the x-interval is somewhat larger than the |
|
||||||||||||||||
_1 |
|
|
|
|||||||||||||||||||||
|
|
domain and the y-interval is larger than the range. Taking the viewing rectangle to be |
|
|||||||||||||||||||||
|
|
|
|
|
|
|
|
|||||||||||||||||
FIGURE 3 |
|
+"3, 3, by +"1, 4,, we get the graph shown in Figure 3. |
M |
|||||||||||||||||||||
|
|
|
|
|
|
|
EXAMPLE 3 Graph the function y ! x3 " 150x. |
|
|
|
|
|
||||||||||||
5 |
|
|
|
SOLUTION Here the domain is ", the set of all real numbers. That doesn’t help us choose a |
||||||||||||||||||||
|
|
|
|
|
|
|
viewing rectangle. Let’s experiment. If we start with the viewing rectangle +"5, 5, by |
|
||||||||||||||||
|
|
|
|
|
|
|
+"5, 5,, we get the graph in Figure 4. It appears blank, but actually the graph is so |
|
||||||||||||||||
_5 |
|
|
|
|
|
5 |
nearly vertical that it blends in with the y-axis. |
|
|
|
|
|
||||||||||||
|
|
|
|
|
If we change the viewing rectangle to +"20, 20, by +"20, 20,, we get the picture |
|
||||||||||||||||||
|
|
|
|
|
|
|||||||||||||||||||
|
|
|
|
|
|
|
|
|||||||||||||||||
|
|
|
|
|
|
|
shown in Figure 5(a). The graph appears to consist of vertical lines, but we know that |
|
||||||||||||||||
|
|
|
|
|
|
|
can’t be correct. If we look carefully while the graph is being drawn, we see that the |
|
||||||||||||||||
_5 |
|
|
graph leaves the screen and reappears during the graphing process. This indicates that |
|
||||||||||||||||||||
|
|
we need to see more in the vertical direction, so we change the viewing rectangle to |
|
|||||||||||||||||||||
FIGURE 4 |
|
|
||||||||||||||||||||||
|
+"20, 20, by +"500, 500,. The resulting graph is shown in Figure 5(b). It still doesn’t |
|
||||||||||||||||||||||
|
|
|
|
|
|
|
quite reveal all the main features of the function, so we try +"20, 20, by +"1000, 1000, |
|||||||||||||||||
|
|
|
|
|
|
|
in Figure 5(c). Now we are more confident that we have arrived at an appropriate view- |
|||||||||||||||||
|
|
|
|
|
|
|
ing rectangle. In Chapter 4 we will be able to see that the graph shown in Figure 5(c) |
|
||||||||||||||||
|
|
|
|
|
|
|
does indeed reveal all the main features of the function. |
|
||||||||||||||||
|
20 |
|
500 |
_20 |
20 |
_20 |
20 |
|
_20 |
|
_500 |
|
(a) |
|
(b) |
|
1000 |
_20 |
20 |
|
_1000 |
|
(c) |
FIGURE 5 y=þ-150x |
M |

48 |||| CHAPTER 1 FUNCTIONS AND MODELS
N The appearance of the graphs in Figure 6 depends on the machine used. The graphs you get with your own graphing device might not look like these figures, but they will also be quite inaccurate.
FIGURE 6
Graphs of Ä=sin!50x in four viewing rectangles
V EXAMPLE 4 Graph the function f !x" ! sin 50x in an appropriate viewing rectangle.
SOLUTION Figure 6(a) shows the graph of f produced by a graphing calculator using the viewing rectangle +"12, 12, by +"1.5, 1.5,. At first glance the graph appears to be reasonable. But if we change the viewing rectangle to the ones shown in the following parts of Figure 6, the graphs look very different. Something strange is happening.
|
1.5 |
_12 |
12 |
|
_1.5 |
|
(a) |
|
1.5 |
_9 |
9 |
|
_1.5 |
|
(c) |
|
1.5 |
_10 |
10 |
|
_1.5 |
|
(b) |
|
1.5 |
_6 |
6 |
|
_1.5 |
|
(d) |
In order to explain the big differences in appearance of these graphs and to find an
|
|
|
|
|
appropriate viewing rectangle, we need to find the period of the function y ! sin 50x. |
|
|||||||
|
|
1.5 |
|
We know that the function y ! sin x has period 2% and the graph of y ! sin 50x is |
|
||||||||
|
|
|
compressed horizontally by a factor of 50, so the period of y ! sin 50x is |
|
|||||||||
|
|
|
|
|
|
||||||||
|
|
|
|
|
|
2% |
! |
% |
/ 0.126 |
|
|||
|
|
|
|
|
50 |
|
|
||||||
_.25 |
|
|
|
.25 |
25 |
|
|
|
|
||||
|
|
|
This suggests that we should deal only with small values of x in order to show just a few |
||||||||||
|
|
|
|
|
|||||||||
|
|
|
|
|
oscillations of the graph. If we choose the viewing rectangle +"0.25, 0.25, by +"1.5, 1.5,, |
||||||||
|
|
|
|
|
we get the graph shown in Figure 7. |
|
|
|
|
|
|
||
|
|
_1.5 |
|
|
|
|
|
|
|
||||
|
|
|
|
Now we see what went wrong in Figure 6. The oscillations of y ! sin 50x are so rapid |
|||||||||
|
|
|
|
|
|
||||||||
FIGURE 7 |
|
|
|
that when the calculator plots points and joins them, it misses most of the maximum and |
|||||||||
Ä=sin!50x |
|
|
|
minimum points and therefore gives a very misleading impression of the graph. |
M |
||||||||
|
|
|
|
|
|
We have seen that the use of an inappropriate viewing rectangle can give a misleading |
|||||||
|
|
|
|
|
impression of the graph of a function. In Examples 1 and 3 we solved the problem by |
||||||||
|
|
|
|
|
changing to a larger viewing rectangle. In Example 4 we had to make the viewing rect- |
||||||||
|
|
|
|
|
angle smaller. In the next example we look at a function for which there is no single view- |
||||||||
|
|
|
|
|
ing rectangle that reveals the true shape of the graph. |
|
|||||||
|
|
|
|
|
|
EXAMPLE 5 Graph the function f !x" ! sin x $ |
1 |
cos 100x. |
|
||||
|
|
|
|
|
V |
|
|||||||
|
|
|
|
|
100 |
|
|||||||
|
|
|
|
|
|
|
|||||||
|
|
|
|
|
SOLUTION Figure 8 shows the graph of f |
produced by a graphing calculator with viewing |
|
||||||
|
|
|
|
|
rectangle +"6.5, 6.5, by +"1.5, 1.5,. It looks much like the graph of y ! sin x, but per- |
|
|||||||
|
|
|
|
|
haps with some bumps attached. If we zoom in to the viewing rectangle +"0.1, 0.1, by |
|
|||||||
|
|
|
|
|
+"0.1, 0.1,, we can see much more clearly the shape of these bumps in Figure 9. The |
|
|||||||
SECTION 1.4 GRAPHING CALCULATORS AND COMPUTERS |||| 49
N Another way to avoid the extraneous line is to change the graphing mode on the calculator so that the dots are not connected.
FIGURE 10
reason for this behavior is that the second term, 1001 cos 100x, is very small in comparison with the first term, sin x. Thus we really need two graphs to see the true nature of this function.
1.5 |
|
|
0.1 |
_6.5 |
6.5 |
_0.1 |
0.1 |
_1.5 |
|
|
_0.1 |
FIGURE 8 |
FIGURE 9 |
M |
||
EXAMPLE 6 Draw the graph of the function y ! |
1 |
. |
|
|
1 " x |
|
|||
SOLUTION Figure 10(a) shows the graph produced by a graphing calculator with viewing rectangle +"9, 9, by +"9, 9,. In connecting successive points on the graph, the calculator produced a steep line segment from the top to the bottom of the screen. That line segment is not truly part of the graph. Notice that the domain of the function
y ! 1&!1 " x" is 'x # x " 1(. We can eliminate the extraneous near-vertical line by experimenting with a change of scale. When we change to the smaller viewing rectangle +"4.7, 4.7, by +"4.7, 4.7, on this particular calculator, we obtain the much better graph in Figure 10(b).
9 |
|
|
4.7 |
|
_9 |
9 |
_4.7 |
|
4.7 |
_9 |
|
|
_4.7 |
|
(a) |
|
|
(b) |
M |
|
|
|
|
EXAMPLE 7 Graph the function y ! s3 x .
SOLUTION Some graphing devices display the graph shown in Figure 11, whereas others produce a graph like that in Figure 12. We know from Section 1.2 (Figure 13) that the graph in Figure 12 is correct, so what happened in Figure 11? The explanation is that some machines compute the cube root of x using a logarithm, which is not defined if x is negative, so only the right half of the graph is produced.
2 |
2 |
_3 |
3 |
_3 |
3 |
_2 |
|
|
_2 |
FIGURE 11 |
FIGURE 12 |

50 |||| CHAPTER 1 FUNCTIONS AND MODELS
You should experiment with your own machine to see which of these two graphs is produced. If you get the graph in Figure 11, you can obtain the correct picture by graphing the function
f #x$ ! |
x |
! % x %1&3 |
|
||
% x % |
|
||||
|
|
|
|
|
|
Notice that this function is equal to s |
|
(except when x ! 0). |
M |
||
x |
|||||
3 |
|
|
|
|
|
TEC In Visual 1.4 you can see an animation of Figure 13.
To understand how the expression for a function relates to its graph, it’s helpful to graph a family of functions, that is, a collection of functions whose equations are related. In the next example we graph members of a family of cubic polynomials.
V EXAMPLE 8 Graph the function y ! x3 " cx for various values of the number c. How does the graph change when c is changed?
SOLUTION Figure 13 shows the graphs of y ! x3 " cx for c ! 2, 1, 0, !1, and !2. We see that, for positive values of c, the graph increases from left to right with no maximum or minimum points (peaks or valleys). When c ! 0, the curve is flat at the origin. When c is negative, the curve has a maximum point and a minimum point. As c decreases, the maximum point becomes higher and the minimum point lower.
(a) y=þ+2x |
(b) y=þ+x |
(c) y=þ |
(d) y=þ-x |
(e) y=þ-2x |
FIGURE 13
Several members of the family of functions y=þ+cx, all graphed
in the viewing rectangle !_2,!2" by !_2.5,!2.5"
M
EXAMPLE 9 Find the solution of the equation cos x ! x correct to two decimal places.
SOLUTION The solutions of the equation cos x ! x are the x-coordinates of the points of intersection of the curves y ! cos x and y ! x. From Figure 14(a) we see that there is only one solution and it lies between 0 and 1. Zooming in to the viewing rectangle !0, 1" by !0, 1", we see from Figure 14(b) that the root lies between 0.7 and 0.8. So we zoom in further to the viewing rectangle !0.7, 0.8" by !0.7, 0.8" in Figure 14(c). By moving the cursor to the intersection point of the two curves, or by inspection and the fact that the x-scale is 0.01, we see that the solution of the equation is about 0.74. (Many calculators have a built-in intersection feature.)
FIGURE 14
Locating the roots of cos!x=x
|
|
1.5 |
1 |
|
0.8 |
|
|
|
|
y=x |
|
y=cos x |
|
|
|
|
|
y=cos x |
|
|
|
|
|
|
|
|
|
|
y=x |
|
|
_5 |
|
5 |
|
y=x |
|
|
|
|
|
|
y=cos x |
|
|||
|
|
|
|
|
|
|
|
|
|
_1.5 |
0 |
1 |
0.7 |
|
0.8 |
|
|
|
|
|
|||
|
(a) !_5,!5" by !_1.5,!1.5" |
|
(b) !0,!1" by !0,!1" |
(c) !0.7,!0.8" by !0.7,!0.8" |
|
||
|
x-scale |
=1 |
|
=0.1 |
x-scale |
=0.01 |
M |
|
|
|
x-scale |
|
|||

SECTION 1.4 GRAPHING CALCULATORS AND COMPUTERS |||| 51
1.4; EXERCISES
1.Use a graphing calculator or computer to determine which of
the given viewing rectangles produces the most appropriate graph of the function f #x$ ! sx3 ! 5x2 .
(a) !!5, 5" by !!5, 5" |
(b) !0, 10" by !0, 2" |
(c)!0, 10" by !0, 10"
2.Use a graphing calculator or computer to determine which of the given viewing rectangles produces the most appropriate graph of the function f #x$ ! x4 ! 16x2 " 20.
(a) !!3, 3" by !!3, 3" |
(b) !!10, 10" by !!10, 10" |
(c) !!50, 50" by !!50, 50" |
(d) !!5, 5" by !!50, 50" |
3–14 Determine an appropriate viewing rectangle for the given function and use it to draw the graph.
3. |
f #x$ ! 5 " 20x ! x2 |
4. |
f #x$ ! x3 " 30x2 " 200x |
||||||||||
|
s |
|
|
|
|
|
s |
|
|
||||
5. |
f #x$ ! 4 |
81 ! x4 |
|
6. |
f #x$ |
! |
0.1x " 20 |
|
|||||
7. |
f #x$ ! x3 ! 225x |
8. |
f #x$ |
! |
|
x |
|
||||||
x2 " 100 |
|||||||||||||
|
|
|
|
|
|
|
|
|
|||||
9. |
f #x$ ! sin2#1000x$ |
10. |
f #x$ ! cos#0.001x$ |
||||||||||
11. f #x$ ! sin s |
|
|
|
12. |
f #x$ ! sec#20%x$ |
||||||||
x |
|||||||||||||
13. y ! 10 sin x " sin 100x |
14. |
y ! x2 " 0.02 sin 50x |
|||||||||||
|
|
|
|
|
|
|
|
|
|
|
|
|
|
15.Graph the ellipse 4x2 " 2y2 ! 1 by graphing the functions whose graphs are the upper and lower halves of the ellipse.
16.Graph the hyperbola y2 ! 9x2 ! 1 by graphing the functions whose graphs are the upper and lower branches of the hyperbola.
17–18 Do the graphs intersect in the given viewing rectangle? If they do, how many points of intersection are there?
17.y ! 3x2 ! 6x " 1, y ! 0.23x ! 2.25; !!1, 3" by !!2.5, 1.5"
18.y ! 6 ! 4x ! x2, y ! 3x " 18; !!6, 2" by !!5, 20"
19–21 Find all solutions of the equation correct to two decimal places.
19. x3 ! 9x2 ! 4 ! 0 |
20. x3 ! 4x ! 1 |
21.x2 ! sin x
22.We saw in Example 9 that the equation cos x ! x has exactly one solution.
(a)Use a graph to show that the equation cos x ! 0.3x has three solutions and find their values correct to two decimal places.
(b)Find an approximate value of m such that the equation cos x ! mx has exactly two solutions.
23.Use graphs to determine which of the functions f #x$ ! 10x2 and t#x$ ! x3&10 is eventually larger (that is, larger when x is very large).
24. Use graphs to determine which of the functions
f #x$ ! x4 ! 100x3 and t#x$ ! x3 is eventually larger.
25.For what values of x is it true that % sin x ! x % $ 0.1?
26.Graph the polynomials P#x$ ! 3x5 ! 5x3 " 2x and Q#x$ ! 3x5 on the same screen, first using the viewing rectangle !!2, 2" by [!2, 2] and then changing to !!10, 10" by !!10,000, 10,000". What do you observe from these graphs?
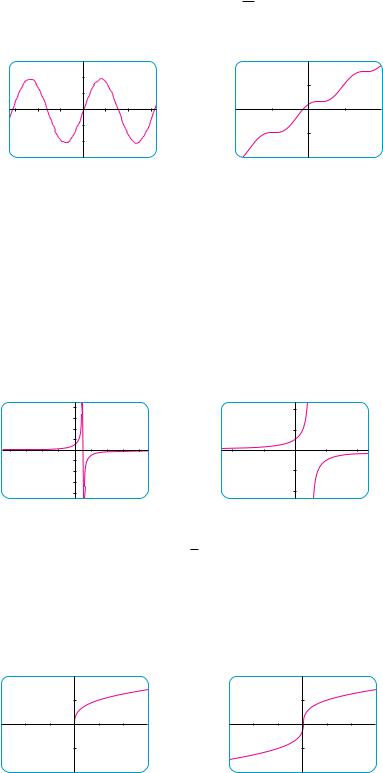
27.In this exercise we consider the family of root functions f #x$ ! sn x , where n is a positive integer.
(a)Graph the functions y ! sx , y ! s4 x , and y ! s6 x on the same screen using the viewing rectangle !!1, 4" by !!1, 3".
(b)Graph the functions y ! x, y ! s3 x , and y ! s5 x on the same screen using the viewing rectangle !!3, 3" by !!2, 2". (See Example 7.)
(c)Graph the functions y ! sx , y ! s3 x , y ! s4 x , and
y ! s5 x on the same screen using the viewing rectangle !!1, 3" by !!1, 2".
(d)What conclusions can you make from these graphs?
28.In this exercise we consider the family of functions
f #x$ ! 1&xn, where n is a positive integer.
(a)Graph the functions y ! 1&x and y ! 1&x3 on the same screen using the viewing rectangle !!3, 3" by !!3, 3".
(b)Graph the functions y ! 1&x2 and y ! 1&x4 on the same screen using the same viewing rectangle as in part (a).
(c)Graph all of the functions in parts (a) and (b) on the same screen using the viewing rectangle !!1, 3" by !!1, 3".
(d)What conclusions can you make from these graphs?
29.Graph the function f #x$ ! x4 " cx2 " x for several values of c. How does the graph change when c changes?
30.Graph the function f #x$ ! s1 " cx2 for various values
of c. Describe how changing the value of c affects the graph.
31.Graph the function y ! xn2!x, x # 0, for n ! 1, 2, 3, 4, 5, and 6. How does the graph change as n increases?
32.The curves with equations
y ! % x % sc ! x2
are called bullet-nose curves. Graph some of these curves to see why. What happens as c increases?
33.What happens to the graph of the equation y2 ! cx3 " x2 as c varies?
34.This exercise explores the effect of the inner function t on a composite function y ! f # t#x$$.
(a)Graph the function y ! sin(sx ) using the viewing rectangle !0, 400" by !!1.5, 1.5". How does this graph differ from the graph of the sine function?
52 |||| CHAPTER 1 FUNCTIONS AND MODELS
(b)Graph the function y ! sin#x2 $ using the viewing rectangle !!5, 5" by !!1.5, 1.5". How does this graph differ from the graph of the sine function?
35.The figure shows the graphs of y ! sin 96x and y ! sin 2x as displayed by a TI-83 graphing calculator.
0 2π 0 2π
y=sin!96x y=sin!2x
The first graph is inaccurate. Explain why the two graphs appear identical. [Hint: The TI-83’s graphing window is 95 pixels wide. What specific points does the calculator plot?]
36.The first graph in the figure is that of y ! sin 45x as displayed by a TI-83 graphing calculator. It is inaccurate and so, to help explain its appearance, we replot the curve in dot mode in the second graph.
0 |
2π 0 |
2π |
What two sine curves does the calculator appear to be plotting? Show that each point on the graph of y ! sin 45x that the TI83 chooses to plot is in fact on one of these two curves. (The TI-83’s graphing window is 95 pixels wide.)
|
|
|
|
|
|
|
|
|
|
|
|
|
|
1.5 |
EXPONENTIAL FUNCTIONS |
|
|
|
|
|
|
|
|
|
|
|
|
|
|
|
|
|
|
|
|
|
|
|
|
|
|
||
|
|
|
|
|
|
|
|
|
|
|
|
|
|
|
|
|
|
|
|
||
|
|
|
|
|
|
|
|
|
|
|
|
|
|
|
|
|
|
|
|
||
|
|
|
|
|
|
|
|
|
|
|
|
|
|
|
The function f #x$ ! 2x is called an exponential function because the variable, x, is the |
||||||
|
|
|
|
|
|
|
|
|
|
|
|
|
|
|
|||||||
|
|
|
|
|
|
|
|
|
|
|
|
|
|
|
exponent. It should not be confused with the power function t#x$ ! x2, in which the vari- |
||||||
|
|
|
|
|
|
|
|
|
|
|
|
|
|
|
able is the base. |
|
|
|
|
|
|
N In Appendix G we present an alternative |
In general, an exponential function is a function of the form |
||||||||||||||||||||
approach to the exponential and logarithmic |
f #x$ ! ax |
||||||||||||||||||||
functions using integral calculus. |
|
|
|||||||||||||||||||
|
|
|
|
|
|
|
|
|
|
|
|
|
|
|
where a is a positive constant. Let’s recall what this means. |
||||||
|
|
|
|
|
|
|
|
|
|
|
|
|
|
|
If x ! n, a positive integer, then |
|
|
|
|
|
|
|
|
|
|
|
|
|
|
|
|
|
|
|
|
|
an ! a ! a ! ''' ! a |
||||||
|
|
|
|
|
|
|
|
|
|
|
|
|
|
|
n factors |
||||||
|
|
|
|
|
|
|
|
|
|
|
|
|
|
|
If x ! 0, then a0 ! 1, and if x ! !n, where n is a positive integer, then |
||||||
|
|
|
|
|
|
|
|
|
|
|
|
|
|
|
a!n ! |
|
1 |
|
|
|
|
|
|
|
|
|
|
|
|
|
|
|
|
|
|
|
|
an |
|||||
|
|
|
|
|
|
|
|
|
|
|
|
|
|
|
|
|
|||||
|
|
|
|
|
|
|
|
|
|
|
|
|
|
|
If x is a rational number, x ! p&q, where p and q are integers and q & 0, then |
||||||
|
|
|
|
|
y |
|
|
|
|
|
|
|
|
ax ! ap&q ! q |
|
|
! (q |
|
)p |
||
|
|
|
|
|
|
|
|
ap |
a |
||||||||||||
|
|
|
|
|
|
|
|
|
|||||||||||||
|
|
|
|
|
|
|
|
|
|
|
|
|
|
|
s |
|
|
|
s |
||
|
|
|
|
|
|
|
|
|
|
|
|
|
|
|
But what is the meaning of ax if x is an irrational number? For instance, what is meant by |
||||||
|
|
|
|
|
|
|
|
|
|
|
|
|
|
|
|||||||
|
|
|
|
|
|
|
|
|
|
|
|
|
|
|
2s3 or 5%? |
|
|
|
|
|
|
|
|
|
|
|
|
|
|
|
|
|
|
|
|
|
|
|
|
|
|
|
|
|
|
|
|
|
|
|
|
|
|
|
|
|
|
|
To help us answer this question we first look at the graph of the function y ! 2x, where |
||||||
1 |
|
|
|
|
|
|
|
|
|
x is rational. A representation of this graph is shown in Figure 1. We want to enlarge the |
|||||||||||
|
|
|
|
|
|
|
|
|
domain of y ! 2x to include both rational and irrational numbers. |
||||||||||||
|
|
|
|
|
|
|
|
|
|||||||||||||
|
|
|
|
|
|
|
|
|
|
|
|
|
x |
There are holes in the graph in Figure 1 corresponding to irrational values of x. We want |
|||||||
|
|
|
|
|
0 |
|
1 |
|
|
to fill in the holes by defining f #x$ ! 2x, where x " !, so that f is an increasing function. |
|||||||||||
|
FIGURE 1 |
|
|
|
|
|
|
|
|
In particular, since the irrational number s3 satisfies |
|||||||||||
|
|
|
|
|
|
|
|
|
|
|
|
|
|
|
|
||||||
Representation of y=2¨, x rational |
1.7 |
$ s |
|
$ 1.8 |
3 |

SECTION 1.5 EXPONENTIAL FUNCTIONS |||| 53
we must have
21.7 $ 2s3 $ 21.8
and we know what 21.7 and 21.8 mean because 1.7 and 1.8 are rational numbers. Similarly, if we use better approximations for s3 , we obtain better approximations for 2s3:
1.73 |
$ s |
3 |
$ 1.74 |
? 21.73 |
$ 2s |
3 |
$ 21.74 |
1.732 |
$ s |
|
$ 1.733 |
? 21.732 |
$ 2s |
|
$ 21.733 |
3 |
3 |
||||||
1.7320 |
$ s |
|
$ 1.7321 |
? 21.7320 |
$ 2s |
|
$ 21.7321 |
3 |
3 |
||||||
1.73205 |
$ s |
|
$ 1.73206 |
? 21.73205 |
$ 2s |
|
$ 21.73206 |
3 |
3 |
||||||
. |
|
|
. |
. |
|
|
. |
. |
|
|
. |
. |
|
|
. |
. |
|
|
. |
. |
|
|
. |
N A proof of this fact is given in J. Marsden and A. Weinstein, Calculus Unlimited (Menlo Park, CA: Benjamin/Cummings, 1981). For an online version, see
It can be shown that there is exactly one number that is greater than all of the numbers
21.7, 21.73, 21.732, 21.7320, 21.73205, . . .
www.cds.caltech.edu/~marsden/ |
and less than all of the numbers |
volume/cu/CU.pdf |
|
|
21.8, 21.74, 21.733, 21.7321, 21.73206, . . . |
y
1
0 1 x
FIGURE 2 y=2¨, x real
N If 0 $ a $ 1, then a x approaches 0 as x becomes large. If a & 1, then a x approaches 0 as x decreases through negative values. In both cases the x-axis is a horizontal asymptote. These matters are discussed in Section 2.6.
FIGURE 3
We define 2s3 to be this number. Using the preceding approximation process we can compute it correct to six decimal places:
2s3 ' 3.321997
Similarly, we can define 2x (or ax, if a & 0) where x is any irrational number. Figure 2 shows how all the holes in Figure 1 have been filled to complete the graph of the function f #x$ ! 2x, x " !.
The graphs of members of the family of functions y ! ax are shown in Figure 3 for various values of the base a. Notice that all of these graphs pass through the same point #0, 1$ because a0 ! 1 for a " 0. Notice also that as the base a gets larger, the exponential function grows more rapidly (for x & 0).
Ó!!!1 |
Õ¨ |
Ó!!!1 |
Õ¨ |
y |
10¨ |
4¨ |
2¨ |
1.5¨ |
2 |
|
4 |
|
|
|
|
|
1¨
|
|
|
|
|
|
0 |
1 |
x |
|||
You can see from Figure 3 that there are basically three kinds of exponential functions y ! ax. If 0 $ a $ 1, the exponential function decreases; if a ! 1, it is a constant; and if a & 1, it increases. These three cases are illustrated in Figure 4. Observe that if a " 1,

54 |||| CHAPTER 1 FUNCTIONS AND MODELS
y 
(0,!1)
0x
(a)y=a¨, !0<a<1
FIGURE 4
www.stewartcalculus.com
For review and practice using the Laws of Exponents, click on Review of Algebra.
then the exponential function y ! ax has domain ! and range #0, ($. Notice also that, since #1&a$x ! 1&ax ! a!x, the graph of y ! #1&a$x is just the reflection of the graph of y ! ax about the y-axis.
|
y |
|
|
|
|
y |
|
|
|
|
|
|
|
|
|
||||
1 |
|
|
|
|
|
|
(0,!1) |
|
|
|
|
|
|
|
x |
|
|
x |
|
|
|
|
|
|
|
|
|
||
0 |
|
|
|
0 |
|
|
|||
|
(b) y=1¨ |
|
|
(c) y=a¨, !a>1 |
|
||||
One reason for the importance of the exponential function lies in the following properties. If x and y are rational numbers, then these laws are well known from elementary algebra. It can be proved that they remain true for arbitrary real numbers x and y. (See Appendix G.)
LAWS OF EXPONENTS If a and b are positive numbers and x and y are any real numbers, then
|
ax |
3. #ax $y ! axy |
4. #ab$x ! axbx |
1. ax"y ! axay |
2. ax!y ! ay |
EXAMPLE 1 Sketch the graph of the function y ! 3 ! 2x and determine its domain and range.
N For a review of reflecting and shifting graphs, see Section 1.3.
FIGURE 5
SOLUTION First we reflect the graph of y ! 2x [shown in Figures 2 and 5(a)] about the x-axis to get the graph of y ! !2x in Figure 5(b). Then we shift the graph of y ! !2x upward 3 units to obtain the graph of y ! 3 ! 2x in Figure 5(c). The domain is ! and the range is #!(, 3$.
y y
y y
y
|
|
|
|
|
|
|
y=3 |
|
1 |
|
|
|
|
|
2 |
|
|
|
|
|
|
|
|
|
|
|
|
|
|
|
|
|
|
|
|
0 |
x |
0 |
x |
0 |
x |
|||
|
|
|
_1 |
|
|
|
|
|
(a) y=2¨ |
|
|
(b) y=_2¨ |
|
|
(c) y=3-2¨ |
|
M |
V EXAMPLE 2 Use a graphing device to compare the exponential function f #x$ ! 2x and the power function t#x$ ! x2. Which function grows more quickly when x is large?
SOLUTION Figure 6 shows both functions graphed in the viewing rectangle !!2, 6" by !0, 40". We see that the graphs intersect three times, but for x & 4 the graph of

N Example 2 shows that y ! 2x increases more quickly than y ! x 2. To demonstrate just how quickly f #x$ ! 2x increases, let’s perform the following thought experiment. Suppose we start with a piece of paper a thousandth of an inch thick and we fold it in half 50 times. Each time we fold the paper in half, the thickness of the paper doubles, so the thickness of the resulting paper would be 250&1000 inches. How thick do you think that is? It works out to be more than 17 million miles!
|
TABLE 1 |
|
|
|
|
|
|
Population |
Year |
|
(millions) |
|
|
|
1900 |
|
1650 |
1910 |
|
1750 |
1920 |
|
1860 |
1930 |
|
2070 |
1940 |
|
2300 |
1950 |
|
2560 |
1960 |
|
3040 |
1970 |
|
3710 |
1980 |
|
4450 |
1990 |
|
5280 |
2000 |
|
6080 |
|
|
|
SECTION 1.5 EXPONENTIAL FUNCTIONS |||| 55
f #x$ ! 2x stays above the graph of t#x$ ! x2. Figure 7 gives a more global view and shows that for large values of x, the exponential function y ! 2x grows far more rapidly than the power function y ! x2.
|
40 |
y=≈ |
250 |
|
|
y=2¨ |
|
y=2¨ |
|
|
|
|
|
y=≈ |
_2 |
0 |
6 |
0 |
8 |
|
|
|
|
|
FIGURE 6 |
|
FIGURE 7 |
M |
|
APPLICATIONS OF EXPONENTIAL FUNCTIONS
The exponential function occurs very frequently in mathematical models of nature and society. Here we indicate briefly how it arises in the description of population growth. In Chapter 3 we will pursue these and other applications in greater detail.
First we consider a population of bacteria in a homogeneous nutrient medium. Suppose that by sampling the population at certain intervals it is determined that the population doubles every hour. If the number of bacteria at time t is p#t$, where t is measured in hours, and the initial population is p#0$ ! 1000, then we have
p#1$ ! 2p#0$ ! 2 ) 1000 p#2$ ! 2p#1$ ! 22 ) 1000 p#3$ ! 2p#2$ ! 23 ) 1000
It seems from this pattern that, in general,
p#t$ ! 2t ) 1000 ! #1000$2t
This population function is a constant multiple of the exponential function y ! 2t, so it exhibits the rapid growth that we observed in Figures 2 and 7. Under ideal conditions (unlimited space and nutrition and freedom from disease) this exponential growth is typical of what actually occurs in nature.
What about the human population? Table 1 shows data for the population of the world in the 20th century and Figure 8 shows the corresponding scatter plot.
P
6x10'
1900 |
1920 |
1940 |
1960 |
1980 |
2000 |
t |
||||||||||
FIGURE 8 Scatter plot for world population growth

56 |||| CHAPTER 1 FUNCTIONS AND MODELS
The pattern of the data points in Figure 8 suggests exponential growth, so we use a graphing calculator with exponential regression capability to apply the method of least squares and obtain the exponential model
P ! #0.008079266$ ! #1.013731$t
FIGURE 9
Exponential model for population growth
Figure 9 shows the graph of this exponential function together with the original data points. We see that the exponential curve fits the data reasonably well. The period of relatively slow population growth is explained by the two world wars and the Great Depres-
sion of the 1930s.
P
6x10'
1900 |
1920 |
1940 |
1960 |
1980 |
2000 |
t |
||||||||||||
THE NUMBER e
y y=«
m=1
1
0x
FIGURE 12
The natural exponential function crosses the y-axis with a slope of 1.
Of all possible bases for an exponential function, there is one that is most convenient for the purposes of calculus. The choice of a base a is influenced by the way the graph of y ! ax crosses the y-axis. Figures 10 and 11 show the tangent lines to the graphs of y ! 2x and y ! 3x at the point #0, 1$. (Tangent lines will be defined precisely in Section 2.7. For present purposes, you can think of the tangent line to an exponential graph at a point as the line that touches the graph only at that point.) If we measure the slopes of these tangent lines at #0, 1$, we find that m ' 0.7 for y ! 2x and m ' 1.1 for y ! 3x.
|
y |
|
y=2¨ |
|
y |
|
y=3¨ |
||
|
|
|
|||||||
|
|
|
m•0.7 |
|
|
|
m•1.1 |
||
1 |
|
1 |
|
|
|
||||
|
|
|
|
|
|
||||
|
|
|
|
|
|
|
|
|
|
0 |
|
x |
0 |
|
x |
||||
FIGURE 10 |
|
|
|
FIGURE 11 |
|
|
|
||
|
|
|
|
|
|
||||
It turns out, as we will see in Chapter 3, that some of the formulas of calculus will be greatly simplified if we choose the base a so that the slope of the tangent line to y ! ax at
#0, 1$ is exactly 1. (See Figure 12.) In fact, there is such a number and it is denoted by the letter e. (This notation was chosen by the Swiss mathematician Leonhard Euler in 1727, probably because it is the first letter of the word exponential.) In view of Figures 10 and 11, it comes as no surprise that the number e lies between 2 and 3 and the graph of y ! ex lies between the graphs of y ! 2x and y ! 3x. (See Figure 13.) In Chapter 3 we will see that the value of e, correct to five decimal places, is
e ' 2.71828

TEC Module 1.5 enables you to graph exponential functions with various bases and their tangent lines in order to estimate more closely the value of a for which the tangent has slope 1.
FIGURE 13
SECTION 1.5 EXPONENTIAL FUNCTIONS |||| 57
y y=3¨
y=3¨
 y=2¨
y=2¨
y=e¨
1
0 |
x |
|
|
|
|
|
|
|
|
EXAMPLE 3 Graph the function y ! 21 e!x |
! 1 and state the domain and range. |
|
|
||||||||||||||||||
|
|
|
|
|
|
|
V |
|
|
||||||||||||||||||||
|
|
|
|
|
|
|
|
|
|
||||||||||||||||||||
|
|
|
|
|
|
|
SOLUTION |
We start with the graph of y ! ex from Figures 12 and 14(a) and reflect about |
|||||||||||||||||||||
|
|
|
|
|
|
|
the y-axis to get the graph of y ! e!x in Figure 14(b). (Notice that the graph crosses the |
||||||||||||||||||||||
|
|
|
|
|
|
|
y-axis with a slope of !1). Then we compress the graph vertically by a factor of 2 to |
||||||||||||||||||||||
|
|
|
|
|
|
|
obtain the graph of y ! 21 e!x in Figure 14(c). Finally, we shift the graph downward one |
||||||||||||||||||||||
|
|
|
|
|
|
|
unit to get the desired graph in Figure 14(d). The domain is ! and the range is #!1, ($. |
||||||||||||||||||||||
|
y |
|
|
|
|
|
|
y |
|
|
|
|
y |
|
|
|
|
y |
|
|
|
|
|||||||
|
|
|
|
|
|
|
|
|
|
|
|
|
|||||||||||||||||
1 |
|
|
|
|
1 |
|
|
|
|
1 |
|
|
|
|
|
|
|
|
1 |
|
|
|
|
|
|
|
|||
|
|
|
|
|
|
|
|
|
|
|
|
|
|
|
|
||||||||||||||
|
|
|
|
|
|
|
|
|
|
|
|
|
|
|
|
|
|
|
|
|
|
|
|
|
|
|
|
|
|
0 |
|
|
x |
0 |
|
|
x |
0 |
|
|
|
|
|
x |
0 |
|
|
|
|
x |
|||||||||
|
|
|
|
|
|
|
|
|
|
|
|
|
|
|
|
|
|
|
|
|
|
y=_1 |
|
|
|
|
|||
|
|
|
|
|
|
|
|
|
|
|
|
|
|
|
|
|
|
|
|
|
|
|
|
|
|
||||
|
(a) y=« |
|
|
|
(b) y=eШ |
(c) y= |
1 |
eШ |
|
|
(d) y= |
1 |
eШ-1 |
|
|
||||||||||||||
|
|
|
|
|
|
|
|||||||||||||||||||||||
|
|
2 |
|
|
2 |
|
|
||||||||||||||||||||||
FIGURE 14 |
|
|
|
|
|
|
|
|
|
|
|
|
|
|
|
|
|
|
|
|
|
|
|
|
|
M |
|||
How far to the right do you think we would have to go for the height of the graph of y ! ex to exceed a million? The next example demonstrates the rapid growth of this function by providing an answer that might surprise you.
EXAMPLE 4 Use a graphing device to find the values of x for which ex & 1,000,000.
SOLUTION In Figure 15 we graph both the function y ! ex and the horizontal line
y ! 1,000,000. We see that these curves intersect when x ' 13.8. Thus ex & 106 when x & 13.8. It is perhaps surprising that the values of the exponential function have already surpassed a million when x is only 14.
1.5x10^
y=10^
y=«
FIGURE 15 |
0 |
15 |
M |

58|||| CHAPTER 1 FUNCTIONS AND MODELS
1.5EXERCISES
1.(a) Write an equation that defines the exponential function with base a & 0.
(b)What is the domain of this function?
(c)If a " 1, what is the range of this function?
(d)Sketch the general shape of the graph of the exponential function for each of the following cases.
(i) a & 1 |
(ii) a ! 1 |
(iii) 0 |
$ a $ 1 |
2.(a) How is the number e defined?
(b)What is an approximate value for e?
(c)What is the natural exponential function?
;3–6 Graph the given functions on a common screen. How are these graphs related?
3. |
y ! 2x, y ! ex, y ! 5x, y ! 20x |
||||
4. |
y ! ex, |
y ! e!x, |
y ! 8x, y ! 8!x |
||
5. |
y ! 3x, |
y ! 10x, |
y ! (31 )x, y ! ( |
1 |
)x |
10 |
|||||
6. |
y ! 0.9x, y ! 0.6x, y ! 0.3x, y ! 0.1x |
||||
|
|
|
|
|
|
17–18 Find the exponential function f #x$ ! Cax whose graph is given.
17.y
(3,!24)
(1,!6)
0 |
x |
18.y
2
Ó2,! 29 Õ
0 |
x |
7–12 Make a rough sketch of the graph of the function. Do not use a calculator. Just use the graphs given in Figures 3 and 12 and, if necessary, the transformations of Section 1.3.
7. |
y ! 4x ! 3 |
8. |
y ! 4x!3 |
9. |
y ! !2!x |
10. |
y ! 1 " 2ex |
11. |
y ! 1 ! 21 e!x |
12. |
y ! 2#1 ! ex $ |
|
|
|
|
13.Starting with the graph of y ! ex, write the equation of the graph that results from
(a)shifting 2 units downward
(b)shifting 2 units to the right
(c)reflecting about the x-axis
(d)reflecting about the y-axis
(e)reflecting about the x-axis and then about the y-axis
14.Starting with the graph of y ! ex, find the equation of the graph that results from
(a)reflecting about the line y ! 4
(b)reflecting about the line x ! 2
15–16 Find the domain of each function. |
|
|
|
|
|||||
|
|
1 |
|
|
1 |
|
|
||
15. |
(a) |
f #x$ ! |
|
(b) |
f #x$ ! |
|
|
||
1 " ex |
1 ! ex |
||||||||
16. |
(a) |
t#t$ ! sin#e!t $ |
(b) |
t#t$ ! s |
|
|
|
||
1 ! 2t |
|||||||||
|
|
|
|
|
|
|
|
|
|
19. If f #x$ ! 5x, show that |
|
( |
|
) |
|
|
h |
|
h |
||
|
f (x " h) ! f (x) |
! 5x |
|
5h ! 1 |
|
|
|
|
|
|
|
20.Suppose you are offered a job that lasts one month. Which of the following methods of payment do you prefer?
I.One million dollars at the end of the month.
II.One cent on the first day of the month, two cents on the second day, four cents on the third day, and, in general, 2n!1 cents on the nth day.
21. Suppose the graphs of f #x$ ! x2 and t#x$ ! 2x are drawn on a coordinate grid where the unit of measurement is 1 inch. Show that, at a distance 2 ft to the right of the origin, the height of the graph of f is 48 ft but the height of the graph of t is about 265 mi.
;22. Compare the functions f #x$ ! x5 and t#x$ ! 5x by graphing both functions in several viewing rectangles. Find all points of intersection of the graphs correct to one decimal place.
Which function grows more rapidly when x is large?
;23. Compare the functions f #x$ ! x10 and t#x$ ! ex by graphing both f and t in several viewing rectangles. When does the graph of t finally surpass the graph of f ?
;24. Use a graph to estimate the values of x such that
ex & 1,000,000,000.