


|
|
|
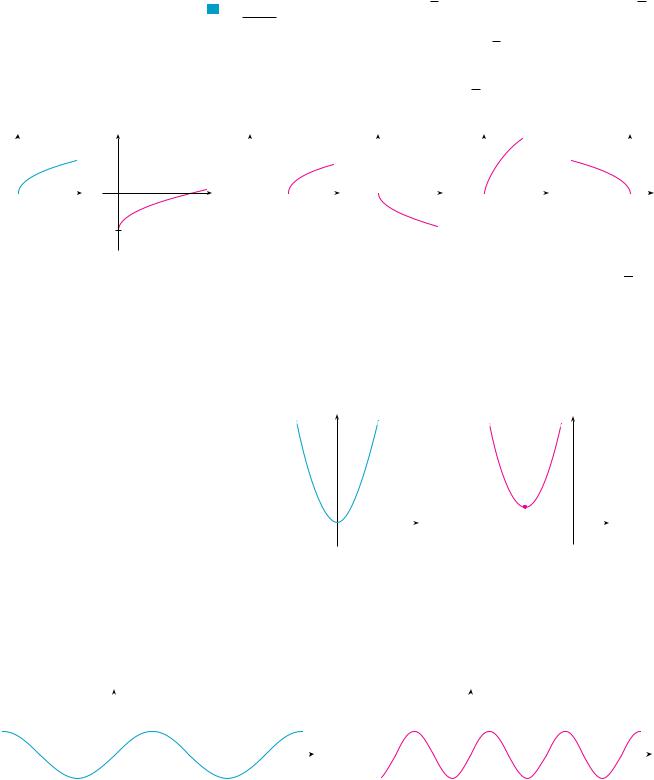
|
|
|
|
|
|
|
|
|
SECTION 1.3 NEW FUNCTIONS FROM OLD FUNCTIONS |||| 37 |
||||
;24. A study by the US Office of Science and Technology in |
;26. The table shows the mean (average) distances d of the planets |
|||||||||||||||
|
1972 estimated the cost (in 1972 dollars) to reduce auto- |
from the sun (taking the unit of measurement to be the |
||||||||||||||
|
mobile emissions by certain percentages: |
|
|
|
|
distance from the earth to the sun) and their periods T (time |
||||||||||
|
|
|
|
|
|
|
|
|
|
|
|
of revolution in years). |
|
|
|
|
|
Reduction in |
Cost per |
|
Reduction in |
|
Cost per |
|
|
|
|||||||
|
|
|
|
|
|
|
|
|||||||||
|
emissions (%) |
car (in $) |
|
emissions (%) |
|
car (in $) |
|
|
|
|
|
|||||
|
Planet |
d |
T |
|
||||||||||||
|
|
|
|
|
|
|
|
|
|
|
|
|
|
|||
|
50 |
|
45 |
75 |
|
|
|
90 |
|
|
||||||
|
|
|
|
|
|
|
|
|
|
|||||||
|
|
Mercury |
0.387 |
0.241 |
|
|||||||||||
|
55 |
|
55 |
80 |
|
|
|
100 |
|
|
||||||
|
|
|
|
|
|
Venus |
0.723 |
0.615 |
|
|||||||
|
60 |
|
62 |
85 |
|
|
|
200 |
|
|
||||||
|
65 |
|
70 |
90 |
|
|
|
375 |
|
Earth |
1.000 |
1.000 |
|
|||
|
70 |
|
80 |
95 |
|
|
|
600 |
|
Mars |
1.523 |
1.881 |
|
|||
|
|
|
|
|
|
|
|
|
|
|
|
|
Jupiter |
5.203 |
11.861 |
|
|
Find a model that captures the “diminishing returns” trend of |
|
|
|||||||||||||
|
|
Saturn |
9.541 |
29.457 |
|
|||||||||||
|
these data. |
|
|
|
|
|
|
|
|
|
|
|||||
|
|
|
|
|
|
|
|
|
|
Uranus |
19.190 |
84.008 |
|
|||
;25. Use the data in the table to model the population of the world |
|
|
||||||||||||||
|
Neptune |
30.086 |
164.784 |
|
||||||||||||
|
in the 20th century by a cubic function. Then use your model |
|
|
|
|
|
||||||||||
|
to estimate the population in the year 1925. |
|
|
|
|
|
|
|
|
|
||||||
|
|
|
|
|
|
|
|
|
|
|
|
|
||||
|
|
|
|
Population |
|
|
|
Population |
|
(a) Fit a power model to the data. |
|
|
||||
|
|
Year |
|
(millions) |
|
Year |
|
(millions) |
|
(b) Kepler’s Third Law of Planetary Motion states that |
||||||
|
1900 |
|
1650 |
|
1960 |
|
|
3040 |
|
“The square of the period of revolution of a planet is |
||||||
|
1910 |
|
1750 |
|
1970 |
|
|
3710 |
|
|||||||
|
1920 |
|
1860 |
|
1980 |
|
|
4450 |
|
proportional to the cube of its mean distance from the |
||||||
|
1930 |
|
2070 |
|
1990 |
|
|
5280 |
|
sun.” |
|
|
|
|||
|
1940 |
|
2300 |
|
2000 |
|
|
6080 |
|
|
|
|
|
|
||
|
1950 |
|
2560 |
|
|
|
|
|
|
|
Does your model corroborate Kepler’s Third Law? |
|||||
|
|
|
|
|
|
|
|
|
|
|
|
|
|
|
|
|
 1.3 NEW FUNCTIONS FROM OLD FUNCTIONS
In this section we start with the basic functions we discussed in Section 1.2 and obtain new functions by shifting, stretching, and reflecting their graphs. We also show how to combine pairs of functions by the standard arithmetic operations and by composition.
TRANSFORMATIONS OF FUNCTIONS
By applying certain transformations to the graph of a given function we can obtain the graphs of certain related functions. This will give us the ability to sketch the graphs of many functions quickly by hand. It will also enable us to write equations for given graphs. Let’s first consider translations. If c is a positive number, then the graph of y ! f !x" % c is just the graph of y ! f !x" shifted upward a distance of c units (because each y-coordinate is increased by the same number c). Likewise, if t!x" ! f !x $ c", where c ! 0, then the value of t at x is the same as the value of f at x $ c (c units to the left of x). Therefore, the graph of y ! f !x $ c" is just the graph of y ! f !x" shifted c units to the right (see Figure 1).
VERTICAL AND HORIZONTAL SHIFTS Suppose c ! 0. To obtain the graph of y ! f !x" % c, shift the graph of y ! f !x" a distance c units upward
y ! f !x" $ c, shift the graph of y ! f !x" a distance c units downward y ! f !x $ c", shift the graph of y ! f !x" a distance c units to the right y ! f !x % c", shift the graph of y ! f !x" a distance c units to the left

38 |||| CHAPTER 1 FUNCTIONS AND MODELS |
|
|
|
|
||||||
|
y |
|
|
|
y=Ä+c |
y |
|
y=cÄ |
|
|
|
|
|
|
|
||||||
|
|
|
|
|
|
|
|
|||
|
|
|
|
|
|
|
|
|
(c>1) |
|
|
|
|
y=f(x+c) |
c y =Ä |
y=f(x-c) |
y=f(_x) |
|
y=Ä |
|
|
|
|
|
|
|
|
|
|
|
|
|
|
|
|
c |
c |
|
|
|
|
y= 1c Ä |
|
|
|
|
|
|
|
|
|
|
|
x |
0 |
|
|
c |
x |
0 |
|
|
|||
|
|
|
|
|
y=Ä-c |
|
|
|
|
|
|
|
|
|
|
|
|
|
|
y=_Ä |
|
|
|
|
|
|
|
|
|
|
|
|
|
FIGURE 1 |
|
|
|
FIGURE 2 |
|
||||
|
Translating the graph of ƒ |
|
|
|
Stretching and reflecting the graph of ƒ |
|
||||
|
|
|
|
|
Now let’s consider the stretching and reflecting transformations. If c ! 1, then the |
|||||
|
|
|
|
|
graph of y ! cf !x" is the graph of y ! f !x" stretched by a factor of c in the vertical |
|||||
|
|
|
|
|
direction (because each y-coordinate is multiplied by the same number c). The graph of |
|||||
|
|
|
|
|
y ! $f !x" is the graph of y ! f !x" reflected about the x-axis because the point !x, y" is |
|||||
|
|
|
|
|
replaced by the point !x, $y". (See Figure 2 and the following chart, where the results of |
|||||
|
|
|
|
|
other stretching, compressing, and reflecting transformations are also given.) |
|
||||
|
|
|
|
|
|
|
||||
|
|
|
|
|
VERTICAL AND HORIZONTAL STRETCHING AND REFLECTING Suppose c ! 1. To |
|
||||
|
|
|
|
|
obtain the graph of |
|
|
|
|
|
|
|
|
|
|
y ! cf !x", stretch the graph of y ! f !x" vertically by a factor of c |
|
||||
|
|
|
|
|
y ! !1$c" f !x", compress the graph of y ! f !x" vertically by a factor of c |
|
||||
|
|
|
|
|
y ! f !cx", compress the graph of y ! f !x" horizontally by a factor of c |
|
||||
|
|
|
|
|
y ! f !x$c", stretch the graph of y ! f !x" horizontally by a factor of c |
|
||||
|
|
|
|
|
y ! $f !x", reflect the graph of y ! f !x" about the x-axis |
|
||||
|
|
|
|
|
y ! f !$x", reflect the graph of y ! f !x" about the y-axis |
|
||||
|
|
|
|
|
|
|
|
|
|
|
Figure 3 illustrates these stretching transformations when applied to the cosine function with c ! 2. For instance, in order to get the graph of y ! 2 cos x we multiply the y-coor- dinate of each point on the graph of y ! cos x by 2. This means that the graph of y ! cos x gets stretched vertically by a factor of 2.
|
y |
|
|
|
|
y=2!cos!x |
|
|
|
|
|
|
|
y |
|
|
|
|
|
|
1 |
|
|
|
|
|
|
|
|
|
|
|
|
||||||
|
|
|
|
|
|
|
|
|
|
|
|
|
|
|
|
|
|
|
|
|
|
|
|
|
|
|
|
|
|||||||||||
2 |
|
|
|
|
|
y=cos!x |
|
|
|
|
|
|
|
2 |
|
|
y=cos! |
x |
|||||||||||||||||||||
|
|
|
|
|
|
|
|
|
2 |
||||||||||||||||||||||||||||||
|
|
|
|
|
|
|
|
|
|
|
|
|
|
||||||||||||||||||||||||||
1 |
|
|
|
1 |
|
|
|
|
|
|
|
|
|
1 |
|
|
|
|
|
|
|
|
|
|
|
|
|
|
|
|
|
|
|
|
|||||
|
|
|
|
|
|
|
|
|
|
|
|
|
|
|
|
|
|
|
|
|
|
|
|
|
|
|
|||||||||||||
|
|
|
|
|
|
|
y=2!!cos!x |
|
|
|
|
|
|
|
|
|
|
|
|
|
|
|
|
|
|
|
|
|
|
|
|
|
|
|
|
||||
|
|
|
|
|
|
|
|
|
|
|
|
|
|
|
|
|
|
|
|
|
|
|
|
|
|
|
|
|
|
|
|
|
|
|
|||||
|
|
|
|
|
|
|
|
|
|
|
|
|
|
|
|
|
|
|
|
|
|
|
|
|
|
|
|
|
|
|
|
|
|
|
|
|
|
|
|
0 |
|
|
|
1 |
|
|
|
|
|
|
|
|
|
x |
0 |
|
|
|
|
|
|
|
|
|
|
|
|
|
|
|
|
|
x |
||||||
|
|
|
|
|
|
|
|
|
|
|
|
|
|
|
|
|
|
|
|
|
|
|
|
|
|
|
|
|
|
|
|
|
|
|
|
|
|
|
|
|
|
|
|
|
|
|
|
|
|
|
|
|
|
|
|
|
|
|
|
|
|
|
|
|
|
|
|
y= |
|
cos!x |
|||||||||
|
|
|
|
|
|
|
|
|
|
|
|
|
|
|
|
|
|
|
|
|
|
|
|
|
|
|
|
|
|||||||||||
|
|
|
|
|
|
|
|
|
|
|
|
|
|
|
|
|
|
|
|
|
|
|
|
|
|
|
|||||||||||||
|
|
|
|
|
|
|
|
|
|
|
|
|
|
|
|
|
|
|
|
|
|
|
|
|
|
|
|
|
|
|
|
|
|
|
|
|
|
|
|
FIGURE 3 |
|
|
|
|
|
|
|
|
|
|
|
|
|
|
|
|
|
|
|
y=cos!2x |
|||||||||||||||||||
SECTION 1.3 NEW FUNCTIONS FROM OLD FUNCTIONS |||| 39
y |
|
|
|
|
y |
||||
|
|
|
|||||||
1 |
|
|
|
|
|
|
|
|
|
|
|
|
|
|
|
|
|
|
|
|
|
|
|
|
|
|
|
||
0 |
|
1 |
x |
0 |
|||||
|
|
|
|
|
|
|
|
|
_2 |
|
|
|
|
|
|
|
|
|
|
V EXAMPLE 1 Given the graph of y ! sx , use transformations to graph y ! sx $ 2, y ! sx $ 2 , y ! $sx , y ! 2sx , and y ! s$x .
SOLUTION The graph of the square root function y ! sx , obtained from Figure 13(a) in Section 1.2, is shown in Figure 4(a). In the other parts of the figure we sketch
y ! sx $ 2 by shifting 2 units downward, y ! sx $ 2 by shifting 2 units to the right, y ! $sx by reflecting about the x-axis, y ! 2sx by stretching vertically by a factor of 2, and y ! s$x by reflecting about the y-axis.
x |
y |
|
|
|
|
y |
|
|
y |
|
|
y |
|
|
|
|
|
|
|
|
|
|
|
|
|||||
|
|
|
|
|
|
|
|
|
|
|
|
|
|
|
0 |
2 |
x |
0 |
x |
0 |
x |
0 |
|
x |
|||||
|
|
|
|
|
|
|
|
|
|
|
|
|
|
|
(a) y=Ïãx (b) y=Ïãx-2 (c) y=Пггггx-2 (d) y=_Ïãx (e) y=2Ïãx (f) y=Ïããx M
FIGURE 4
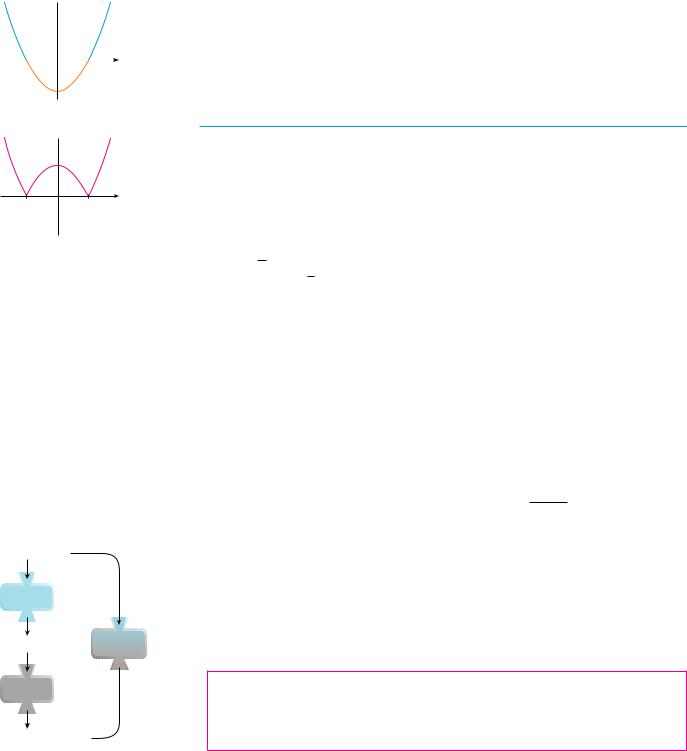
EXAMPLE 2 Sketch the graph of the function f (x) ! x2 % 6x % 10.
SOLUTION Completing the square, we write the equation of the graph as y ! x2 % 6x % 10 ! !x % 3"2 % 1
This means we obtain the desired graph by starting with the parabola y ! x2 and shifting 3 units to the left and then 1 unit upward (see Figure 5).
y |
y |
|
|
|
(_3,!1) |
1 |
|
|
|
|
||||||
|
|
|
|
|
|
|
||||||||
|
|
|
|
|
|
|
|
|
|
|
|
|
|
|
0 |
x |
|
_ |
|
3 |
|
_ |
|
1 0 |
x |
||||
FIGURE 5 |
(a) y=≈ |
(b) y=(x+3)@+1 |
M |
|
|
|
|
|
|
|
|
|
|
|
|
|
|
|
|
|
EXAMPLE 3 Sketch the graphs of the following functions. |
|
|
|
|
|
|
|||||||||||||||||||||||
|
|
|
|
|
|
|
|
|
|
|
|
|
|
(a) |
|
y ! sin 2x |
|
|
|
|
|
(b) y ! 1 |
$ sin x |
|
|
|
|
|
|
||||||||||||||
|
|
|
|
|
|
|
|
|
|
|
|
|
|
SOLUTION |
|
|
|
|
|
|
|
|
|
|
|
|
|
|
|
|
|
|
|
|
|
|
|
||||||
|
|
|
|
|
|
|
|
|
|
|
|
|
|
(a) |
|
We obtain the graph of y ! sin 2x from that of y ! sin x by compressing horizon- |
|||||||||||||||||||||||||||
|
|
|
|
|
|
|
|
|
|
|
|
|
|
tally by a factor of 2 (see Figures 6 and 7). Thus, whereas the period of y ! sin x is 2', |
|||||||||||||||||||||||||||||
|
|
|
|
y |
|
|
|
|
|
|
|
|
the period of y ! sin 2x is 2'$2 ! |
'. |
|
|
|
|
|
y |
|
|
|
|
|
|
|
|
|
|
|
|
|
|
|||||||||
|
|
|
|
|
|
|
|
|
|
y=sin!x |
|
|
|
|
|
|
|
|
|
|
|
|
|
|
|
|
|
|
y=sin!2x |
|
|
|
|||||||||||
|
|
|
|
|
|
|
|
|
|
|
|
|
|
||||||||||||||||||||||||||||||
1 |
|
|
|
|
|
|
|
|
|
|
|
|
|
1 |
|
|
|
|
|
|
|
|
|
||||||||||||||||||||
|
|
|
|
|
|
|
|
|
|
|
|
|
|
|
|
|
|
|
|||||||||||||||||||||||||
|
|
|
|
|
|
|
|
|
|
|
|
|
|
|
|
|
|
|
|
|
|
|
|
|
|
|
|
|
|
|
|
|
|
|
|
|
|
|
|
|
|
|
|
|
|
|
|
|
|
|
0 |
π |
π |
|
|
|
x |
|
|
|
|
|
|
|
|
|
|
0 π |
π |
π |
|
x |
|||||||||||||||
|
|
|
|
|
|
|
|
|
2 |
|
|
|
|
|
|
|
|
|
|
|
|
|
|
|
|
|
|
|
4 |
2 |
|
|
|
|
|
|
|||||||
|
|
|
|
|
|
|
|
|
|
|
|
|
|
|
|
|
|
|
|
|
|
|
|
|
|
|
|
|
|
|
|
|
|
|
|
|
|
|
|
|
|
|
|
FIGURE 6 |
FIGURE 7 |

40|||| CHAPTER 1 FUNCTIONS AND MODELS
(b)To obtain the graph of y ! 1 " sin x, we again start with y ! sin x. We reflect about the x-axis to get the graph of y ! "sin x and then we shift 1 unit upward to get y ! 1 " sin x. (See Figure 8.)
y
2 y=1-sin x
1
0 |
π |
π 3π 2π |
x |
FIGURE 8 |
2 |
2 |
M |
|
|
|
EXAMPLE 4 Figure 9 shows graphs of the number of hours of daylight as functions of the time of the year at several latitudes. Given that Philadelphia is located at approximately 40&N latitude, find a function that models the length of daylight at Philadelphia.
FIGURE 9
Graph of the length of daylight from March 21 through December 21 at various latitudes
Lucia C. Harrison, Daylight, Twilight, Darkness and Time
(New York: Silver, Burdett, 1935) page 40.
20
18
16
14
12
Hours 10
8
6
4
2
0 Mar. Apr. May June July Aug. Sept. Oct. Nov. Dec.
20¡!N
30¡!N 40¡!N
50¡!N
60¡!N
SOLUTION Notice that each curve resembles a shifted and stretched sine function. By looking at the blue curve we see that, at the latitude of Philadelphia, daylight lasts about 14.8 hours on June 21 and 9.2 hours on December 21, so the amplitude of the curve (the factor by which we have to stretch the sine curve vertically) is 12 !14.8 " 9.2" ! 2.8.
By what factor do we need to stretch the sine curve horizontally if we measure the time t in days? Because there are about 365 days in a year, the period of our model should be 365. But the period of y ! sin t is 2%, so the horizontal stretching factor is c ! 2%&365.
We also notice that the curve begins its cycle on March 21, the 80th day of the year, so we have to shift the curve 80 units to the right. In addition, we shift it 12 units upward. Therefore we model the length of daylight in Philadelphia on the tth day of the year by the function
L!t" ! 12 |
$ 2.8 sin$ |
2% |
!t " 80"% |
M |
365 |
Another transformation of some interest is taking the absolute value of a function. If y ! # f !x"#, then according to the definition of absolute value, y ! f !x" when f !x" # 0 and y ! "f !x" when f !x" ! 0. This tells us how to get the graph of y ! # f !x"# from the graph of y ! f !x": The part of the graph that lies above the x-axis remains the same; the part that lies below the x-axis is reflected about the x-axis.
y 
|
|
|
|
|
|
_1 0 |
1 |
x |
|||
(a)y=≈-1 y
_1 0 1 x
(b) y=|!≈-1!|
FIGURE 10
x (input)
g
© |
f ¥ g |
f
f{©} (output)
FIGURE 11
SECTION 1.3 NEW FUNCTIONS FROM OLD FUNCTIONS |||| 41
|
EXAMPLE 5 Sketch the graph of the function y ! # x |
2 |
" 1 |
#. |
|
V |
|||||
|
SOLUTION We first graph the parabola y ! x2 " 1 in Figure 10(a) by shifting the parabola
y ! x2 downward 1 unit. We see that the graph lies below the x-axis when "1 ! x ! 1, |
|
so we reflect that part of the graph about the x-axis to obtain the graph of y ! |
# x2 " 1# |
in Figure 10(b). |
M |
COMBINATIONS OF FUNCTIONS
Two functions f and t can be combined to form new functions f $ t, f " t, ft, and f&t in a manner similar to the way we add, subtract, multiply, and divide real numbers. The sum and difference functions are defined by
! f $ t"!x" ! f !x" $ t!x" ! f " t"!x" ! f !x" " t!x"
If the domain of f is A and the domain of t is B, then the domain of f $ t is the intersection A # B because both f !x" and t!x" have to be defined. For example, the domain of
f !x" ! sx is A ! +0, '" and the domain of t!x" ! s2 " x is B ! !"', 2,, so the domain of ! f $ t"!x" ! sx $ s2 " x is A # B ! +0, 2,.
Similarly, the product and quotient functions are defined by
! ft"!x" ! f !x"t!x" |
) |
f |
*!x" ! |
f !x" |
t |
t!x" |
The domain of ft is A # B, but we can’t divide by 0 and so the domain of f&t is 'x " A # B # t!x" " 0(. For instance, if f !x" ! x2 and t!x" ! x " 1, then the domain of the rational function ! f&t"!x" ! x2&!x " 1" is ' x # x " 1(, or !"', 1" ! !1, '".
There is another way of combining two functions to obtain a new function. For example, suppose that y ! f !u" ! su and u ! t!x" ! x2 $ 1. Since y is a function of u and u is, in turn, a function of x, it follows that y is ultimately a function of x. We compute this by substitution:
y ! f !u" ! f ! t!x"" ! f !x2 $ 1" ! sx2 $ 1
The procedure is called composition because the new function is composed of the two given functions f and t.
In general, given any two functions f and t, we start with a number x in the domain of t and find its image t!x". If this number t!x" is in the domain of f, then we can calculate the value of f ! t!x"". The result is a new function h!x" ! f ! t!x"" obtained by substituting t into f. It is called the composition (or composite) of f and t and is denoted by f ! t (“f circle t”).
DEFINITION Given two functions f and t, the composite function f ! t (also called the composition of f and t) is defined by
! f ! t"!x" ! f ! t!x""
The f!¥!g machine is composed of the g machine (first) and then the f machine.
The domain of f ! t is the set of all x in the domain of t such that t!x" is in the domain of f. In other words, ! f ! t"!x" is defined whenever both t!x" and f ! t!x"" are defined. Figure 11 shows how to picture f ! t in terms of machines.
42 |||| CHAPTER 1 FUNCTIONS AND MODELS
EXAMPLE 6 If f !x" ! x2 and t!x" ! x " 3, find the composite functions f ! t and t ! f.
SOLUTION We have
|
|
|
|
|
|
|
|
|
|
! f ! t"!x" ! f ! t!x"" ! f !x " 3" ! !x " 3"2 |
|
||||||||||||||||||||||||||||||||||||
|
|
|
|
|
|
|
|
|
|
! t ! f "!x" ! t! f !x"" ! t!x2 " ! x2 " 3 |
M |
||||||||||||||||||||||||||||||||||||
|
| |
|
|
|
|
You can see from Example 6 that, in general, f ! t " t ! f . Remember, the |
|||||||||||||||||||||||||||||||||||||||||
|
|
|
|
N OT E |
|||||||||||||||||||||||||||||||||||||||||||
|
|
notation f ! t means that the function t is applied first and then f is applied second. In |
|||||||||||||||||||||||||||||||||||||||||||||
|
|
Example 6, f ! t is the function that first subtracts 3 and then squares; t ! f is the function |
|||||||||||||||||||||||||||||||||||||||||||||
|
|
that first squares and then subtracts 3. |
|
|
|
|
|
|
|
|
|
|
|
|
|
|
|
|
|
|
|
|
|
|
|
|
|
|
|
|
|
|
|
|
|
|
|||||||||||
|
|
|
EXAMPLE 7 If f !x" ! s |
|
and t!x" ! s |
|
, find each function and its domain. |
|
|||||||||||||||||||||||||||||||||||||||
|
x |
2 " x |
|
||||||||||||||||||||||||||||||||||||||||||||
|
|
V |
|
||||||||||||||||||||||||||||||||||||||||||||
|
|
(a) |
f ! t |
(b) t ! f |
(c) f ! f |
|
|
(d) t ! t |
|
||||||||||||||||||||||||||||||||||||||
|
|
SOLUTION |
|
|
|
|
|
|
|
|
|
|
|
|
|
|
|
|
|
|
|
|
|
|
|
|
|
|
|
|
|
|
|
|
|
|
|
|
|
|
|||||||
|
|
|
|
|
|
|
|
|
|
! f ! t"!x" ! f ! t!x"" ! f (s |
|
|
) ! s |
|
|
! s |
|
|
|
||||||||||||||||||||||||||||
|
|
(a) |
|
|
|
|
|
|
|
|
s |
|
|
||||||||||||||||||||||||||||||||||
|
|
|
|
|
|
2 " x |
2 " x |
2 " x |
|
||||||||||||||||||||||||||||||||||||||
|
|
|
|
|
|
|
|
|
|
|
|
|
|
|
|
|
|
|
4 |
|
|
|
|
|
|
||||||||||||||||||||||
|
|
The domain of f ! t is 'x # 2 " x # 0( ! 'x # x ( 2( ! !"', 2,. |
|
||||||||||||||||||||||||||||||||||||||||||||
|
|
|
|
|
|
|
|
|
|
! t ! f "!x" ! t! f !x"" ! t(s |
|
) ! s |
|
|
|
|
|
|
|
||||||||||||||||||||||||||||
|
|
(b) |
|
|
|
|
|
x |
2 " s |
x |
|
|
|
|
|||||||||||||||||||||||||||||||||
|
|
For s |
|
to be defined we must have x # 0. For s |
|
|
|
|
|
|
|
|
|
|
|
|
|
|
|
||||||||||||||||||||||||||||
|
2 " s |
|
|
to be defined we must have |
|
||||||||||||||||||||||||||||||||||||||||||
|
x |
x |
|
||||||||||||||||||||||||||||||||||||||||||||
If 0 ( a ( b, then a 2 ( b 2. |
|
2 " s |
x |
# 0, that is, sx ( 2, or x ( 4. Thus we have 0 ( x ( 4, so the domain of |
|
||||||||||||||||||||||||||||||||||||||||||
|
|
t ! f |
is the closed interval +0, 4,. |
|
|
|
|
|
|
|
|
|
|
|
|
|
|
|
|
|
|
|
|
|
|
|
|
|
|
|
|
|
|
|
|
|
|
||||||||||
|
|
|
|
|
|
|
|
|
|
! f ! f "!x" ! f ! f !x"" ! f (s |
|
|
|
) ! s |
|
|
|
! s |
|
|
|
|
|
|
|||||||||||||||||||||||
|
|
(c) |
|
|
|
|
|
|
|
|
s |
|
|
||||||||||||||||||||||||||||||||||
|
|
|
|
|
|
x |
x |
x |
|
||||||||||||||||||||||||||||||||||||||
|
|
The domain of f ! f is +0, '". |
|
|
|
|
|
|
|
|
|
|
|
|
|
|
|
4 |
|
|
|
|
|
|
|
|
|
||||||||||||||||||||
|
|
|
|
|
|
|
|
|
|
|
|
|
|
|
|
|
|
|
|
|
|
|
|
|
|
|
|
|
|
|
|
|
|
|
|
|
|||||||||||
|
|
|
|
|
|
|
|
|
|
! t ! t"!x" ! t! t!x"" ! t(s |
|
|
|
|
|
|
|
|
) ! s |
|
|
|
|
|
|
|
|
|
|
|
|
|
|
||||||||||||||
|
|
(d) |
|
|
|
|
|
2 " x |
2 " s |
2 " x |
|
|
|
||||||||||||||||||||||||||||||||||
|
|
This expression is defined when both 2 " x # 0 and 2 " s |
|
|
|
|
|
|
|
# 0. The first |
|
||||||||||||||||||||||||||||||||||||
|
2 " x |
|
|||||||||||||||||||||||||||||||||||||||||||||
|
|
inequality means x ( 2, and the second is equivalent to s2 " x ( 2, or 2 " x ( 4, or |
|
||||||||||||||||||||||||||||||||||||||||||||
|
|
x # "2. Thus "2 ( x ( 2, so the domain of t ! t is the closed interval +"2, 2,. |
M |
||||||||||||||||||||||||||||||||||||||||||||
|
|
|
It is possible to take the composition of three or more functions. For instance, the com- |
||||||||||||||||||||||||||||||||||||||||||||
|
|
posite function f ! t ! h is found by first applying h, then t, and then f as follows: |
|
||||||||||||||||||||||||||||||||||||||||||||
|
|
|
|
|
|
|
|
|
|
|
|
|
! f ! t ! h"!x" ! f ! t!h!x""" |
|
|||||||||||||||||||||||||||||||||
|
|
EXAMPLE 8 Find f ! t ! h if f !x" ! x&!x $ 1", t!x" ! x10, and h!x" ! x $ 3. |
|
||||||||||||||||||||||||||||||||||||||||||||
|
|
SOLUTION |
! f ! t ! h"!x" ! f ! t!h!x""" ! f ! t!x $ 3"" |
|
|||||||||||||||||||||||||||||||||||||||||||
|
|
|
|
|
|
|
|
|
|
|
|
|
! f !!x |
$ 3"10 " ! |
|
|
!x $ 3"10 |
M |
|||||||||||||||||||||||||||||
|
|
|
|
|
|
|
|
|
|
|
|
|
!x $ 3"10 $ 1 |
|
|
|
|
||||||||||||||||||||||||||||||
So far we have used composition to build complicated functions from simpler ones. But in calculus it is often useful to be able to decompose a complicated function into simpler ones, as in the following example.

SECTION 1.3 NEW FUNCTIONS FROM OLD FUNCTIONS |||| 43
EXAMPLE 9 Given F!x" ! cos2!x $ 9", find functions f , t, and h such that F ! f ! t ! h.
SOLUTION Since F!x" ! +cos!x $ 9",2, the formula for F says: First add 9, then take the cosine of the result, and finally square. So we let
h!x" ! x $ 9 t!x" ! cos x f !x" ! x2
Then |
|
! f ! t ! h"!x" ! f ! t!h!x""" ! f ! t!x $ 9"" ! f !cos!x $ 9"" |
|
! +cos!x $ 9",2 ! F!x" |
M |
1.3EXERCISES
1.Suppose the graph of f is given. Write equations for the graphs that are obtained from the graph of f as follows.
(a)Shift 3 units upward.
(b)Shift 3 units downward.
(c)Shift 3 units to the right.
(d)Shift 3 units to the left.
(e)Reflect about the x-axis.
(f)Reflect about the y-axis.
(g)Stretch vertically by a factor of 3.
(h)Shrink vertically by a factor of 3.
2.Explain how each graph is obtained from the graph of y ! f !x".
(a) y ! 5f !x" |
(b) y ! f !x " 5" |
(c) y ! "f !x" |
(d) y ! "5f !x" |
(e) y ! f !5x" |
(f) y ! 5f !x" " 3 |
3.The graph of y ! f !x" is given. Match each equation with its graph and give reasons for your choices.
(a) y ! f !x " 4" |
|
|
|
|
|
(b) |
y ! f !x" $ 3 |
|
|
|
|
|
||||||||||||||||||||||
(c) y ! 31 f !x" |
|
|
|
|
|
|
|
|
|
(d) |
y ! "f !x $ 4" |
|
|
|
|
|
||||||||||||||||||
(e) y ! 2f !x $ 6" |
|
|
|
|
|
|
|
|
|
|
|
|
|
|
|
|
|
|
|
|
|
|
|
|||||||||||
@ |
|
|
|
|
|
|
|
y |
! |
|
|
|
|
|
|
|
|
|
|
|
|
|
|
|
||||||||||
|
|
|
|
6 |
|
|
|
|
|
|
|
|
|
|
|
|
|
|
|
|||||||||||||||
|
|
|
|
|
|
|
|
|
|
|
|
|
|
|
f |
|
|
|
|
# |
|
|
|
|
|
|
|
|||||||
|
|
|
|
|
|
|
|
|
|
|
|
3 |
|
|
|
|
|
|
|
|
|
|
|
|
|
|
||||||||
|
|
|
|
|
|
|
|
|
|
|
|
|
|
|
|
|
|
|
|
|
|
|
|
|
|
|||||||||
|
|
|
|
|
|
|
|
|
|
|
|
|
|
|
|
|
|
|
|
|
|
|
|
|
|
|||||||||
|
|
|
|
|
|
|
|
|
|
|
|
|
$ |
|
|
|
|
|
|
|
|
|
|
|
|
|
|
|
||||||
|
|
|
|
|
|
|
|
|
|
|
|
|
|
|
|
|
|
|
|
|
|
|
|
|
|
|
|
|
|
|
|
|||
|
|
|
|
|
|
|
|
|
|
|
|
|
|
|
|
|
|
|
|
|
|
|
|
|
|
|
|
|
|
|
|
|||
|
|
|
|
|
|
|
|
|
|
|
|
|
|
|
|
|
|
|
|
|
|
|
|
|
|
|
|
|
|
|
|
|
|
|
|
|
|
_ |
|
6 |
|
|
|
_ |
|
3 |
|
|
|
0 |
|
|
|
|
|
3 |
6 |
|
|
|
x |
||||||||
%_3
4.The graph of f is given. Draw the graphs of the following functions.
(a) y ! f !x $ 4" |
(b) y ! f !x" $ 4 |
(c) y ! 2f !x" |
(d) y ! "21 f !x" $ 3 |
|
y |
|
|
1 |
|
|
0 |
1 |
x |
5. The graph of f |
is given. Use it to graph the following |
||
functions. |
|
y ! f (21 x) |
|
(a) |
y ! f !2x" |
(b) |
|
(c) |
y ! f !"x" |
(d) |
y ! "f !"x" |
y |
|
|
1 |
|
|
0 |
1 |
x |
6–7 The graph of y ! s3x " x2 is given. Use transformations to create a function whose graph is as shown.
y
1.5y=Пгггггг3x-≈
|
|
|
|
|
|
|
|
|
|
|
|
|
0 |
3 |
|
x |
|
|
|||
6. y |
|
|
7. |
|
|
y |
|
|
||
|
|
|
|
|
||||||
3 |
|
|
|
|
|
|
|
|
|
|
|
|
_4 |
_1 0 |
x |
||||||
|
|
|
|
|||||||
|
|
|
|
|
|
|
|
|
_1 |
|
|
|
|
|
|
|
|
|
|
_2.5 |
|
|
0 |
2 |
5 x |
|
|
|
|
|||
|
|
|
|
|
|
|
|
|
|
|

44|||| CHAPTER 1 FUNCTIONS AND MODELS
8.(a) How is the graph of y ! 2 sin x related to the graph of y ! sin x? Use your answer and Figure 6 to sketch the graph of y ! 2 sin x.
(b)How is the graph of y ! 1 $ sx related to the graph of y ! sx ? Use your answer and Figure 4(a) to sketch the graph of y ! 1 $ sx .
9–24 Graph the function by hand, not by plotting points, but by starting with the graph of one of the standard functions given in Section 1.2, and then applying the appropriate transformations.
9. y ! "x3
11. y ! ! x $ 1"2
13. y ! 1 $ 2 cos x
15. y ! sin! x&2"
17. y ! sx $ 3 19. y ! 12 ! x2 $ 8x"
2
21. y ! x $ 1
23. y ! #sin x #
10. |
y ! 1 " x2 |
|
|
|
||||
12. |
y ! x2 " 4x $ 3 |
|||||||
14. |
y ! 4 sin 3x |
|
|
|
||||
16. |
y ! |
|
1 |
|
|
|
|
|
x " 4 |
|
|
|
|
||||
18. |
y ! ! x $ 2"4 |
$ 3 |
||||||
20. |
y ! 1 |
$ 3 |
|
|||||
|
x " 1 |
|
||||||
|
|
|
s |
|
|
|
||
|
1 |
tan)x |
% |
|||||
22. |
y ! |
|
" |
|
|
|||
4 |
4 |
|||||||
24. |
y ! # x2 " 2x # |
|||||||
*
25.The city of New Orleans is located at latitude 30&N. Use Figure 9 to find a function that models the number of hours of daylight at New Orleans as a function of the time of year. To check the accuracy of your model, use the fact that on March 31 the sun rises at 5:51 AM and sets at 6:18 PM in New Orleans.
26.A variable star is one whose brightness alternately increases and decreases. For the most visible variable star, Delta Cephei, the time between periods of maximum brightness is 5.4 days, the average brightness (or magnitude) of the star is 4.0, and its brightness varies by )0.35 magnitude. Find a function that models the brightness of Delta Cephei as a function of time.
27.(a) How is the graph of y ! f (# x #) related to the graph of f ?
(b)Sketch the graph of y ! sin # x #.
(c)Sketch the graph of y ! s# x #.
28.Use the given graph of f to sketch the graph of y ! 1&f !x". Which features of f are the most important in sketching
y ! 1&f !x"? Explain how they are used.
y 
1
0 |
1 |
x |
29–30 Find f $ t, f " t, ft, and f&t and state their domains.
29. |
f !x" ! x3 $ 2x2, |
t!x" ! 3x2 " 1 |
||||
30. |
f !x" ! s |
|
, |
t!x" ! s |
|
|
3 " x |
x2 " 1 |
|||||
|
|
|
|
|
|
|
31–36 Find the functions (a) f ! t, (b) t ! f , (c) f ! f , and (d) t ! t and their domains.
31. f !x" ! x2 " 1, t!x" ! 2x $ 1
32.f !x" ! x " 2, t!x" ! x2 $ 3x $ 4
33.f !x" ! 1 " 3x, t!x" ! cos x
34.f !x" ! sx , t!x" ! s3 1 " x
35. |
|
1 |
|
|
|
|
|
|
x $ 1 |
|
|
|
|
|
|
|
|
|
|
|
|
||||||||
f !x" ! x $ x , t!x" ! x $ |
2 |
|
|
|
|
|
|
|
|
|
|
|
|
|
|
||||||||||||||
|
|
|
|
|
|
|
|
|
|
|
|
|
|
|
|||||||||||||||
|
f !x" ! |
|
|
|
x |
|
|
|
|
t!x" ! sin 2x |
|
|
|
|
|
|
|
|
|
|
|
||||||||
36. |
|
|
, |
|
|
|
|
|
|
|
|
|
|
|
|
||||||||||||||
1 $ x |
|
|
|
|
|
|
|
|
|
|
|
|
|||||||||||||||||
|
|
|
|
|
|
|
|
|
|
|
|
|
|
|
|
|
|
|
|
|
|
|
|
|
|
|
|
||
37– 40 Find f ! t ! h. |
|
|
|
|
|
|
|
|
|
|
|
|
|
|
|
||||||||||||||
37. |
f !x" ! x $ 1, |
|
|
|
t!x" ! 2x, |
h!x" ! x " 1 |
|
|
|
|
|
|
|
|
|
|
|
||||||||||||
38. |
f !x" ! 2x " 1, |
|
t!x" ! x2, |
h!x" ! 1 " x |
|
|
|
|
|
|
|
|
|
|
|||||||||||||||
39. |
f !x" ! s |
|
|
|
, |
|
t!x" ! x2, |
h!x" ! x3 $ 2 |
|
|
|
|
|
||||||||||||||||
x " 3 |
|
|
|
|
|
|
|||||||||||||||||||||||
|
|
|
|
|
|
|
|
|
|
|
|
|
|
x |
|
|
|
|
|
|
|
|
|
|
|
|
|
|
|
40. |
|
|
|
|
|
|
|
|
|
|
|
, h!x" ! sx |
|
|
|
|
|
|
|
|
|
|
|
||||||
f !x" ! tan x, t!x" ! x " 1 |
|
|
|
|
|
|
|
|
|
|
|
||||||||||||||||||
|
|
|
|
|
|
|
|
|
|
|
|
|
|
|
3 |
|
|
|
|
|
|
|
|
|
|
|
|
|
|
|
|
|
|
|
|
|
|
|
|
|
|
|
|
|
|
|
|
|
|
|
|
|
|
|
|
|
|
|
|
41– 46 Express the function in the form f ! t. |
|
|
|
|
|
|
|
|
|
|
|
||||||||||||||||||
41. |
F!x" ! !x2 $ 1"10 |
|
42. F!x" ! sin(s |
|
) |
||||||||||||||||||||||||
x |
|||||||||||||||||||||||||||||
|
|
|
|
|
s |
|
|
|
|
|
|
|
|
|
|
|
|
|
|
|
|
|
|
|
|
||||
|
|
|
|
|
x |
|
|
|
|
|
|
|
|
|
|
|
|
3 |
|
|
|
x |
|||||||
|
3 |
|
|
|
|
|
|
|
|
|
|
44. G!x" ! - |
|
|
|
|
|
|
|
||||||||||
43. |
F!x" ! |
|
|
|
|
|
|
|
|
|
|
|
|
|
|
|
|
|
|||||||||||
1 $ s3 |
|
|
|
|
|
|
1 |
|
$ x |
||||||||||||||||||||
x |
|
|
|
|
|
||||||||||||||||||||||||
45. |
u!t" ! s |
|
|
|
|
|
|
|
|
|
|
|
|
46. u!t" ! |
|
|
tan t |
|
|||||||||||
cos t |
|
|
|
|
|
|
|
|
|
||||||||||||||||||||
|
|
|
|
|
|
|
|
1 |
$ tan t |
||||||||||||||||||||
|
|
|
|
|
|
|
|
|
|
|
|
|
|
|
|
|
|
|
|||||||||||
|
|
|
|
|
|
|
|
|
|
|
|
|
|
|
|
|
|
|
|
|
|
|
|
|
|
||||
47– 49 Express the function in the form f ! t ! h. |
|
|
|
|
|
|
|
|
|
|
|||||||||||||||||||
|
|
|
|
|
|
|
|
x2 |
|
|
|
|
|
|
|
|
|
|
|
|
|
|
|
|
|
|
|
||
47. |
H!x" ! 1 " 3 |
|
|
|
|
|
|
|
|
8 |
|
|
|
|
|
# x # |
|||||||||||||
|
|
|
|
|
|
|
|
48. H!x" ! s2 $ |
|||||||||||||||||||||
49.H!x" ! sec4(sx )
50.Use the table to evaluate each expression.
(a) |
f ! t!1"" |
|
(b) |
t! f !1"" |
|
|
(c) |
f ! f !1"" |
||||||
(d) |
t! t!1"" |
|
(e) |
! t ! f "!3" |
|
|
(f) |
! f ! t"!6" |
||||||
|
|
|
|
|
|
|
|
|
|
|
|
|
|
|
|
|
x |
1 |
|
2 |
3 |
|
4 |
5 |
|
|
6 |
|
|
|
|
|
|
|
|
|
|
|
|
|
|
|
|
|
|
|
f !x" |
3 |
|
1 |
4 |
|
2 |
2 |
|
|
5 |
|
|
|
|
|
|
|
|
|
|
|
|
|
|
|
|
|
|
|
t!x" |
6 |
|
3 |
2 |
|
1 |
2 |
|
|
3 |
|
|
|
|
|
|
|
|
|
|
|
|
|
|
|
|
|

51.Use the given graphs of f and t to evaluate each expression, or explain why it is undefined.
(a) f ! t!2"" |
(b) t! f !0"" |
(c) ! f ! t"!0" |
(d) ! t ! f "!6" |
(e) ! t ! t"!"2" |
(f) ! f ! f "!4" |
y |
|
|
|
g |
f |
|
2 |
|
0 |
2 |
x |
52. Use the given graphs of f and t to estimate the value of
f ! t!x"" for x ! "5, "4, "3, . . . , 5. Use these estimates to sketch a rough graph of f ! t.
y |
|
|
|
|
g |
1 |
|
|
0 |
1 |
x |
f |
|
|
53.A stone is dropped into a lake, creating a circular ripple that travels outward at a speed of 60 cm&s.
(a)Express the radius r of this circle as a function of the time t (in seconds).
(b)If A is the area of this circle as a function of the radius, find A ! r and interpret it.
54.A spherical balloon is being inflated and the radius of the balloon is increasing at a rate of 2 cm&s.
(a)Express the radius r of the balloon as a function of the time t (in seconds).
(b)If V is the volume of the balloon as a function of the radius, find V ! r and interpret it.
55.A ship is moving at a speed of 30 km&h parallel to a straight shoreline. The ship is 6 km from shore and it passes a lighthouse at noon.
(a)Express the distance s between the lighthouse and the ship as a function of d, the distance the ship has traveled since noon; that is, find f so that s ! f !d".
(b)Express d as a function of t, the time elapsed since noon; that is, find t so that d ! t!t".
(c)Find f ! t. What does this function represent?
56.An airplane is flying at a speed of 350 mi&h at an altitude of one mile and passes directly over a radar station at time t ! 0.
(a)Express the horizontal distance d (in miles) that the plane has flown as a function of t.
(b)Express the distance s between the plane and the radar station as a function of d.
(c)Use composition to express s as a function of t.
SECTION 1.3 NEW FUNCTIONS FROM OLD FUNCTIONS |||| 45
57. The Heaviside function H is defined by
H!t" ! .0 if t ! 0 1 if t # 0
It is used in the study of electric circuits to represent the sudden surge of electric current, or voltage, when a switch is instantaneously turned on.
(a)Sketch the graph of the Heaviside function.
(b)Sketch the graph of the voltage V!t" in a circuit if the switch is turned on at time t ! 0 and 120 volts are applied instantaneously to the circuit. Write a formula for V!t" in terms of H!t".
(c)Sketch the graph of the voltage V!t" in a circuit if the switch is turned on at time t ! 5 seconds and 240 volts are applied instantaneously to the circuit. Write a formula for V!t" in terms of H!t". (Note that starting at t ! 5 corresponds to a translation.)
58.The Heaviside function defined in Exercise 57 can also be used to define the ramp function y ! ctH!t", which represents a gradual increase in voltage or current in a circuit.
(a)Sketch the graph of the ramp function y ! tH!t".
(b)Sketch the graph of the voltage V!t" in a circuit if the switch is turned on at time t ! 0 and the voltage is gradually increased to 120 volts over a 60-second time interval. Write a formula for V!t" in terms of H!t" for t ( 60.
(c)Sketch the graph of the voltage V!t" in a circuit if the switch is turned on at time t ! 7 seconds and the voltage is gradually increased to 100 volts over a period of 25 seconds.
Write a formula for V!t" in terms of H!t" for t ( 32.
59.Let f and t be linear functions with equations f !x" ! m1x $ b1
and t!x" ! m2 x $ b2. Is f ! t also a linear function? If so, what is the slope of its graph?
60.If you invest x dollars at 4% interest compounded annually, then the amount A!x" of the investment after one year is A!x" ! 1.04x. Find A ! A, A ! A ! A, and A ! A ! A ! A. What do these compositions represent? Find a formula for the composition of n copies of A.
61.(a) If t!x" ! 2x $ 1 and h!x" ! 4x2 $ 4x $ 7, find a function f such that f ! t ! h. (Think about what operations you
would have to perform on the formula for t to end up with the formula for h.)
(b)If f !x" ! 3x $ 5 and h!x" ! 3x2 $ 3x $ 2, find a function t such that f ! t ! h.
62.If f !x" ! x $ 4 and h!x" ! 4x " 1, find a function t such that t ! f ! h.
63. (a) Suppose f and t are even functions. What can you say about
f$ t and ft?
(b)What if f and t are both odd?
64.Suppose f is even and t is odd. What can you say about ft?
65.Suppose t is an even function and let h ! f ! t. Is h always an even function?
66.Suppose t is an odd function and let h ! f ! t. Is h always an odd function? What if f is odd? What if f is even?