

- •CONTENTS
- •Preface
- •To the Student
- •Diagnostic Tests
- •1.1 Four Ways to Represent a Function
- •1.2 Mathematical Models: A Catalog of Essential Functions
- •1.3 New Functions from Old Functions
- •1.4 Graphing Calculators and Computers
- •1.6 Inverse Functions and Logarithms
- •Review
- •2.1 The Tangent and Velocity Problems
- •2.2 The Limit of a Function
- •2.3 Calculating Limits Using the Limit Laws
- •2.4 The Precise Definition of a Limit
- •2.5 Continuity
- •2.6 Limits at Infinity; Horizontal Asymptotes
- •2.7 Derivatives and Rates of Change
- •Review
- •3.2 The Product and Quotient Rules
- •3.3 Derivatives of Trigonometric Functions
- •3.4 The Chain Rule
- •3.5 Implicit Differentiation
- •3.6 Derivatives of Logarithmic Functions
- •3.7 Rates of Change in the Natural and Social Sciences
- •3.8 Exponential Growth and Decay
- •3.9 Related Rates
- •3.10 Linear Approximations and Differentials
- •3.11 Hyperbolic Functions
- •Review
- •4.1 Maximum and Minimum Values
- •4.2 The Mean Value Theorem
- •4.3 How Derivatives Affect the Shape of a Graph
- •4.5 Summary of Curve Sketching
- •4.7 Optimization Problems
- •Review
- •5 INTEGRALS
- •5.1 Areas and Distances
- •5.2 The Definite Integral
- •5.3 The Fundamental Theorem of Calculus
- •5.4 Indefinite Integrals and the Net Change Theorem
- •5.5 The Substitution Rule
- •6.1 Areas between Curves
- •6.2 Volumes
- •6.3 Volumes by Cylindrical Shells
- •6.4 Work
- •6.5 Average Value of a Function
- •Review
- •7.1 Integration by Parts
- •7.2 Trigonometric Integrals
- •7.3 Trigonometric Substitution
- •7.4 Integration of Rational Functions by Partial Fractions
- •7.5 Strategy for Integration
- •7.6 Integration Using Tables and Computer Algebra Systems
- •7.7 Approximate Integration
- •7.8 Improper Integrals
- •Review
- •8.1 Arc Length
- •8.2 Area of a Surface of Revolution
- •8.3 Applications to Physics and Engineering
- •8.4 Applications to Economics and Biology
- •8.5 Probability
- •Review
- •9.1 Modeling with Differential Equations
- •9.2 Direction Fields and Euler’s Method
- •9.3 Separable Equations
- •9.4 Models for Population Growth
- •9.5 Linear Equations
- •9.6 Predator-Prey Systems
- •Review
- •10.1 Curves Defined by Parametric Equations
- •10.2 Calculus with Parametric Curves
- •10.3 Polar Coordinates
- •10.4 Areas and Lengths in Polar Coordinates
- •10.5 Conic Sections
- •10.6 Conic Sections in Polar Coordinates
- •Review
- •11.1 Sequences
- •11.2 Series
- •11.3 The Integral Test and Estimates of Sums
- •11.4 The Comparison Tests
- •11.5 Alternating Series
- •11.6 Absolute Convergence and the Ratio and Root Tests
- •11.7 Strategy for Testing Series
- •11.8 Power Series
- •11.9 Representations of Functions as Power Series
- •11.10 Taylor and Maclaurin Series
- •11.11 Applications of Taylor Polynomials
- •Review
- •APPENDIXES
- •A Numbers, Inequalities, and Absolute Values
- •B Coordinate Geometry and Lines
- •E Sigma Notation
- •F Proofs of Theorems
- •G The Logarithm Defined as an Integral
- •INDEX
614 |||| CHAPTER 9 DIFFERENTIAL EQUATIONS |
|
|
|
|||
(d) Suppose that at time t 0 there are 1000 aphids and |
|
|
(b) Find all the equilibrium solutions and explain their |
|||
200 ladybugs. Draw the corresponding phase trajectory |
|
|
significance. |
|||
and use it to describe how both populations change. |
|
|
(c) The figure shows the phase trajectory that starts at the |
|||
(e) Use part (d) to make rough sketches of the aphid and |
|
|
point 1000, 40 . Describe what eventually happens to the |
|||
ladybug populations as functions of t. How are the graphs |
|
|
rabbit and wolf populations. |
|||
related to each other? |
|
|
(d) Sketch graphs of the rabbit and wolf populations as func- |
|||
9. In Example 1 we used Lotka-Volterra equations to model |
|
|
tions of time. |
|||
|
|
|
||||
populations of rabbits and wolves. Let’s modify those |
|
10. |
In Exercise 8 we modeled populations of aphids and ladybugs |
|||
CAS |
||||||
equations as follows: |
||||||
|
|
with a Lotka-Volterra system. Suppose we modify those equa- |
||||
|
dR |
|
|
|
||
|
0.08R 1 0.0002R 0.001RW |
|
|
tions as follows: |
||
|
|
|
|
|
||
dt
dW 0.02W 0.00002RW dt
(a)According to these equations, what happens to the rabbit population in the absence of wolves?
dA 2A 1 0.0001A 0.01AL dt
dL 0.5L 0.0001AL dt
W
70
60
50
40
(a) In the absence of ladybugs, what does the model predict about the aphids?
(b) Find the equilibrium solutions.
(c) Find an expression for dL dA.
(d) Use a computer algebra system to draw a direction field
|
|
|
|
|
|
|
|
|
|
|
|
|
|
|
for the differential equation in part (c). Then use the |
|
|
|
|
|
|
|
|
|
|
|
|
|
|
|
direction field to sketch a phase portrait. What do the |
|
|
|
|
|
|
|
|
|
|
|
|
|
|
|
phase trajectories have in common? |
|
|
|
|
|
|
|
|
|
|
|
|
|
|
|
(e) Suppose that at time t 0 there are 1000 aphids and |
|
|
|
|
|
|
|
|
|
|
|
|
|
|
|
200 ladybugs. Draw the corresponding phase trajectory |
|
|
|
|
|
|
|
|
|
|
|
|
|
|
|
and use it to describe how both populations change. |
|
|
|
|
|
|
|
|
|
|
|
|
|
|
|
(f) Use part (e) to make rough sketches of the aphid and |
|
|
|
|
|
|
|
|
|
|
|
|
|
|
|
ladybug populations as functions of t. How are the graphs |
800 |
1000 |
1200 |
1400 |
1600 |
R |
related to each other? |
|||||||||
9 REVIEW
C O N C E P T C H E C K
1.(a) What is a differential equation?
(b)What is the order of a differential equation?
(c)What is an initial condition?
2.What can you say about the solutions of the equation
y x 2 y 2 just by looking at the differential equation?
3.What is a direction field for the differential equation y F x, y ?
4.Explain how Euler’s method works.
5.What is a separable differential equation? How do you solve it?
6.What is a first-order linear differential equation? How do you solve it?
7.(a) Write a differential equation that expresses the law of natural growth. What does it say in terms of relative growth rate?
(b)Under what circumstances is this an appropriate model for population growth?
(c)What are the solutions of this equation?
8.(a) Write the logistic equation.
(b)Under what circumstances is this an appropriate model for population growth?
9.(a) Write Lotka-Volterra equations to model populations of food fish F and sharks S .
(b)What do these equations say about each population in the absence of the other?
|
|
|
|
|
|
|
|
|
CHAPTER 9 REVIEW |||| 615 |
|||
|
|
|
|
|
|
|
|
|
|
|
||
|
T R U E - F A L S E Q U I Z |
|
|
|
|
|
|
|
|
|
||
Determine whether the statement is true or false. If it is true, explain why. |
5. |
The equation e xy y is linear. |
|
|||||||||
If it is false, explain why or give an example that disproves the statement. |
6. |
The equation y xy e y is linear. |
|
|||||||||
1. |
All solutions of the differential equation y 1 y 4 are |
|
||||||||||
7. |
If y is the solution of the initial-value problem |
|||||||||||
|
|
decreasing functions. |
||||||||||
2. |
The function f x ln x x is a solution of the differential |
|
|
dy |
|
|
|
y |
|
|
||
|
|
equation x 2 y xy 1. |
|
|
2y |
1 |
y 0 1 |
|||||
3. |
The equation y x y is separable. |
|
|
dt |
5 |
|
||||||
|
|
|
|
|
|
|
|
|
||||
4. |
The equation y 3y 2x 6xy 1 is separable. |
|
then lim t l y 5. |
|
|
|
|
|
||||
E X E R C I S E S
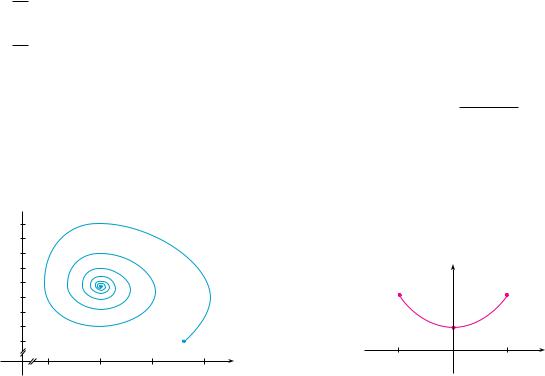
1. (a) A direction field for the differential equation
y y y 2 y 4 is shown. Sketch the graphs of the solutions that satisfy the given initial conditions.
(i) y 0 0.3 |
(ii) y 0 1 |
(iii) y 0 3 |
(iv) y 0 4.3 |
(b)If the initial condition is y 0 c, for what values of
c is limt l y t finite? What are the equilibrium solutions?
y |
|
|
|
6 |
|
|
|
4 |
|
|
|
2 |
|
|
|
0 |
1 |
2 |
x |
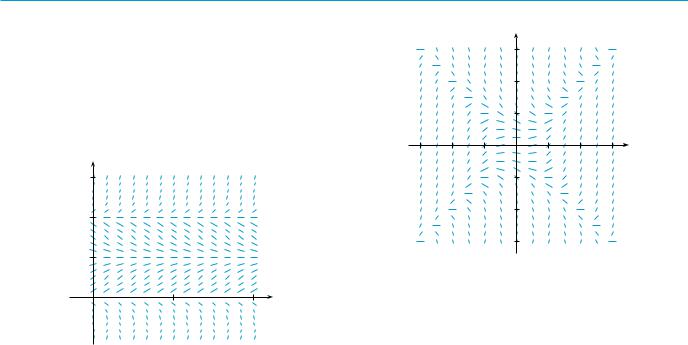
2. (a) Sketch a direction field for the differential equation y x y. Then use it to sketch the four solutions that satisfy the initial conditions y 0 1, y 0 1,
y 2 1, and y 2 1.
(b)Check your work in part (a) by solving the differential equation explicitly. What type of curve is each solution curve?
3. (a) A direction field for the differential equation y x 2 y 2 is shown. Sketch the solution of the initial-value problem
y x 2 y 2 y 0 1
Use your graph to estimate the value of y 0.3 .
|
|
|
y |
|
|
|
|
|
|
3 |
|
|
|
|
|
|
2 |
|
|
|
|
|
|
1 |
|
|
|
_3 |
_2 |
_1 |
0 |
1 |
2 |
3 x |
|
|
|
_1 |
|
|
|
|
|
|
_2 |
|
|
|
|
|
|
_3 |
|
|
|
(b)Use Euler’s method with step size 0.1 to estimate y 0.3 where y x is the solution of the initial-value problem in part (a). Compare with your estimate from part (a).
(c)On what lines are the centers of the horizontal line segments of the direction field in part (a) located? What happens when a solution curve crosses these lines?
4.(a) Use Euler’s method with step size 0.2 to estimate y 0.4 , where y x is the solution of the initial-value problem
y 2xy 2 |
y 0 1 |
(b)Repeat part (a) with step size 0.1.
(c)Find the exact solution of the differential equation and compare the value at 0.4 with the approximations in parts (a) and (b).
5– 8 Solve the differential equation. |
|
|
|
|||
5. |
y xe sin x y cos x |
6. |
dx |
1 t x tx |
||
|
||||||
|
|
|
|
|
dt |
|
7. |
2yey2y 2x 3s |
|
|
8. |
x 2y y 2 x 3e 1 x |
|
x |
||||||
|
|
|
|
|
|
|

616 |||| CHAPTER 9 DIFFERENTIAL EQUATIONS
9–11 Solve the initial-value problem.
9. |
dr |
2tr r, r 0 5 |
|
||
|
dt |
|
10. |
1 cos x y 1 e y sin x , y 0 0 |
|
11. |
xy y x ln x, y 1 2 |
|
|
|
|
;12. Solve the initial-value problem y 3x 2e y, y 0 1, and graph the solution.
13–14 Find the orthogonal trajectories of the family of curves.
13. |
y ke x |
|
14. |
y e kx |
||
|
|
|
|
|||
15. |
(a) Write the solution of the initial-value problem |
|||||
|
|
dP |
0.1P 1 |
P |
|
P 0 100 |
|
|
dt |
2000 |
|||
|
|
|
|
|||
and use it to find the population when t 20.
(b)When does the population reach 1200?
16.(a) The population of the world was 5.28 billion in 1990 and 6.07 billion in 2000. Find an exponential model for these data and use the model to predict the world population in the year 2020.
(b)According to the model in part (a), when will the world population exceed 10 billion?
(c)Use the data in part (a) to find a logistic model for the population. Assume a carrying capacity of 100 billion. Then use the logistic model to predict the population in 2020. Compare with your prediction from the exponential model.
(d)According to the logistic model, when will the world population exceed 10 billion? Compare with your prediction in part (b).
17.The von Bertalanffy growth model is used to predict the length L t of a fish over a period of time. If L is the largest length for a species, then the hypothesis is that the rate of growth in length is proportional to L L, the length yet to be achieved.
(a)Formulate and solve a differential equation to find an expression for L t .
(b)For the North Sea haddock it has been determined that
L 53 cm, L 0 10 cm, and the constant of proportionality is 0.2. What does the expression for L t become with these data?
18.A tank contains 100 L of pure water. Brine that contains 0.1 kg of salt per liter enters the tank at a rate of 10 L min. The solution is kept thoroughly mixed and drains from the tank at the same rate. How much salt is in the tank after
6 minutes?
19.One model for the spread of an epidemic is that the rate of spread is jointly proportional to the number of infected
people and the number of uninfected people. In an isolated town of 5000 inhabitants, 160 people have a disease at the beginning of the week and 1200 have it at the end of the week. How long does it take for 80% of the population to become infected?
20.The Brentano-Stevens Law in psychology models the way that a subject reacts to a stimulus. It states that if R represents the reaction to an amount S of stimulus, then the relative rates of increase are proportional:
1 |
|
dR |
|
k |
|
dS |
R dt |
S |
|
dt |
|||
|
|
|||||
where k is a positive constant. Find R as a function of S.
21.The transport of a substance across a capillary wall in lung physiology has been modeled by the differential equation
dh R |
|
h |
|
||
dt |
|
V |
k h |
||
where h is the hormone concentration in the bloodstream, t is time, R is the maximum transport rate, V is the volume of the capillary, and k is a positive constant that measures the affinity between the hormones and the enzymes that assist the process. Solve this differential equation to find a relationship between h and t.
22. Populations of birds and insects are modeled by the equations
dx 0.4x 0.002xy dt
dy 0.2y 0.000008xy dt
(a)Which of the variables, x or y, represents the bird population and which represents the insect population? Explain.
(b)Find the equilibrium solutions and explain their significance.
(c)Find an expression for dy dx.
(d)The direction field for the differential equation in part (c) is shown. Use it to sketch the phase trajectory corre-
y 400
400
300
200
100
0 |
|
|
|
|
|
|
|
20000 |
40000 |
60000 x |
|||||
sponding to initial populations of 100 birds and 40,000 insects. Then use the phase trajectory to describe how both populations change.
(e)Use part (d) to make rough sketches of the bird and insect populations as functions of time. How are these graphs related to each other?
23.Suppose the model of Exercise 22 is replaced by the equations
dx 0.4x 1 0.000005x 0.002xy dt
dy 0.2y 0.000008xy dt
(a)According to these equations, what happens to the insect population in the absence of birds?
(b)Find the equilibrium solutions and explain their significance.
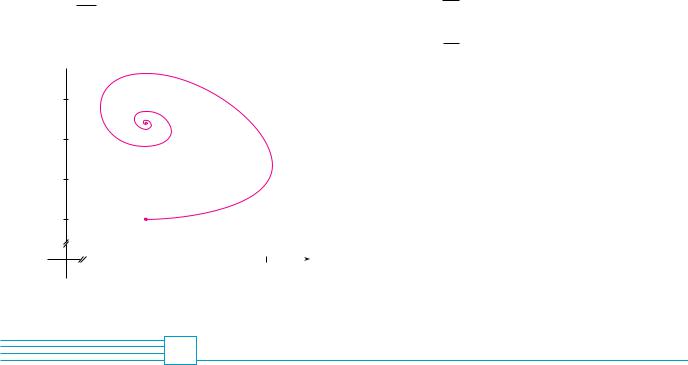
(c)The figure shows the phase trajectory that starts with 100 birds and 40,000 insects. Describe what eventually happens to the bird and insect populations.
y
260
240
220
200
180
160
140
120
100
15000 25000 35000 45000 x
CHAPTER 9 REVIEW |||| 617
(d)Sketch graphs of the bird and insect populations as functions of time.
24.Barbara weighs 60 kg and is on a diet of 1600 calories per
day, of which 850 are used automatically by basal metabolism. She spends about 15 cal kg day times her weight doing exercise. If 1 kg of fat contains 10,000 cal and we assume that the storage of calories in the form of fat is 100% efficient, formulate a differential equation and solve it to find her weight as a function of time. Does her weight ultimately approach an equilibrium weight?
25.When a flexible cable of uniform density is suspended
between two fixed points and hangs of its own weight, the shape y f x of the cable must satisfy a differential equation of the form
d 2y |
k 1 |
dy |
2 |
|
|
|
|
dx 2 |
dx |
where k is a positive constant. Consider the cable shown in the figure.
(a)Let z dy dx in the differential equation. Solve the resulting first-order differential equation (in z), and then integrate to find y.
(b)Determine the length of the cable.
|
y |
|
|
(_b, h) |
|
(b, h) |
|
|
|
(0, a) |
|
_b |
0 |
b |
x |
 P R O B L E M S P L U S
y 
(x, y)
0 |
(L, 0) x |
FIGURE FOR PROBLEM 9
1. Find all functions f such that f is continuous and
|
x |
|
|
[ f x ]2 |
100 y0 |
[ f t ]2 [ f t ]2 dt |
for all real x |
2.A student forgot the Product Rule for differentiation and made the mistake of thinking
that ft f t . However, he was lucky and got the correct answer. The function f that he used was f x e x2 and the domain of his problem was the interval (12 , ). What was the function t?
3. |
Let f be a function with the property that f 0 1, f 0 1, and f a b f a f b for |
||
|
all real numbers a and b. Show that f x f x for all x and deduce that f x e x. |
||
4. |
Find all functions f that satisfy the equation |
||
|
yf x dx y |
1 |
dx 1 |
|
f x |
||
5. |
Find the curve y f x such that f x 0, f 0 0, f 1 1, and the area under the graph |
||
|
of f from 0 to x is proportional to the n 1 st power of f x . |
||
6. |
A subtangent is a portion of the x-axis that lies directly beneath the segment of a tangent line |
||
|
from the point of contact to the x-axis. Find the curves that pass through the point c, 1 and |
||
|
whose subtangents all have length c. |
||
7. |
A peach pie is removed from the oven at 5:00 PM. At that time it is piping hot, 100 C. |
||
|
At 5:10 PM its temperature is 80 C; at 5:20 PM it is 65 C. What is the temperature of the |
||
|
room? |
||
8. |
Snow began to fall during the morning of February 2 and continued steadily into the after- |
||
|
noon. At noon a snowplow began removing snow from a road at a constant rate. The plow |
||
|
traveled 6 km from noon to 1 PM but only 3 km from 1 PM to 2 PM. When did the snow begin |
||
|
to fall? [Hints: To get started, let t be the time measured in hours after noon; let x t be the |
||
|
distance traveled by the plow at time t; then the speed of the plow is dx dt. Let b be the num- |
||
|
ber of hours before noon that it began to snow. Find an expression for the height of the snow |
||
|
at time t. Then use the given information that the rate of removal R (in m3 h) is constant.] |
||
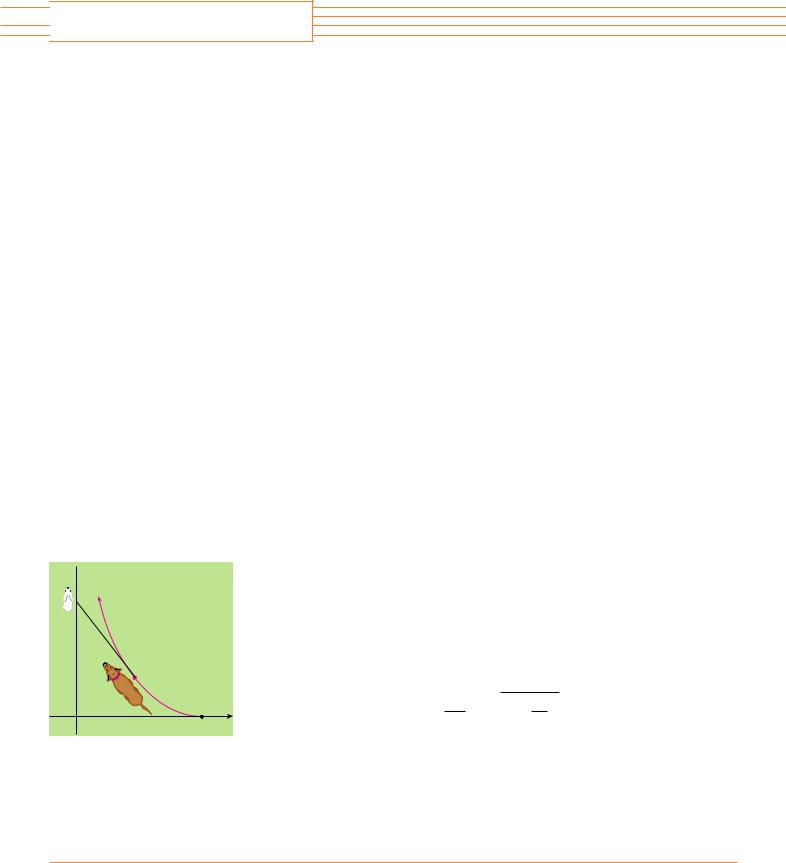
9. |
A dog sees a rabbit running in a straight line across an open field and gives chase. In a rectan- |
||
|
gular coordinate system (as shown in the figure), assume: |
||
(i) The rabbit is at the origin and the dog is at the point L, 0 at the instant the dog first sees the rabbit.
(ii) The rabbit runs up the y-axis and the dog always runs straight for the rabbit. (iii) The dog runs at the same speed as the rabbit.
(a) Show that the dog’s path is the graph of the function y f x , where y satisfies the differential equation
d 2y
x dx 2
(b)Determine the solution of the equation in part (a) that satisfies the initial conditions
y y 0 when x L. [Hint: Let z dy dx in the differential equation and solve the resulting first-order equation to find z; then integrate z to find y.]
(c)Does the dog ever catch the rabbit?
618

P R O B L E M S P L U S 
10.(a) Suppose that the dog in Problem 9 runs twice as fast as the rabbit. Find a differential equation for the path of the dog. Then solve it to find the point where the dog catches the rabbit.
(b)Suppose the dog runs half as fast as the rabbit. How close does the dog get to the rabbit? What are their positions when they are closest?
11.A planning engineer for a new alum plant must present some estimates to his company regarding the capacity of a silo designed to contain bauxite ore until it is processed into alum. The ore resembles pink talcum powder and is poured from a conveyor at the top of the silo. The
silo is a cylinder 100 ft high with a radius of 200 ft. The conveyor carries 60,000 the ore maintains a conical shape whose radius is 1.5 times its height.
ft3 h and
(a)If, at a certain time t, the pile is 60 ft high, how long will it take for the pile to reach the top of the silo?
(b)Management wants to know how much room will be left in the floor area of the silo when the pile is 60 ft high. How fast is the floor area of the pile growing at that height?
(c)
Suppose a loader starts removing the ore at the rate of 20,000 ft3 h when the height of the pile reaches 90 ft. Suppose, also, that the pile continues to maintain its shape. How long will it take for the pile to reach the top of the silo under these conditions?
12.Find the curve that passes through the point 3, 2 and has the property that if the tangent line is drawn at any point P on the curve, then the part of the tangent line that lies in the first quadrant is bisected at P.
13.Recall that the normal line to a curve at a point P on the curve is the line that passes through
P and is perpendicular to the tangent line at P. Find the curve that passes through the point3, 2 and has the property that if the normal line is drawn at any point on the curve, then the y-intercept of the normal line is always 6.
14.Find all curves with the property that if the normal line is drawn at any point P on the curve, then the part of the normal line between P and the x-axis is bisected by the y-axis.
619
 10
10
PARAMETRIC EQUATIONS
AND POLAR COORDINATES
Parametric equations and polar coordinates enable us to describe a great variety of new curves—some practical, some beautiful, some fanciful, some strange.
So far we have described plane curves by giving y as a function of x y f x or x as a function of y x t y or by giving a relation between x and y that defines y implicitly as a function of x f x, y 0 . In this chapter we discuss two new methods for describing curves.
Some curves, such as the cycloid, are best handled when both x and y are given in terms of a third variable t called a parameter x f t , y t t . Other curves, such as the cardioid, have their most convenient description when we use a new coordinate system, called the polar coordinate system.
620