


112 2.4 Malignant Tumors
2.4 Malignant Tumors
#54 Intrahepatic (Peripheral)
Cholangiocarcinoma (1):
Ductal Changes
Related topics: #87, 88 (extrahepatic cholangiocarcinoma)
KEY FACTS: DISEASE
●Malignant tumor originating from the epithelium of small and peripheral intrahepatic bile ducts
●Histology: adenocarcinoma, characteristically with large central core of fibrotic tissue relatively devoid of malignant cells; may also contain mucoid material
●Classification: mass forming, peri-duc- tal-infiltrating, and intraductal-growing types (Lim 2003)
●To be distinguished from other types of cholangiocarcinoma:
–Klatskin tumor (70%; see #87)
–Distal duct type (10%; see #88)
●Incidence:
–Second most common primary malignant liver tumor after hepatocellular carcinoma
–± 20% of cholangiocarcinomas
●Predisposing factors: ulcerative colitis, choledochal cyst (see #68), Caroli’s disease (see #30), infection by Clonorchis sinensis
●Symptoms: pain, jaundice
●Spread: predominantly local
●Complications:
–Biliary obstruction/cholangitis
–Intrahepatic satellite nodules (65%)
●Prognosis: poor (5-year survival rate,1%)
KEY FACTS: MRI
●Cholangiographic features (Fig. 54):
–Focal stricture most common
–Other presentations: diffuse narrowing, polypoid intraluminal mass
●Nonspecific unless cross-sectional images
show characteristic features (see #55)
● Focal or segmental intrahepatic bile duct ! dilation may be an early sign on crosssectional images
References
Choi BI, Han JK, Shin YM, Baek SY, Han MC (1995) Peripheral cholangiocarcinoma: comparison of MRI with CT. Abdom Imaging 20 : 357–60
Kawarada Y, Mizumoto R (1984) Cholangiocellular carcinoma of the liver. Am J Surg 147 : 354–359 Lim JH (2003) Cholangiocarcinoma: morphologic
classification according to growth pattern and imaging findings. AJR Am J Roentgenol 181 : 819–827
Nichols DA, MacCarty RL, Gaffey TA (1983) Cholangiographic evaluation of bile duct carcinoma. AJR Am J Roentgenol 141 : 1291–1294
Soyer P, Bluemke DA, Reichle R et al. (1995) Imaging of intrahepatic cholangiocarcinoma. 1. Peripheral cholangiocarcinoma. AJR Am J Roentgenol 165 : 1427–1431

2 Intrahepatic Bile Ducts 113
a |
b |
c |
d |
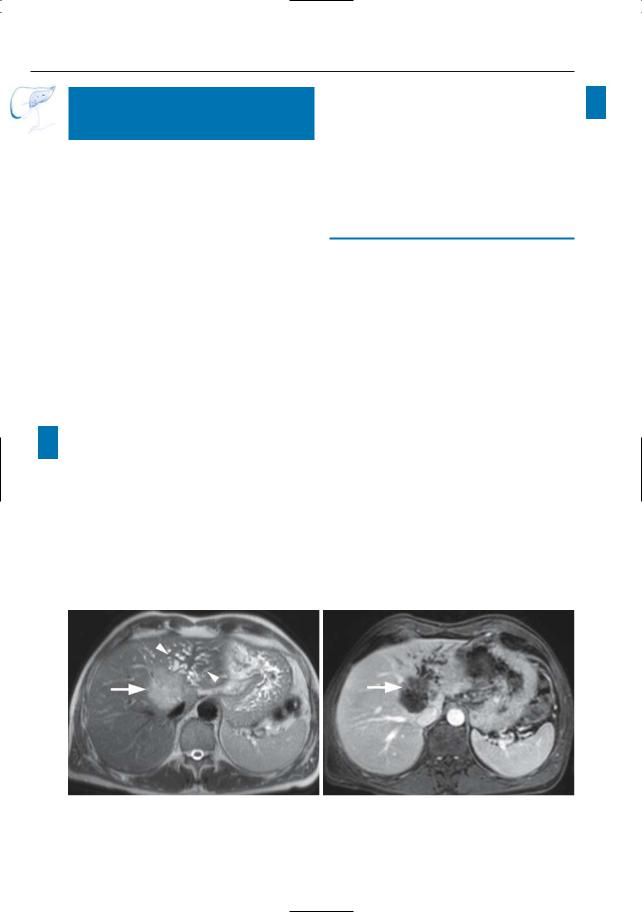
Fig. 54 a–d. Projective image (a) showing a focal stenosis (arrow) on the right hepatic duct with secondary bile duct dilatation.Axial T1-weighted image
(b) and T2-weighted HASTE images (c, d; TE 60 and 360) showing a small mass centered on the right hepatic duct: small cholangiocarcinoma
114 2.4 Malignant Tumors
#55 Intrahepatic (Peripheral)
Cholangiocarcinoma (2):
Enhancement Pattern
Related topics: #87, 88 (extrahepatic cholangiocarcinoma)
KEY FACTS: MRI
●Most intrahepatic cholangiocarcinomas can be visualized on cross-sectional images
●Signal intensity:
–T1: low
–T2: variable (isointense to markedly hyperintense; Vilgrain et al. 1997)
●Contrast-enhanced images:
–May show early moderate peripheral enhancement (also seen in some metastases and hepatocellular carcinomas)
!– Characteristic feature: hyperintense central core on delayed contrastenhanced images (Tani et al. 1991; Honda et al. 1993; Fig. 55)
●Mechanism of delayed enhancement:
–Central part of tumor usually contains a large extravascular, extracellular contrast distribution volume
–Contrast slowly accumulates in this part of the tumor by diffusion
●Note: Other features distinguishing ! intrahepatic cholangiocarcinoma from hepatocellular carcinoma:
–Tumor extension into the portal vein less common
–Segmental atrophy more common
–Usually less hypervascular (arterial phase)
References
Han JK, Choi B, Kim A, et al. (2002) Cholangiocarcinoma: pictorial essay of CT and cholangiographic findings. RadioGraphics 22 : 173
Lacomis JM, Baron RL, Oliver JH, Nalesnik MA, Federle MP (1997) Cholangiocarcinoma: delayed CT contrast enhancement patterns. Radiology 203 : 98–104
Lim JH (2003) Cholangiocarcinoma: morphologic classification according to growth pattern and imaging findings. AJR Am J Roentgenol 181 : 819–827
Tani K,Kubota Y,Yamaguchi T et al. (1991) MR imaging of peripheral cholangiocarcinoma. J Comp Assist Tomogr 15 : 975–978
Vilgrain V,Van Beers BE, Flejou JF et al. (1997) Intrahepatic cholangiocarcinoma: MRI and pathologic correlation in 14 patients. J Comput Assist Tomogr 21 : 59–65
a |
b |
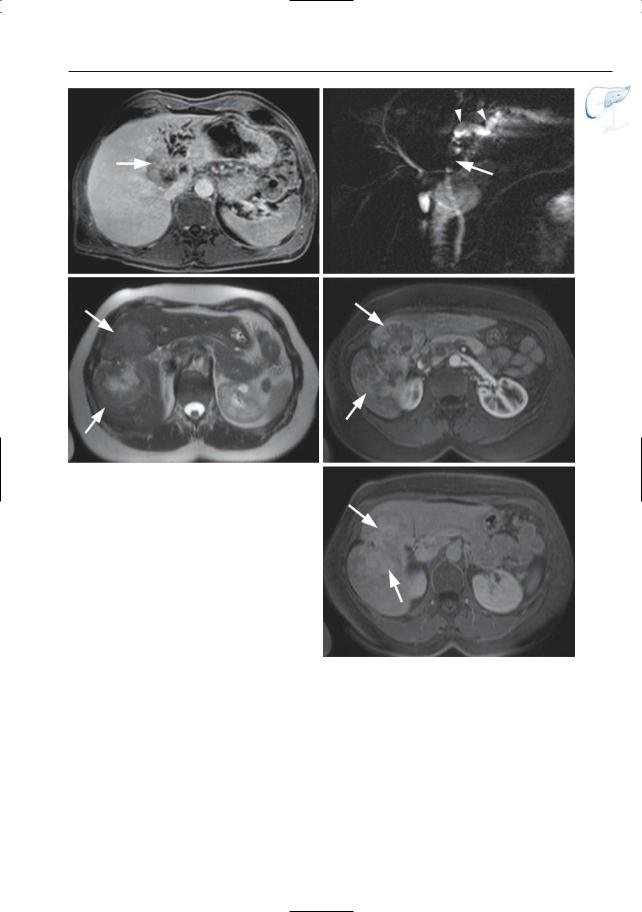
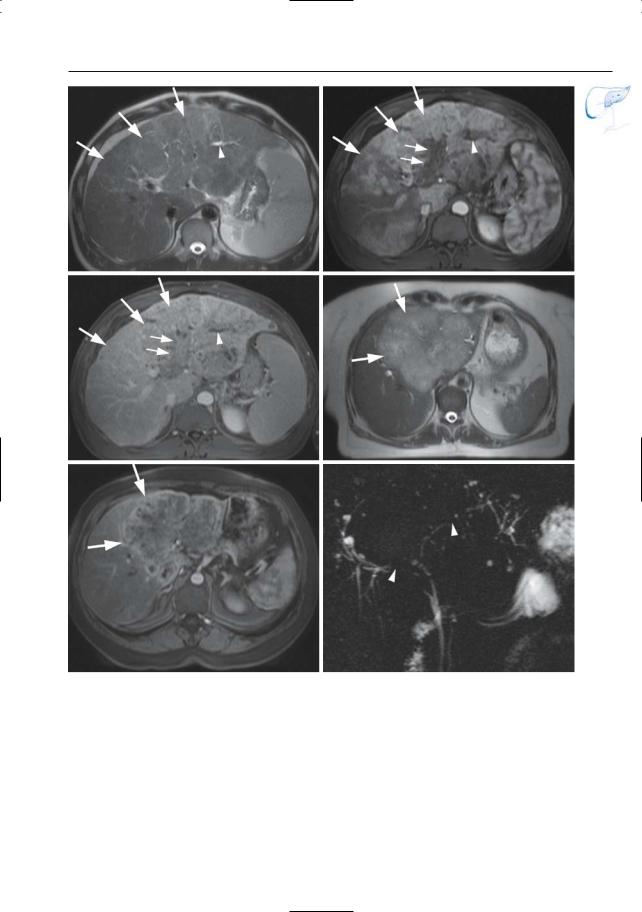
Fig. 55 a–d. a Axial T2-weighted HASTE image showing a T2 moderately hyperintense mass (arrow) with obstruction of the left intrahepatic duct (arrowheads). b Axial contrast-enhanced T1-
weighted VIBE image obtained in the arterial phase showing this mass to be hypointense, with only slight peripheral enhancement (arrow).
2 Intrahepatic Bile Ducts 115
c
e
Fig. 55. (continued) c Image obtained at same anatomical level after 10-min interval showing progressive delayed central enhancement (arrow). d Projective image showing obstruction of the left hepatic duct (arrow) with dilatation of the proximal intrahepatic ducts (arrowheads). e–g Different patient. Axial T2-weighted HASTE image showing a large heterogeneous T2 hyperintense mass in the right liver lobe (arrows). f Axial contrast-enhanced T1-weighted VIBE image obtained in the arterial phase showing this mass to be hypointense, with marked peripheral enhancement (arrows). g T1weighted VIBE image obtained after 10-min interval showing delayed central enhancement (arrows)
d
f
g

116 2.4 Malignant Tumors
#56 Recurrent Tumor After
Hepat(ic)ojejunostomy
Related topics: #29 (postoperative anatomy: after hepat(ic)ojejunostomy), #49 (after hepaticojejunostomy: anastomotic stricture)
KEY FACTS: DISEASE
●Although most hepaticojejunostomies are performed in patients with benign conditions, the technique may be part of a curative or palliative treatment of malignant neoplasms
●Sometimes combined with partial liver resection
●Biliary obstruction caused by tumor recurrence is not uncommon
KEY FACTS: MRI (FIG. 56)
●Cholangiographic images: usually not specific
–Stricture(s) (suspect if long, irregular, nonanastomotic)
–Dilation of proximal bile ducts
●Cross-sectional images (diagnostic if the tumor is sufficiently large):
–Mass lesion
References
Nordback IH, Hruban RH, Cameron JL (1992) Second primary lesion in the biliary tree after successful resection of ampullary carcinoma. Surgery 112 : 111–115
2 Intrahepatic Bile Ducts 117
a |
b |
c |
d |
Fig. 56. a, b Patient had previously undergone a Whipple operation for ampullary carcinoma. a Projective MR image showing jejunal loop and normal pancreatic duct (arrowheads). The biliary ducts, however, are dilated secondary to a stenosis of the hepatojejunal anastomosis (arrows). b Axial T1weighted image showing the tumor as a hypointense mass (arrowheads).c, d Patient who underwent a palliative hepaticojejunostomy for pancreatic carci-
noma, with recurrent progressive jaundice. c Coronal T2-weighted HASTE image showing progression of the tumor in the pancreatic head (large arrow), with obliteration and obstruction of the hepaticojejunostomy (small arrow). d projective image showing the obstructed hepaticojejunostomy (arrow) with dilated intrahepatic bile ducts. Note the slightly enlarged pancreatic duct (arrowheads) and the “black hole” corresponding to the tumor (small arrows).

118 2.4 Malignant Tumors
#57 Recurrent Tumor: Diagnostic
Problems Related to the
Presence of Endoprostheses
KEY FACTS: ENDOPROSTHESES
●Placement of an endoprosthesis is the treatment of choice in patients with unresectable bile duct carcinoma
●Types:
–Plastic endoprostheses
–Metallic endoprostheses (e.g., wall stent)
●Metallic endoprostheses provide longer stent patency but are much more expensive
KEY FACTS: MRI
●Plastic endoprostheses (Fig. 57a):
–Cause no artifacts and are usually seen as a thin, hypointense, tubular structure surrounded by fluid
!– May be invisible if not surrounded by fluid
●Metallic endoprostheses (Fig. 57b):
–Typically cause a signal void in and around the stent (local dephasing)
–This metallic artifact may preclude the detection of recurrent tumor (Fig. 57c, d) and the evaluation of stent patency
References
Adam A, Chetty N, Roddie M, Yeung E, Benjamin IS (1991) Self-expandable stainless steel endoprostheses for treatment of malignant bile duct obstruction. AJR Am J Roentgenol 156 : 321–325
Irie H, Honda H, Kuroiwa T et al. (2001) Pitfalls in MR cholangiopancreatographic interpretation. Radiographics 21 : 23–37
Merkle EM, Boll DT, Weidenbach H et al. (2001) Ability of MR cholangiography to reveal stent position and luminal diameter in patients with biliary endoprostheses: in vitro measurements and in vivo results in 30 patients. AJR Am J Roentgenol 176 : 913–918
O’Brien S, Hatfield AR, Craig PI, Williams SP (1995) A three year follow-up of self expanding metal stents in the endoscopic palliation of longterm survivors with malignant biliary obstruction. Gut 36 : 618–621
Watanabe Y, Dohke M, Ishimori T et al. (1999) Diagnostic pitfalls of MR cholangiopancreatography in the evaluation of the biliary tract and gallbladder. Radiographics 19 : 415–429

2 Intrahepatic Bile Ducts 119
a |
b |
c |
d |
Fig. 57. a Plastic endoprothesis in patient with Klatskin tumor. This type of endoprothesis does not cause artifact and is seen as a thin, fluid-filled structure (arrows). b Example of appearance of wall stent on cross-sectional images (arrows) in a different patient. c, d Patient with cholangiocarcinoma who had previously undergone palliative placement of a wall stent. c Projective MR image showing dilation of
intrahepatic bile ducts (arrow) and signal void caused by the stent (arrowheads). d Image obtained with PTC showing more clearly the dislodgement of the stent with the tip outside the biliary system (arrow) as well as narrowing of the stent caused by compression by tumor. The presence of tumor within a stent is not usually detected by MRCP because of the metallic artifact

120 2.4 Malignant Tumors
#58 Hepatocellular Carcinoma,
General
KEY FACTS: DISEASE
●Malignant tumor originating from hepatocytes
●Pathology (multistep progression): regenerative nodule, dysplastic nodule, dysplastic nodule with subfocus of hepatocellular carcinoma, small hepatocellular carcinoma (< 2 cm), hepatocellular carcinoma (Earls et al. 1996)
●80%–90% of all primary liver tumors
●Incidence:
–United States/Europe: 0.2%–0.8%
–Asia: 5.5%–20%
●Peak age: sixth to seventh decade (fibrolamellar hepatocellular carcinoma: <40 years)
●Etiology:
–Cirrhosis (particularly macronodular type)
–Chronic hepatitis B,C (12% of patients develop hepatocellular carcinoma)
–Metabolic diseases: hemochromato-
sis, a1-antitrypsin deficiency, porphyria cutanea tarda
–Aflatoxin
●Growth pattern:
–Solitary massive (27%–59%)
–Multicentric small nodular (15%–26%)
–Diffuse microscopic (15%–51%)
●a-Fetoprotein elevated in the majority of patients (not in cholangiocarcinoma)
●Note: Portal vein invasion occurs in 25%–40%
KEY FACTS: MRI
●Relationship between signal intensity and histology (signal intensity relative to normal liver): Table 58a (Earls et al. 1996)
●Practical hints concerning focal lesions in cirrhotic livers:
–Lesions slightly hyperintense on T2weighted images are always suspect for hepatocellular carcinoma
–Small lesions hypointense on T1and T2-weighted images are most likely to be benign (siderotic nodules)
–Most other combinations of signal intensity characteristics can be seen in both benign and malignant lesions
●Arterial blood supply with respect to histology: see Table 58b
●Obtaining arterial-phase contrast-en- hanced MR images is critical for:
–Accurate detection of small hepatocellular carcinoma foci
–Differentiation of hepatocellular carcinoma from typical regenerative and dysplastic nodules and other types of focal lesions
●Other features of hepatocellular carcinoma (Freeny et al. 1992):
–Large tumors: usually heterogeneous (e.g., hemorrhage, necrosis)
–Fibrous pseudocapsula (12% in the United States)
–Vascular invasion (typically direct extension in portal vein characterized by caliber expansion and enhancement of tumor thrombus)
–Signs of underlying cirrhosis
References
Earls JP, Theise ND, Weinreb JC et al. (1996) Dysplastic nodules and hepatcellular carcinoma: thin-sec- tion MR imaging of explanted cirrhotic livers with pathologic correlation. Radiology 201 : 207–214
Freeny PC, Baron RL, Teefey SA (1992) Hepatocellular carcinoma: reduced frequency of typical findings with dynamic contrast-enhanced CT in a non-Asian population. Radiology 182 : 143–148
Matsui O, Kadoya M, Kameyama T et al. (1991) Benign and malignant nodules in cirrhotic livers: distinction based on blood supply. Radiology 178 : 493–497
!
!

2 Intrahepatic Bile Ducts 121
Table 58.1a. Stepwise development of hepatocellular carcinoma from a regenerative nodule: signal intensity characteristics
Histology |
Signal intensity |
|
|
T1 |
T2 |
|
|
|
Regenerative nodule (RN) |
Isointense/hyperintense |
Isointense |
Siderotic regenerative nodule |
Hypointense |
Hypointense |
Dysplastic nodule (DN) |
Hyperintense |
Hypointense |
Siderotic dysplastic nodule |
Hypointense |
Hypointense |
Dysplastic nodule with subfocus of HCC |
Hyperintense |
Hypointense |
Small HCC |
Hyperintense |
Variable |
HCC |
Variable |
Variable |
|
|
|
HCC, hepatocellular carcinoma.
Table 58.1b. Stepwise development of hepatocellular carcinoma from a regenerative nodule: arterial blood supply
Histology |
Arterial blood supply |
Regenerative and dysplastic nodules |
Hypovascular (96%) |
Dysplastic nodule with subfocus of HCC |
Usually hypovascular |
Small HCC |
Usually hypervascular |
HCC |
Hypervascular (up to 95%) |
|
|
HCC, hepatocellular carcinoma.
122 2.4 Malignant Tumors
a |
b |
Fig. 58 a–c. a Axial T2-weighted HASTE image obtained in a patient with cirrhosis,showing multiple slightly hyperintense lesions (arrows). b, c Axial contrast-enhanced T1-weighted VIBE images obtained in the arterial (b) and venous (c) phases of perfusion showing these lesions to be hypervascu-
c lar (arrows) with a rapid wash-out (arrowheads), typical for multifocal hepatocellular carcinoma
2 Intrahepatic Bile Ducts 123
d |
e |
f |
g |
Fig. 58 d–g. (continued) d Axial T2-weighted HASTE image showing a slightly hyperintense lesion (arrow) with a central high signal intensity focus (arrowhead), possibly due to central fat or necrosis. e Axial T1-weighted image ”out of phase” shows that this central high signal intensity focus drops (arrowhead) in signal, thus suggesting the
presence of fat. f, g Axial contrast-enhanced T1weighted VIBE images obtained in the arterial (f) and venous (g) phases showing the lesion to be hypervascular (arrow) with a rapid wash-out and presence of a (pseudo-) capsule (arrowhead). Histologic diagnosis: hepatocellular carcinoma

124 2.4 Malignant Tumors
#59 Hepatocellular Carcinoma,
Biliary Invasion
KEY FACTS: DISEASE
●While portal vein invasion by hepatocellular carcinoma is common, biliary invasion is relatively rare
KEY FACTS: MRI
●Imaging findings may include the following:
–Focal stenosis
–Scattered irregular strictures (infiltrating type)
–Polypoid intraluminal mass (rare)
References
Kojiro M, Kawabata K, Kawano Y, Shirai F, Takemoto N,Nakashima T (1982) Hepatocellular carcinoma presenting as intrabile duct tumor growth: a clinicopathologic study of 24 cases. Cancer 49 : 2144–2147
Lee NW, Wong KP, Siu KF, Wong J (1984) Cholangiography in hepatocellular carcinoma with obstructive jaundice. Clin Radiol 35 : 119–123
Soyer P, Laissy JP, Bluemke DA, Sievert A, Menu Y (1995) Bile duct involvement in hepatocellular carcinoma: MR demonstration. Abdom Imaging 20 : 118–121
2 Intrahepatic Bile Ducts 125
a |
b |
c |
d |
e |
f |
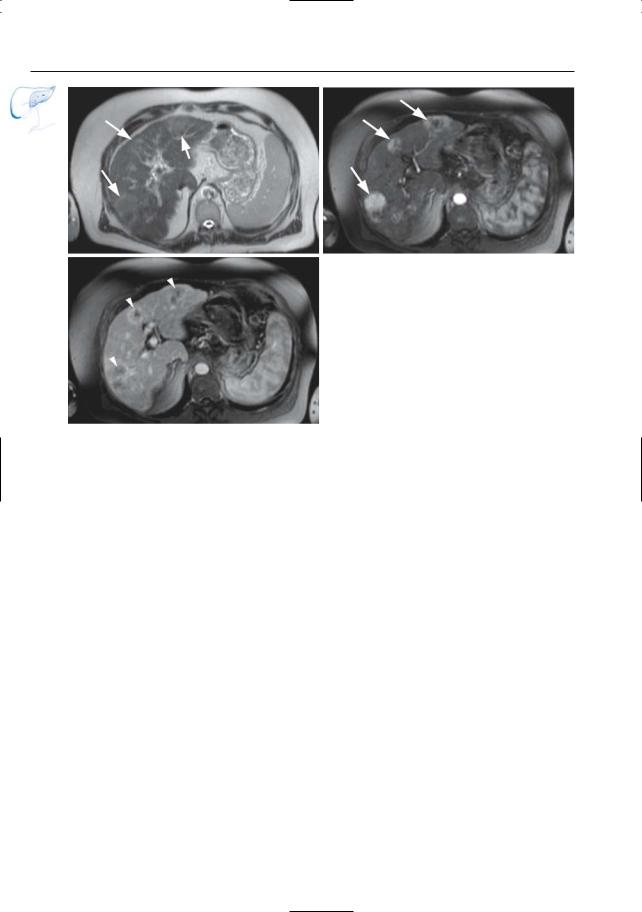
Fig. 59 a–c. a Axial T2-weighted HASTE image showing a large slightly hyperintense infiltrating mass (arrows) with secondary left hepatic bile duct dilatation due to invasion (arrowhead). b, c Axial contrast-enhanced T1-weighted VIBE images obtained in the arterial (b) and venous (c) phase showing this infiltrating mass to be hypervascular (arrows). Note the invasion and secondary thrombosis of the left portal vein (small arrows) and the dilated
left hepatic bile ducts (arrowhead). d–f Different patient. d Axial T2-weighted HASTE image showing a large slightly hyperintense mass (arrows). e Axial contrast-enhanced T1-weighted VIBE images obtained in the arterial phase showing this to be a hypervascular mass (arrows). f Projective image showing the intrahepatic bile ducts to be severely displaced with multiple obliterations due to invasion (arrowheads)

126 2.4 Malignant Tumors
#60 Metastases
Related topics: #91 (bile duct involvement by other extrabiliary neoplasms), # 196 (secondary pancreatic tumors)
KEY FACTS: DISEASE
●Liver is the most common metastatic site after regional lymph nodes
●Organ of origin: colon (42%), stomach (23%), pancreas (21%), breast (14%), lung (13%)
KEY FACTS: MRI
●Displacement, stenosis, encasement, obstruction, separation, and diminished arborization may all be seen
!● Care should be taken not to confuse cystic/necrotic metastases with simple cysts, particularly on heavily T2weighted images (solid component invisible; see # 193):
–Metastases commonly containing a large necrotic or cystic component include metastases of mucinous carcinoma, colon carcinoma, sarcoma, melanoma, lung carcinoma, and endocrine tumors
–Diagnostic clues: solid peripheral component; rim enhancement (Fig. 193)
●Contrast-enhanced scans:
–Arterial phase (± 25 s): hypovascular primary tumors: peripheral rim enhancement or no enhancement; hypervascular primary tumors (e.g., renal cell carcinoma, malignant melanoma, endocrine tumors, adrenal carcinoma): rim enhancement or global enhancement
–Hepatic phase (± 70 s): usually hypointense
–Delayed phase (5–10 min): peripheral low-intensity halo is typical (“washout” of contrast medium; Mahfouz et al. 1994)
References
Mahfouz AE, Hamm B, Wolf KJ (1994) Peripheral washout: a sign of malignancy on dynamic gadolinium-enhanced MR images of focal liver lesions. Radiology 190 : 49–52
Van Hoe L, Bosmans H, Aerts P, Baert AL, Fevery J, Kiefer B, Marchal G (1996) Focal liver lesions fast T2-weighted MR imaging with half-Fourier rapid acquisition with relaxation enhancement. Radiology 201 : 817–823
2 Intrahepatic Bile Ducts 127
b
a
c |
d |
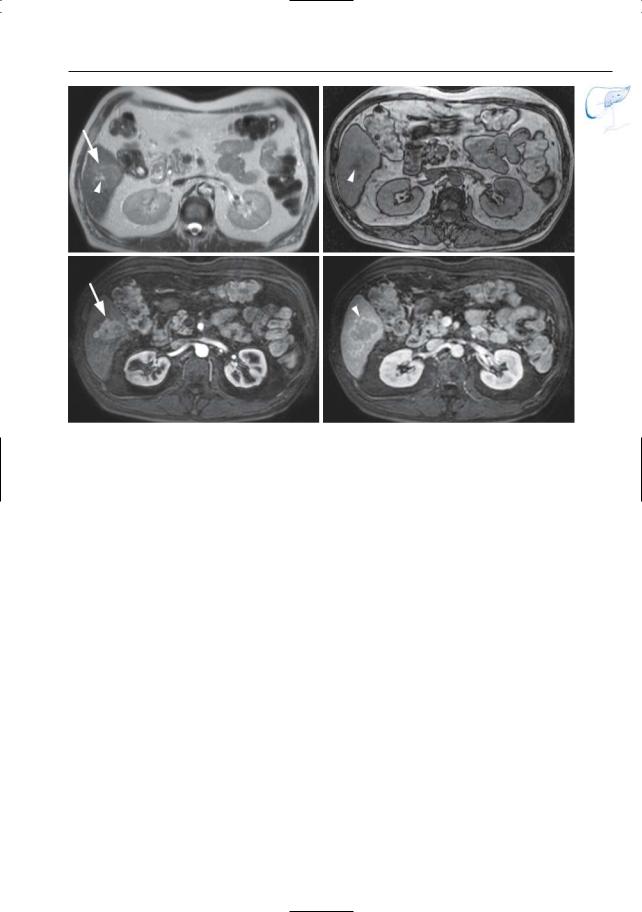
Fig. 60 a–d. Patient with a history of radiofrequency ablation of liver metastases. a, b Coronal and c axial T2-weighted HASTE images showing a large necrotic lesion (arrow) secondary to the known RF ablation, together with multiple recurrent liver
metastases (small arrows), with secondary bile duct invasion and biliary dilatation (arrowheads). d Projective image showing dilated bile ducts due to invasion by metastatic disease (arrows). Note the large necrotic mass secondary to the RF ablation