

Книги по МРТ КТ на английском языке / MRI for Orthopaedic Surgeons Khanna ed 2010
.pdf60 I Initial Concepts
Fig. 2.58 A sagittal proton-density fat-suppressed image of the ankle showing the Achilles tendon and plantar aponeurosis. Flexor and extensor tendons crossing the ankle are also seen.
and metatarsals. Precise identification of the central osseous structures is facilitated by concurrent correlation with the axial and coronal images. The first MTP joint structures are visualized particularly well in the sagittal plane. Although coronal and axial images are better suited for identification of the ligamentous complexes of the ankle, the plantar plate and ligament structures of the MTP joints can be identified in the sagittal plane.
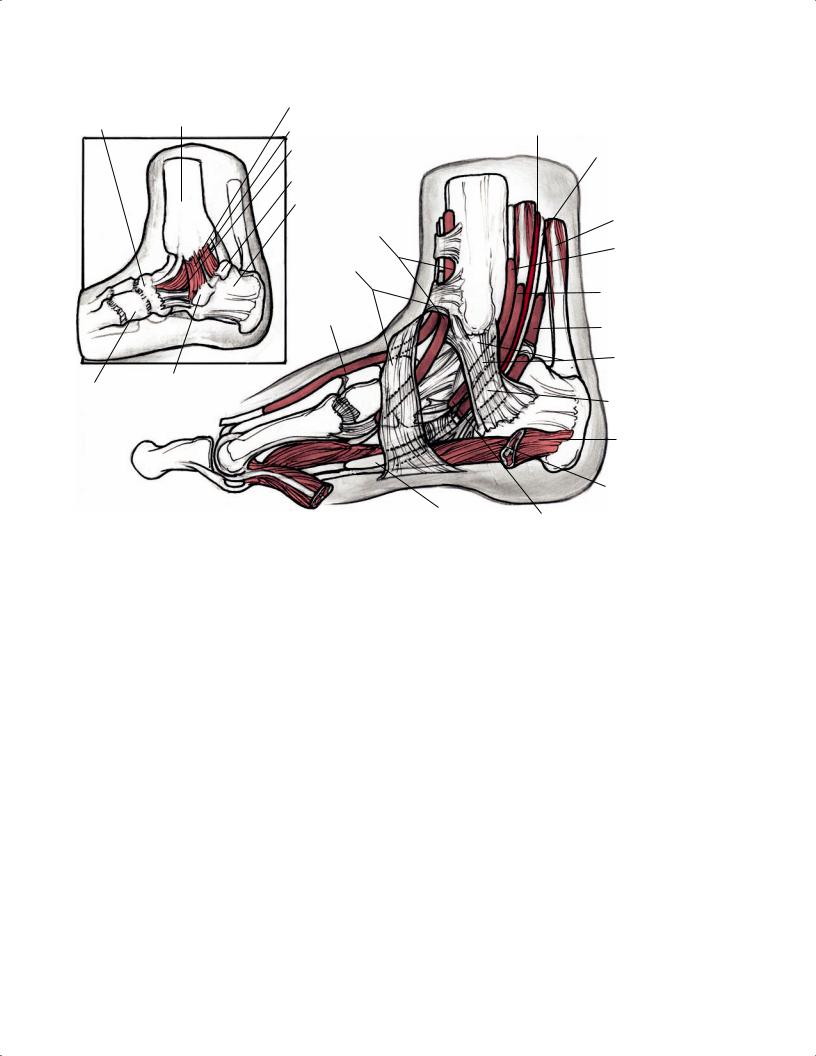
The Achilles tendon, easily identified as the most posterior tendon inserting onto the posterior calcaneal tuberosity, can be inspected for thickening, intratendinous signal heterogeneity, partial tearing, or complete rupture with retraction (Fig. 2.58). Immediately deep to this structure is the retrocalcaneal bursa, which can show increased signal intensity on T2-weighted images, suggestive of retrocalcaneal bursitis. The posterior tibial tendon is the first structure posterior to the medial malleolus. The course of this tendon can be appreciated as it curves around the medial malleolus to insert onto the tuberosity of the navicular bone. The next two medial tendons are the flexor digito-
rum longus and FHL (Fig. 2.59). The flexor digitorum longus tendon is located just posterior to the posterior tibialis tendon and medial to the posterior neurovascular bundle. The FHL, the deepest muscle in the posterior compartment, lies against the tibia. Lateral to the FHL are the peroneal tendons, which course posterior to the lateral malleolus and then toward the plantar midfoot. The anterior tibialis, extensor hallucis longus, and extensor digitorum longus tendons can be visualized anteriorly. In particular, the anterior tibialis tendon can be identified on sagittal imaging and should be evaluated for tenosynovitis, partial tear, or rupture.
■ General Spine Anatomy
Intervertebral Discs
The normal discovertebral complex has three components:
•Cartilaginous end plate
•Annulus fibrosus
•Nucleus pulposus
Overall, the intervertebral discs show intermediate signal intensity on T1-weighted images and high signal intensity on T2-weighted images. The outer annulus appears hypointense on T2-weighted images, whereas the inner annulus, which is composed of fibrocartilage and a high proportion of type II collagen, is indistinguishable from the hyperintense nucleus pulposus. Compared with normal vertebral marrow, the nucleus pulposus, which is composed of a proteoglycan matrix and type II collagen, appears hyperintense on T2-weighted images and hypointense on T1-weighted images.14 As the disc degenerates and as patients age, the signal intensity of the nucleus pulposus decreases on T2-weighted images and becomes dark on all pulse sequences with advanced degenerative changes. Additional pulse sequences, such as fat-suppressed T2-weighted images, are useful for accentuating fluid and edema, which may help in delineating spine pathology. Special attention should be given to the posterior aspect of the disc on both sagittal and axial T2-weighted images to evaluate for disc protrusion, extrusion, sequestration, or other pathology that may be contributing to central canal or neural foraminal stenosis.
The end plate is a flat, osseous disc with a slightly elevated rim secondary to the attached ring apophysis, which produces a central depression in the end plate that is occupied by hyaline cartilage.14 The annulus is composed of type I collagen fibers (Sharpey’s fibers) that are attached to the ring apophysis periosteum. The annulus also blends with the anterior and posterior longitudinal ligaments. T1-weighted images provide optimal evaluation of anatomy, fracture lines, and other osseous detail. T1-weighted images also clearly
|
|
2 |
Normal MRI Anatomy of the Musculoskeletal System |
61 |
||
|
|
Deltoid lig. posterior tibiotalar fibers |
|
|
|
|
Navicular |
Tibia |
Deltoid lig. tibiocalcaneal fibers |
|
Posterior tibial a. |
|
|
|
|
|
|
|||
|
|
Deltoid lig. tibionavicular fibers |
|
Posterior tibial n. |
|
|
|
|
|
|
|
||
|
|
Medial tubercle of talus |
|
|
|
|
|
|
Calcaneus |
|
|
|
|
|
|
Tibialis anterior |
|
Calcaneal tendon |
|
|
|
|
tendon sheath |
|
|
|
|
|
|
Inferior extensor |
|
Tibialis posterior |
|
|
|
|
|
tendon sheath |
|
||
|
|
retinaculum |
|
|
||
|
|
|
|
|
|
|
|
|
|
|
Flexor digitorum |
|
|
|
|
Extensor hallucis |
T. |
longus tendon sheath |
|
|
|
|
longus tendon |
|
|
|
|
|
|
|
|
|
|
|
|
|
sheath |
|
FHL tendon sheath |
|
|
Superior flexor
retinaculum
Sustentaculum tali site
Cuboid
Sustentaculum tali site
Abductor hallucis longus m.
Flexor digitorum brevis m.
FHL tendon
Tibialis posterior sheath
Fig. 2.59 Medial 3D illustrations of the right ankle showing the tibialis posterior tendon, flexor digitorum longus tendon, and the FHL tendon coursing posterior to the medial malleolus, deep to the flexor retinaculum. The inset shows the various components of the deltoid ligament.
A
Spinous process
C2
C7
T1
D
Spinous process
Lamina
C1
Vertebral body
Transverse
foramen
Pedicle
Uncovertebral joint
Pedicle
|
Vertebral |
|
|
body |
Superior articular |
Uncovertebral joint |
|
|
|
process |
|
|
|
Transverse foramen
Inferior articular process
Vertebral body (C4)
Superior articular process
Inferior articular process
Lamina
Spinous process
Vertebral body (C7)
Transverse foramen
Transverse process
Transverse foramen |
Superior articular |
process |
|
|
Inferior articular |
Lamina |
process |
Spinous process |
|
Inferior articular |
|
process |
|
B
C
E
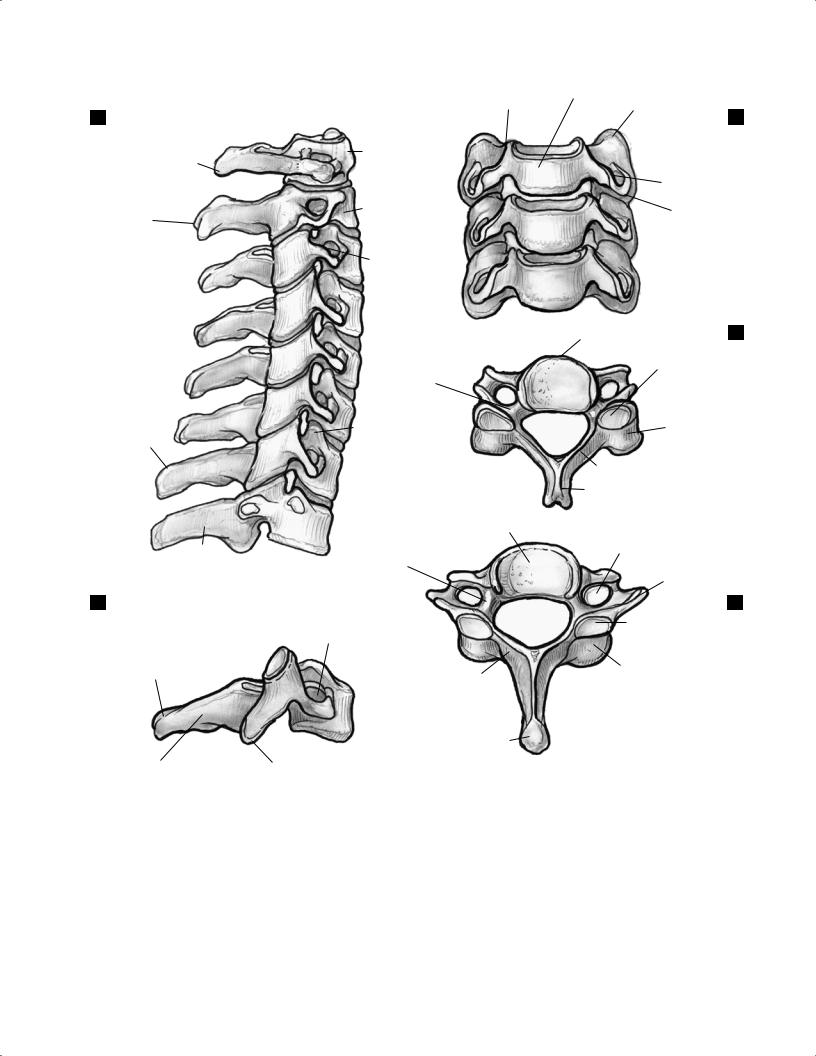
Fig. 2.60 Various views of the cervical vertebral bodies: (A) lateral vertebral body at C1-T1, (B) lateral AP vertebral body at C4-C7, (C) axial vertebral body at C4, (D) lateral vertebral body at C7, and (E) axial vertebral body at C7.
delineate the relationships of the vertebral bodies, intervertebral discs, central canal, and posterior elements.
Vertebral Bodies
Normal lordosis should be seen in the cervical and lumbar spine, and normal kyphosis should be present in the thoracic
spine. The superior and inferior end plates should be intact and parallel to one another in the absence of vertebral compression fractures, other fractures, or infection. The subaxial cervical vertebral bodies all have a similar appearance (Fig. 2.60), whereas the atlas (C1) has no vertebral body and the axis (C2) has an odontoid process. Each of the lumbar vertebral bodies also has a similar appearance (Fig. 2.61), as do the
2 Normal MRI Anatomy of the Musculoskeletal System 63
A
Spinous
process
Lamina
C
Vertebral body
Superior articular process
Mamillary process
B
Transverse Inferior process articular process
Superior articular process
Vertebral body
Transverse process
|
|
Vertebral |
Transverse |
|
|
|
|
process |
|
|
|
|
|
body |
|
|
|
|
|
Pedicle |
Superior |
||
|
|
|
|||
|
|
|
|
articular process |
|
|
|
|
|
D |
|
|
|
|
|
|
|
|
|
|
|
Lamina |
|
|
|
|
|
Spinous |
|
|
Pedicle |
|
|
process |
|
|
|
|
|
|
|
|
Transverse |
|
|
|
|
|
process |
|
|
|
|
|
|
|
Mamillary |
|
|
|
|
|
process |
|
|
|
Mamillary |
|
Inferior |
|
|
|
process |
|
|
|
|
|
|
articular process |
|
|
|
|
|
|
|
|
|
Lamina |
Superior |
|
|
|
|
|
articular process |
|
|
|
|
Spinous process
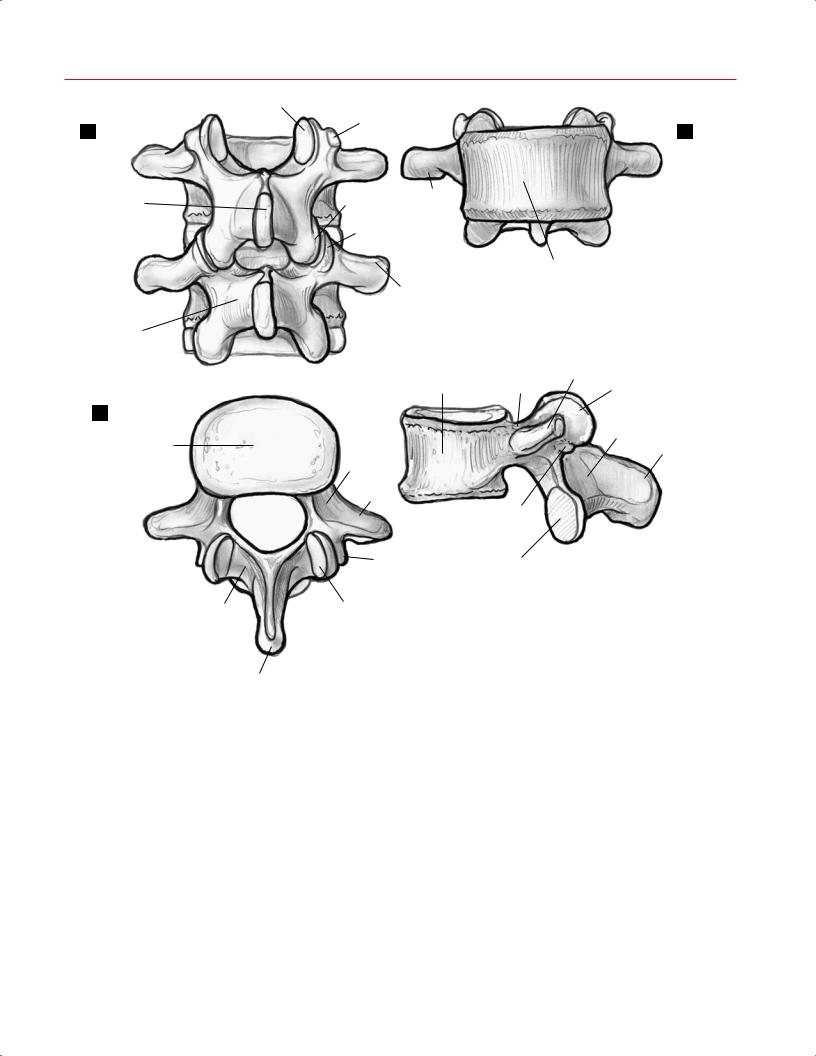
Fig. 2.61 Various views of the L3 and L4 lumbar vertebral bodies: (A) posterior, (B) anterior, (C) axial, and (D) lateral.
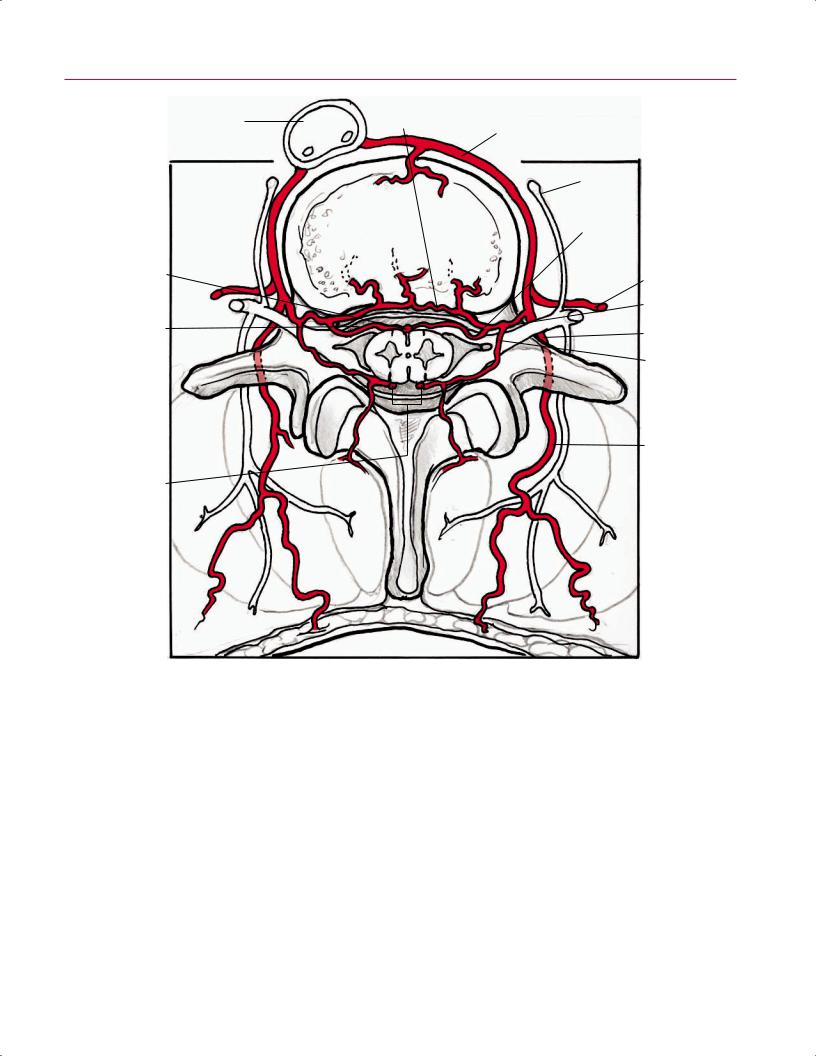
thoracic vertebral bodies (Fig. 2.62). The anterior and posterior longitudinal ligaments, seen along the vertebral bodies, have low signal intensity. The entry site of the basivertebral veins is seen at the midportion of the posterior vertebral bodies. The spinal and radicular arteries course around the cord’s anterior, posterior, and lateral aspects within the vertebral canal (Fig. 2.63). Fat-suppression techniques can be used to nullify marrow signal and increase the sensitivity in the evaluation of neoplastic and infiltrative processes.
CSF
Like other fluids, CSF has low signal intensity on T1-weighted images and high signal intensity on T2-weighted images. On sagittal and axial images, CSF is seen surrounding the spinal cord in the cervical, thoracic, and lumbar spine and around the cauda equina in the lower lumbar spine. Thus, T2-weighted images provide a myelographic appearance that allows for the detection of spinal stenosis.

64 I Initial Concepts
|
Bony end plate |
|
|
|
|
B |
|
A |
Ring apophysis |
Anterior longitudinal lig. |
Costovertebral joint |
||||
|
|
||||||
|
|
|
|||||
|
|
|
|
|
|||
|
|
|
Pedicle |
|
Transverse |
|
|
|
|
|
|
process |
|
||
|
|
|
|
|
|
||
|
Accessory |
|
Transverse |
T5 |
Costotransverse |
|
|
|
|
process |
|
||||
|
process |
|
|
||||
|
|
|
|
lig. |
|
||
|
|
|
|
|
|
||
|
|
|
|
|
Rib |
|
|
|
Mammilary |
|
Lamina |
T6 |
|
|
|
|
process |
|
|
|
|||
|
|
Spinous |
|
|
|||
|
Superior articular |
|
|
|
|
||
|
|
process |
|
|
|
||
|
process |
|
|
|
|
||
|
|
|
|
|
|
||
|
|
Pedicle |
Superior articular |
T7 |
|
|
|
|
|
|
|
|
|||
|
|
|
process |
|
|
|
|
|
|
|
Transverse |
Costovertebral |
|
|
|
|
|
|
ligs. |
|
|
||
|
|
|
process |
Spinous process |
|
||
|
|
|
|
|
|||
|
Rib |
|
Lamina |
Superior articular process |
|
||
|
|
|
|
|
Transverse |
|
|
|
|
|
Inferior articular |
|
process |
|
|
|
Costovertebral |
|
process |
|
|
|
|
|
|
|
|
|
|
||
|
ligs. |
|
|
|
|
|
|
|
|
|
Superior |
Accessory |
|
|
|
|
|
|
articular |
|
|
||
|
|
|
process |
process |
Spinous |
|
|
|
|
|
|
|
|
||
|
|
|
|
|
process |
|
|
|
|
|
|
Inferior articular process |
|
|
|
|
Costotransverse |
|
|
Lamina |
D |
||
|
lig. |
|
|
|
|
|
|
|
|
|
|
|
|
||
C |
|
Spinous process |
|
|
|
||
Fig. 2.62 Axial (A), lateral (B), posterior oblique (C), and lateral (D) illustrations of the osseous structures of the thoracic spine, the costovertebral joints, and the costotransverse and costovertebral ligaments.
Spinal Cord
Sagittal T2-weighted images provide a myelographic e ect that allows for the evaluation of spinal cord morphology and the presence of extrinsic compression. The cord should have homogeneous signal intensity in the absence of intrinsic pathology. On axial T2-weighted images, the central gray matter can be faintly identified. Specialized sequences obtained with high magnetic field magnets allow for detailed evaluation of central gray matter (Fig. 2.64). The spinal cord should terminate at or above the L1-L2 level in adults.
Ligaments
Normal ligaments should have low signal intensity on all pulse sequences. The transverse ligament can be seen posterior to the odontoid process (Fig. 2.65) and is best visualized on axial images. The ligamentum flavum connects the lamina of adjacent vertebrae and is seen as a hypointense band posterior to the dura. The anterior longitudinal ligament is broad, thick, and adherent to the anterior vertebral bodies. The posterior longitudinal ligament is thin, attached to the posterior vertebral cortex via the midline septum,
2 Normal MRI Anatomy of the Musculoskeletal System 65
Branch to
Aorta vertebrae and dura
Segmental a.
Anterior spinal a.
Dura
Posterior spinal aa.
Paravertebral ganglion
Anterior radicular a.
Intercostal a.
Spinal a.
Posterior intercostal a.
Posterior radicular a.
Branches to posterior
spinal muscles
Fig. 2.63 A 3D illustration (axial view) of the spinal, intercostal, and other arteries that supply the thoracic spine.
66 I Initial Concepts
A
|
Thyroid cartilage |
|
Anterior |
|
Carotid |
|
|
Omohyoid m. |
Posterior |
longitudinal lig. |
sheath |
|
|
|
|
Longus capitis |
|
|
||
|
longitudinal lig. |
|
|
|||
|
|
|
|
|||
|
Sternothyroid m. |
|
|
and colli mm. |
Common |
|
|
|
|
|
|
||
|
|
|
|
|
carotid a. |
Internal |
|
Vertebral a. |
|
|
|
|
|
|
|
|
|
Vagus n. |
jugular v. |
|
|
|
|
|
|
|
|
|
|
|
|
|
Sternocleidomastoid m. |
|
|
Exiting nerve |
|
|
|
|
External |
|
root |
|
|
|
|
|
|
|
|
|
|
jugular v. |
|
|
|
|
|
|
|
|
|
|
|
|
|
|
Anterior scalene |
|
Superior |
|
|
|
|
m. |
|
|
|
|
|
|
|
|
articular |
|
|
|
|
Medial scalene |
|
facet |
|
|
|
|
m. |
|
Cord |
|
|
|
|
Levator |
|
|
|
|
|
scapulae m. |
|
|
|
|
|
|
|
Longissimus |
|
Ligamentum |
|
|
|
|
cervicis m. |
|
|
|
|
|
|
|
|
flavum |
|
|
|
|
|
|
Multifidus m. |
|
|
Splenius capitis m. |
||
|
|
|
|
|
||
|
Semispinalis |
Spinous process |
Longissimus |
|
|
|
|
capitis m. |
|
|
capitis m. |
|
|
B |
|
|
Trapezius m. |
|||
|
|
|
|
|||
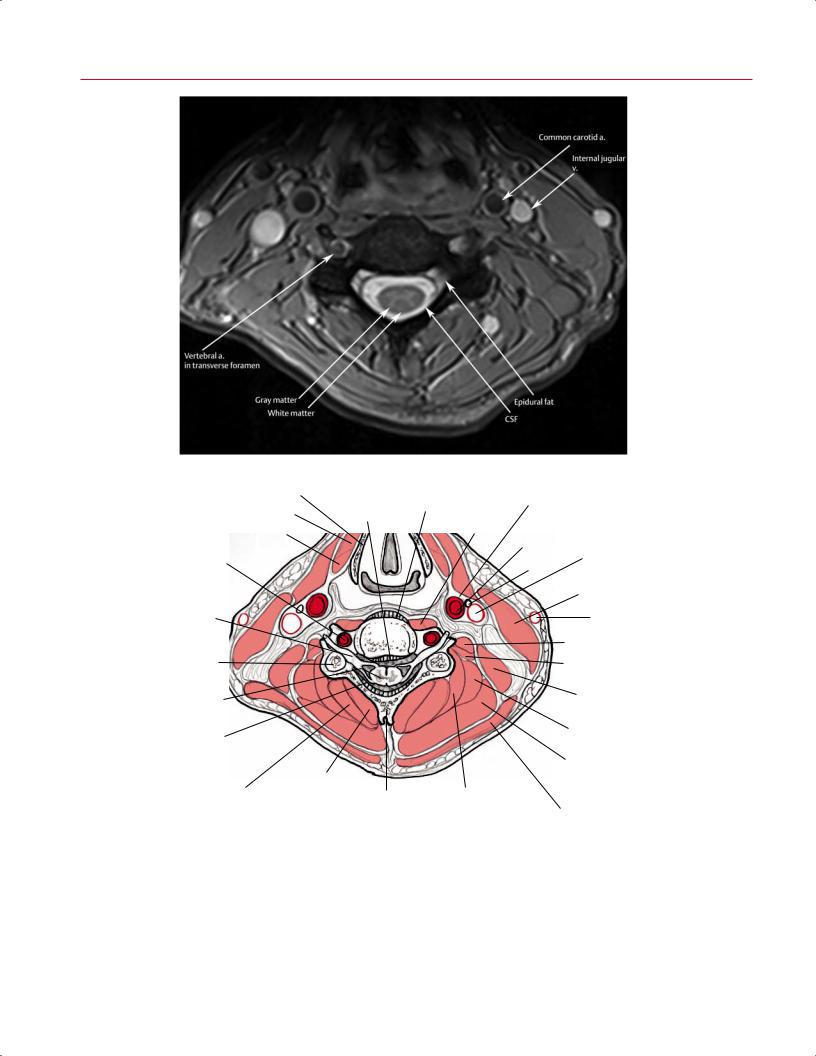
Fig. 2.64 An axial T2-weighted image (A) and artist’s sketch (B) clearly defining the gray and white matter of the cervical spinal cord, the CSF within the subarachnoid space, and epidural fat. Normal flow voids are seen within the carotid and vertebral arteries.
|
|
|
|
2 Normal MRI Anatomy of the Musculoskeletal System |
67 |
||||
|
|
|
|
Tentorium cerebelli |
Tectorial membrane |
|
|
||
|
|
Tentorial membrane (retracted cut) |
|
Upper cruciform lig. |
|
||||
|
|
|
Apical lig. of dens |
|
|
|
|
|
|
|
|
|
Cruciform lig. (longitudinal part) |
|
|
|
|
|
|
|
|
|
Alar lig. |
|
|
|
|
|
|
|
|
|
|
Cruciform lig. (transverse part) |
|
|
|
|
|
|
|
Occipital |
|
Atlantooccipital articular capsule |
|
|
|
|
|
|
|
|
|
|
|
|
|
|
|
|
|
|
|
|
Pharyngeal tonsil |
|
|||
|
|
|
|
Occipital |
Anterior |
|
|||
|
|
C1 |
|
Posterior |
|
||||
|
|
|
atlantooccipital lig. |
|
|||||
|
|
|
|
atlantooccipital |
|
|
|
|
|
|
|
|
|
membrane |
C1 |
|
|||
|
|
Vertebral a. |
|
C1 |
Anterior |
|
|||
|
|
|
|
Posterior |
|
||||
|
|
|
|
atlantoaxial lig. |
|
||||
|
|
|
|
atlantoaxial lig. |
|
|
|
|
|
|
|
C2 |
|
|
C2 |
|
|||
|
|
|
|
C2 |
C3 |
|
|||
|
|
|
|
|
|
||||
|
|
|
|
|
C3 - C4 disc |
|
|||
A |
|
|
|
|
|||||
|
|
|
|
|
|
|
|
||
|
|
|
|
|
|
|
|
||
|
|
Posterior longitudinal lig. |
Dura mater of vertebral canal |
|
B |
|
|
||
|
|
|
|
|
|
|
|
||
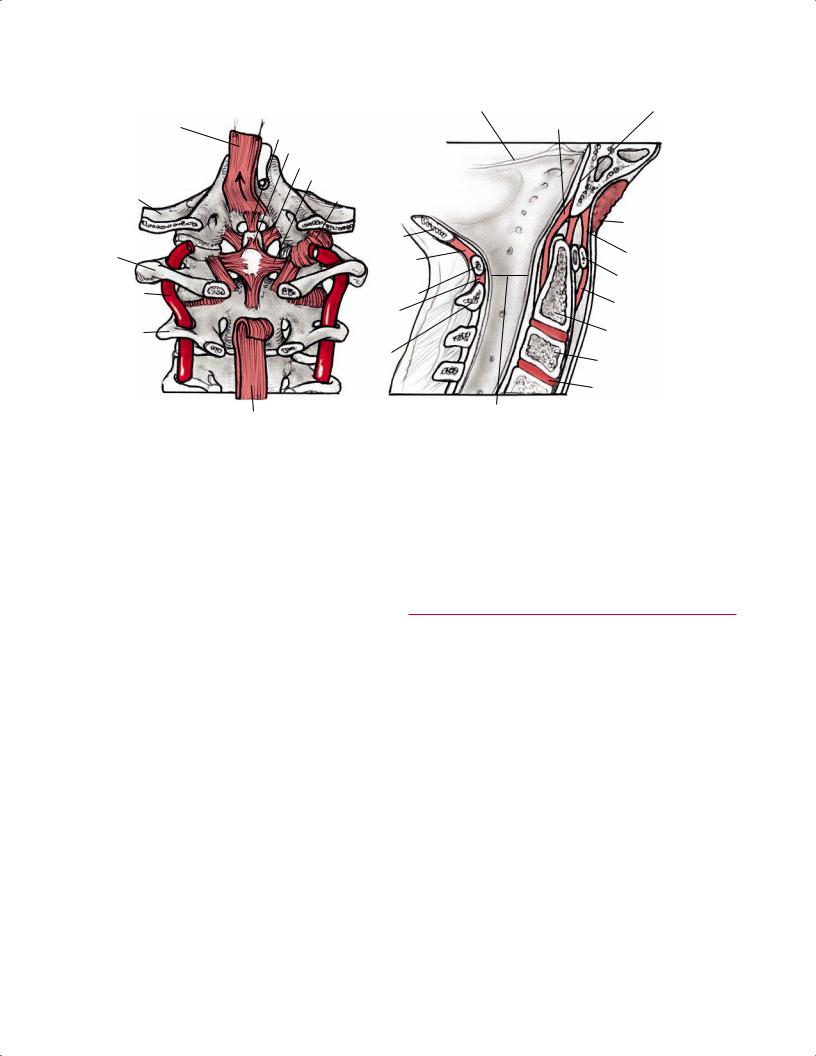
Fig. 2.65 Posteroanterior (A) and sagittal (B) illustrations showing the ligamentous structures of the skull base and cervical spine, including the alar ligament, cruciform ligament, and atlantooccipital ligaments.
and defines the posterior margin of the anterior epidural space at the midline (Fig. 2.66). The anterior epidural space is not apparent at the disc level because the posterior longitudinal ligament fuses to the discs. Visualization of these structures may be limited with MRI because of partial volume averaging with the adjacent vertebral body.15
Roots and Foramina
The dorsal and ventral nerve roots can be identified within the neural foramina on the parasagittal images and the axial images, and the exiting nerve root is located just posterior to the vertebral artery in the cervical spine (Fig. 2.67). Additional neural structures, including the sympathetic chain, are located in and around the cervical vertebral bodies (Fig. 2.68). Note that the C2 nerve root exits the spine above the C2 pedicle and runs parallel to the C1-C2 facet joint (Fig. 2.69). The nerve roots have intermediate signal intensity and are surrounded by high signal intensity fat on T1-weighted images and by high signal intensity CSF on T2weighted images.
■ Cervical Spine
Sagittal Images
The T1-weighted and T2-weighted sagittal images should be reviewed first to evaluate the spinal anatomy (Fig. 2.70). The midsagittal image from the cervicomedullary to cervicothoracic junctions is a good anatomic screen of the cervical vertebral bodies, intervertebral discs, spinal cord, thecal sac, and posterior elements. To find the midsagittal image, the sagittal series should be reviewed for the image that best shows the entire cervical spinal cord and the odontoid process, basion, opisthion, midbrain, and fourth ventricle.
Sequential evaluation of the sagittal series away from the midsagittal image allows for assessment of facet joints and neural foramina (Fig. 2.71). The foramina have an oblique orientation to the sagittal plane, which can cause distortion and lead to artifactual narrowing. T1-weighted images are somewhat limited because they a ord poor di erentiation of the vertebral body, the annular-posterior longitudinal ligament complex, and the CSF in the adjacent thecal sac16; the posterior longitudinal ligament, a disc herniation, an osseous
68 I Initial Concepts
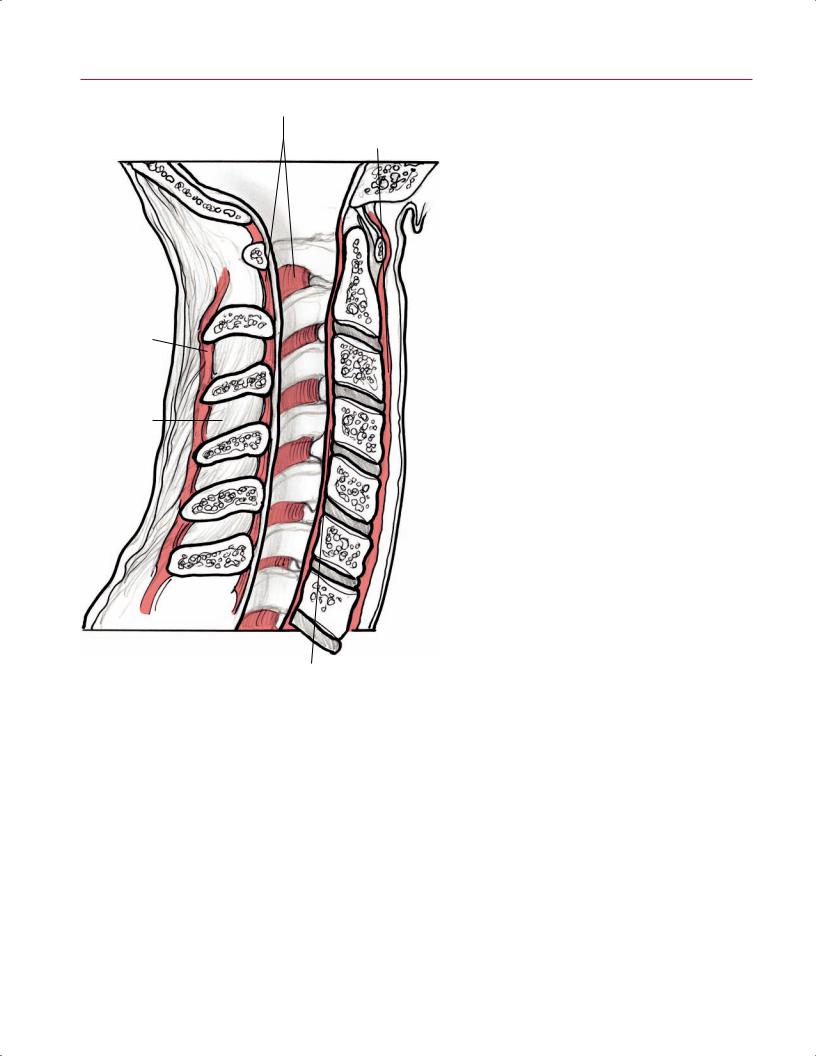
Ligamentum flavum |
Fig. 2.66 An illustration (lateral view) of the cervical spine |
|
showing the midsagittal ligaments. |
Anterior longitudinal lig. |
|
Supraspinous lig.
Interspinous lig.
Posterior longitudinal lig.
spur, and CSF all appear as a low-intensity signal on T1weighted sagittal images.16 The CSF–extradural interface is well defined on T2-weighted images, and a myelographic appearance is produced on T2-weighted sagittal images because of the CSF’s high signal. The intervertebral discs show intermediate signal intensity on T1-weighted images and high signal intensity on T2-weighted and gradient-echo images.
The cervical vertebral body has bright signal intensity on T1-weighted images because of the presence of normal fatty
bone marrow. Normal cervical spine lordosis should be observed. The AP diameter of the canal tapers from the first to third cervical levels and then is relatively constant. Parasagittal images show the short cervical pedicles. The anterior and posterior longitudinal ligaments are depicted as low signal intensity linear structures along the vertebral bodies.15,17,18 Often, a small cortical defect is seen in the midportion of the posterior vertebral body; this defect represents a vascular channel and is a normal finding.
Ventral root
Pia
Symphathetic ganglion
Ventral ramus
Dorsal ramus
Spinal n.
Dorsal root ganglion
Dorsal root
Dentate ligament
Arachnoid membrane
Dura
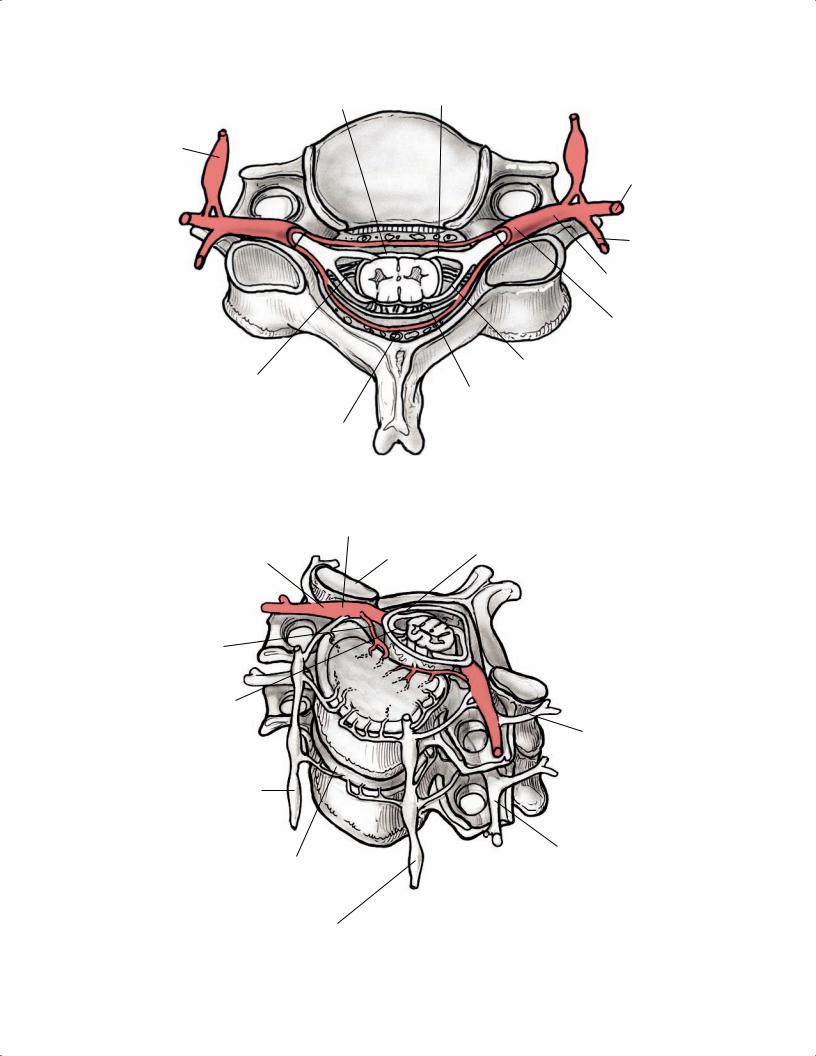
Fig. 2.67 An illustration (axial view) of the neural structures originating from the cervical spinal cord.
Dorsal root ganglion
|
Superior articular |
Dorsal root |
|
Spinal n. |
facet |
||
|
|||
|
|
|
|
|
Cord |
|
|
|
|
||
Recurrent |
|
|
|
Dura |
|
|
|
||
meningeal n. |
|
|
|
|
Ventral rami
Posterior primary division (ventral ramus)
Sympathetic ganglion
|
Anterior primary |
Vertebral disc |
division (ventral ramus) |
Sympathetic ganglion
Fig. 2.68 A 3D illustration (anterosuperior view) of the neural structures in and around the cervical spine.