

Книги по МРТ КТ на английском языке / MRI for Orthopaedic Surgeons Khanna ed 2010
.pdfAvailable for academic purposes
80 I Initial Concepts
toward more accessible knowledge
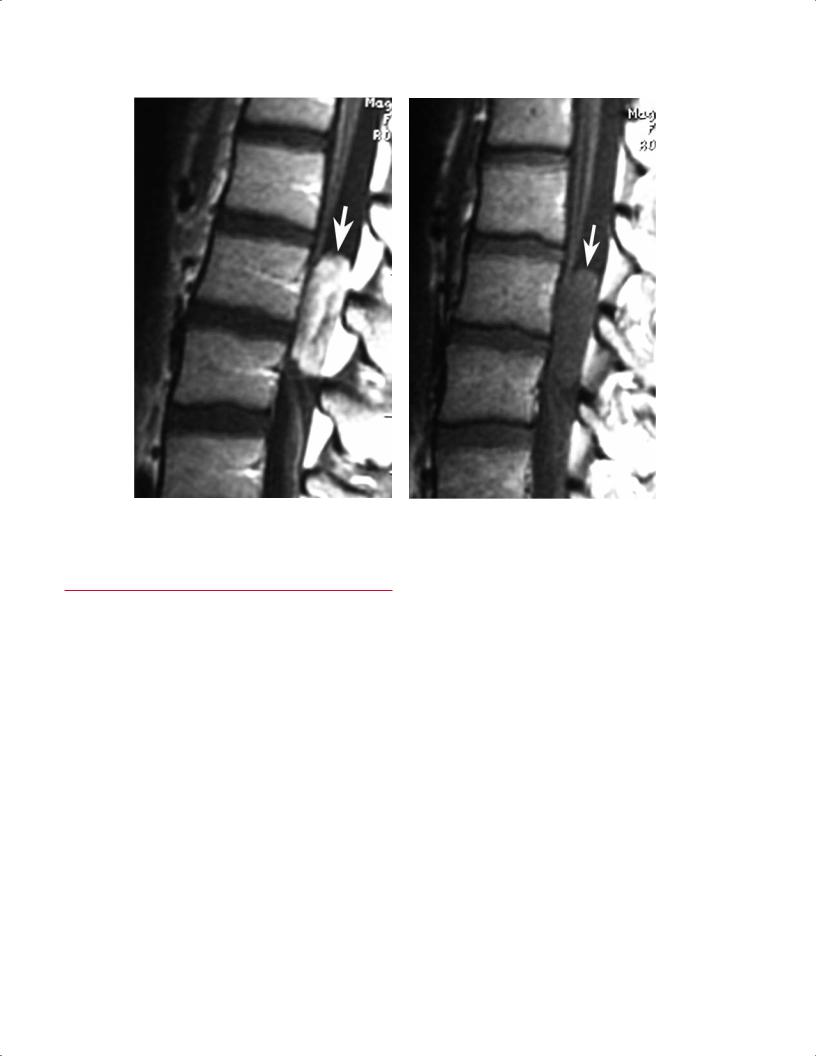
Fig. 3.5 Vertebral compression fracture. (A) A sagittal reconstructed CT image shows vertebral compression fractures at the T6 and T8 levels. (B) A sagittal STIR image shows that the T6 vertebral compression fracture has increased signal compatible with edema within it, which is representative of an acute or subacute fracture. The T8 vertebral compression fracture shows no increase in signal within it, which is compatible with a chronic vertebral compression fracture.
A, B
Postgadolinium T1-Weighted Images
Postgadolinium T1-weighted images and fat-suppressed postgadolinium T1-weighted images are typically obtained for the evaluation of infection, tumor, and postsurgical changes or scar. These images can sometimes be confused with T2-weighted images because they may show areas of increased signal in the presence of pathology (Fig. 3.6); the distinction can be made using the techniques outlined above. Specifically, the clinician should evaluate the areas in which one may expect to find physiologic fluid, such as fluid within a joint or CSF in the spine. If this fluid is bright, then the images are T2-weighted. If this fluid seems to be dark, and the pathology seems to be bright, then the image is likely a postgadolinium T1-weighted image. In addition, the technique of TR evaluation described above can also be used to di erentiate a postgadolinium T1-weighted image (TR is in the 100s range) from a T2-weighted image (TR is in the 1000s range).
Gradient-Echo Images
Gradient-echo images, which appear to be somewhat grayer in their general appearance than other images (including T1-
weighted and T2-weighted images), are especially useful for the evaluation of articular cartilage (Fig. 3.7). In addition, it is important to note that the gradient-echo images are especially susceptible to ferromagnetic materials, such as metallic implants or hemosiderin, and therefore show “signal dropout” in the presence of these substances.
MR Arthrography Images
MR arthrography images are obtained after the joint of interest is injected with gadolinium or normal saline (see Chapter 16) (Fig. 3.8). They may be di cult to di erentiate from T2-weighted images, which also contain bright fluid within the joint. MR arthrography images are often marked by the radiologist or the radiology technician so that it is relatively obvious that gadolinium has been injected into the joint.
MR Angiography Images
MR angiography images highlight the blood vessels and allow for evaluation of the arterial and venous vascular structures (see Chapter 16) (Fig. 3.9). These images are obviously di erent in appearance from the images acquired using the more conventional pulse sequences and MRI techniques.
http://www.boxutech.com
3 A Systematic Approach to the Review of Musculoskeletal MRI Studies |
81 |
A B
Fig. 3.6 Lumbar spine intradural-extramedullary mass. (A) A postgadolinium sagittal T1-weighted image shows a high-signal intensity mass (arrow) just dorsal to the filum terminal. (B) The associated pregadolinium T1-weighted image shows the mass (arrow) to be less
■Step 2: Evaluation of T2-Weighted Images
After the clinician has identified all of the T2-weighted images, they should be systematically evaluated, plane by plane. In almost all instances, the clinician should begin with sagittal T2-weighted images, views especially useful for the spine, knee, elbow, and ankle. In some instances, such as for the hip and shoulder, it may be best to begin with the coronal or coronal oblique images.
If the images are being evaluated as films on a light box, they should be hung in sequential order, starting with all sagittal images, then all coronal images, and then all axial images. The same process should be used when evaluating an imaging study on a computer workstation.
Cervical Spine Example
A description of the evaluation of the cervical spine serves as an illustrative example.
•First, evaluate the sagittal T2-weighted images. Ensure that all of the sagittal T2-weighted images are being
conspicuous. Note that if specific attention is not given to the fact that the CSF is dark, one may mistakenly identify the first image as a T2-weighted image and the second image as the associated T1weighted image.
visualized in order from one side to the other (in this case, from left to right) (Fig. 3.10).
•Next, look for the midline image (Fig. 3.11).
οFor the cervical spine, recognize the midline image by noting that the spinal cord is seen in its entirety (in the patient without scoliosis), extending from the midbrain to the upper thoracic spine.
οVisualize the CSF anterior and posterior to the cervical spinal cord.
οConfirm that the midline image is being evaluated by noting the basion and opisthion at the foramen magnum. In addition, the fourth ventricle is visualized, the vertebral bodies are seen as rectangular or square structures, and the odontoid process is seen in profile with its domed tip.
•After evaluating all of the structures at the midline, continue the review to the left or right side to evaluate for foraminal or lateral recess stenosis.
οEach institution has its own convention as to whether the images for sagittal images are acquired from left to right or right to left.
82 I Initial Concepts
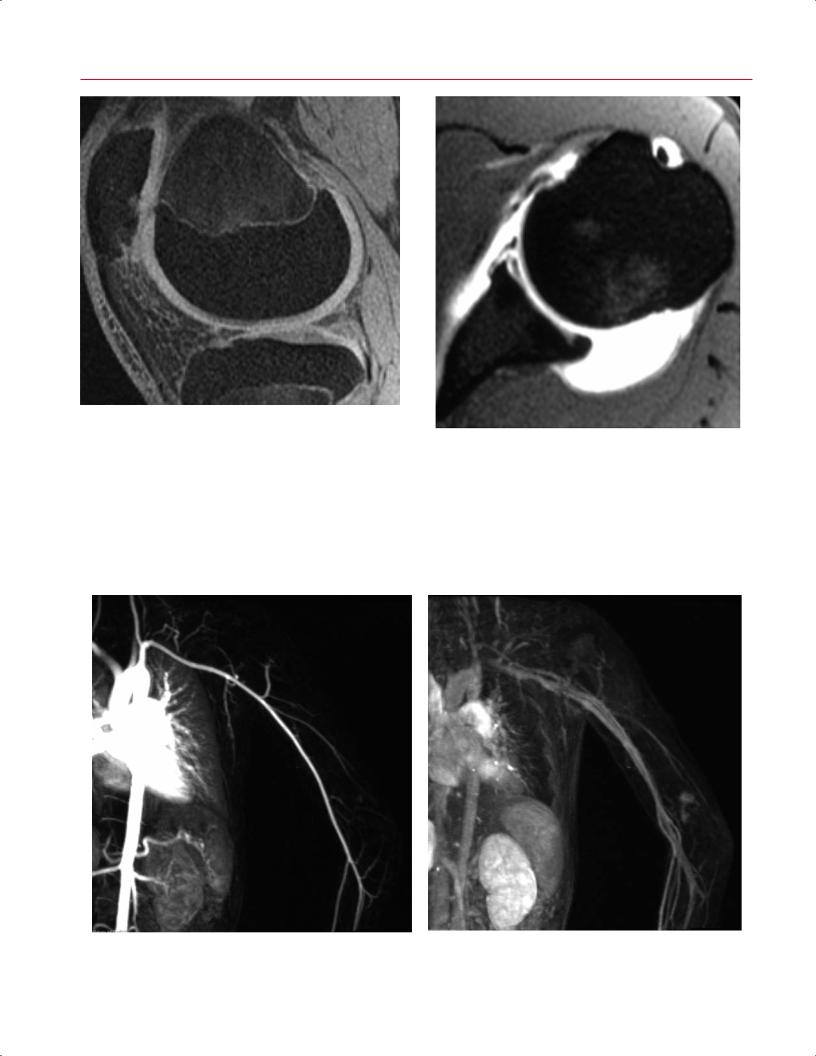
Fig. 3.7 A sagittal 3D fat-suppressed T1-weighted gradient-echo image of the knee shows high contrast between hyperintense articular cartilage and hypointense bone. (From Shindle MK, Foo LF, Kelly BT, Khanna AJ, Domb BG, Farber A, Wanich T, Potter HG: Magnetic resonance imaging of cartilage in the athlete: current techniques and spectrum of disease. J Bone Joint Surg Am 2006;88(suppl 4):27–46. Reprinted by permission.)
Fig. 3.8 An axial postgadolinium MR arthrogram of the left shoulder shows a Bankart lesion.
A B Fig. 3.9 MR arteriogram (A) and venogram (B) of the left shoulder obtained for the evaluation of a vascular malformation.
3 A Systematic Approach to the Review of Musculoskeletal MRI Studies |
83 |
A–C
D, E
οThe only way to be 100% positive about which side of the cervical spine is being visualized is to evaluate the coronal localizing pulse sequence, which often displays numbers that correspond to the numbers seen on the sagittal images. The other way to see whether a specific pathologic finding (for example, a disc herniation) is right
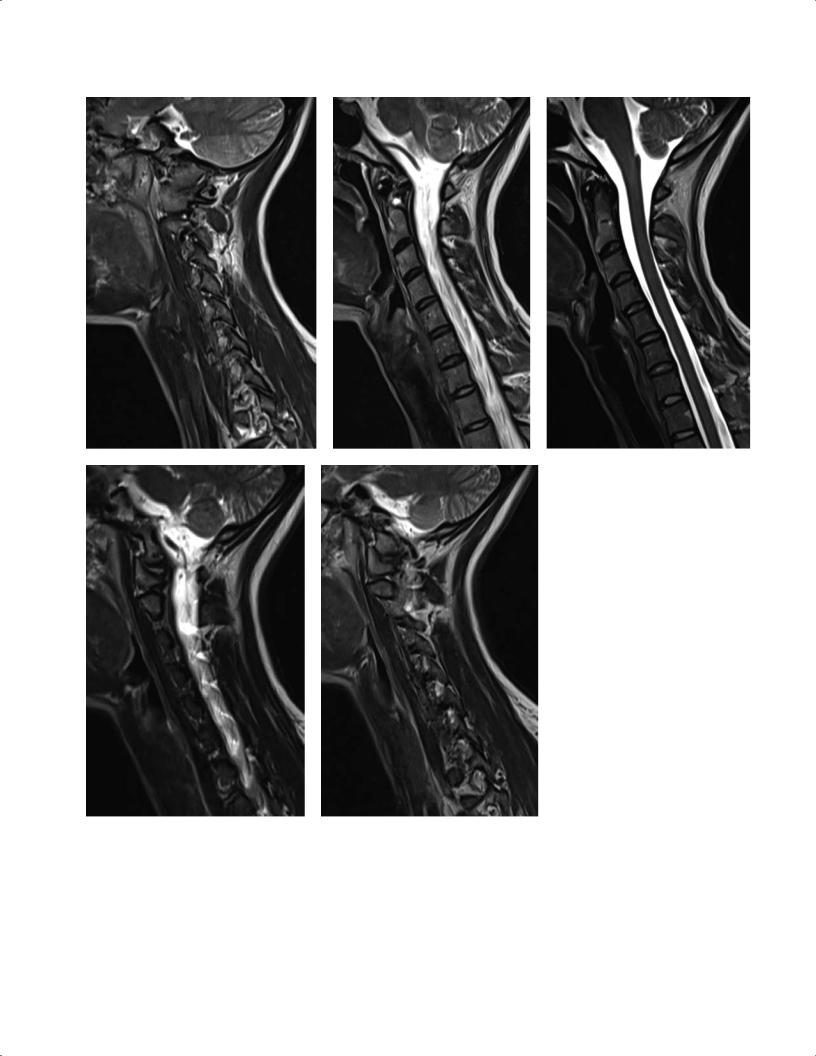
Fig. 3.10 Sequential sagittal imaging of the cervical spine. These T2weighted images should be viewed in order from left (A) to right (E). (C) The midline image should be identified.
or left or paracentral is to correlate the sagittal images with the findings seen on the axial images.
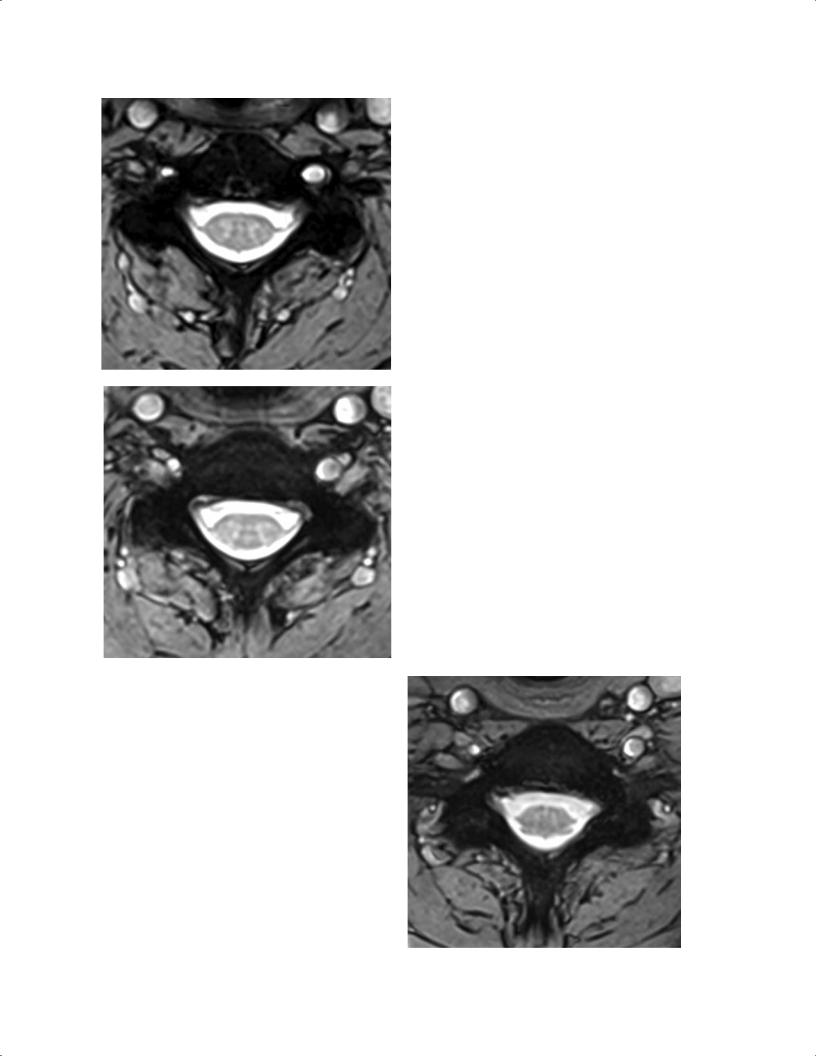
•Next, evaluate all of the axial T2-weighted images from the occipitocervical junction to the lower cervical spine (Fig. 3.12).
84 I Initial Concepts
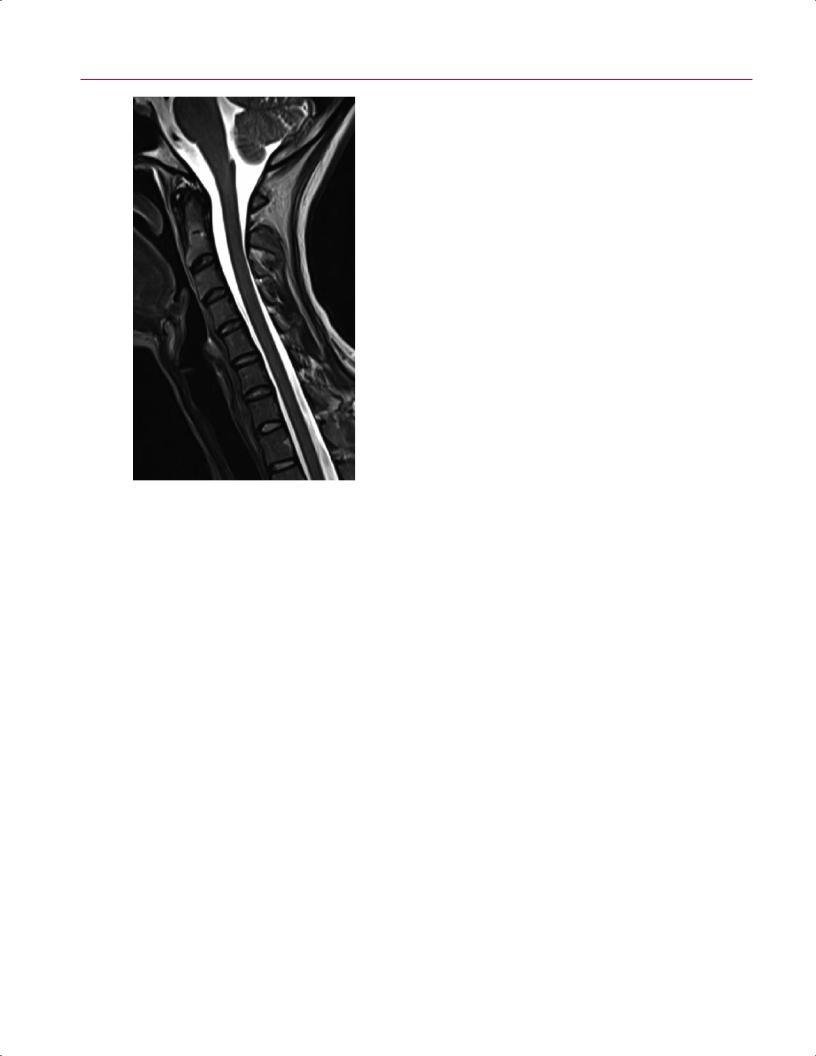
Fig. 3.11 A midline sagittal T2-weighted image of the cervical spine. Note that the spinal cord is seen in its entirety; CSF is seen anterior and posterior to the spinal cord; and the vertebral bodies, odontoid process, and fourth ventricle are seen in profile.
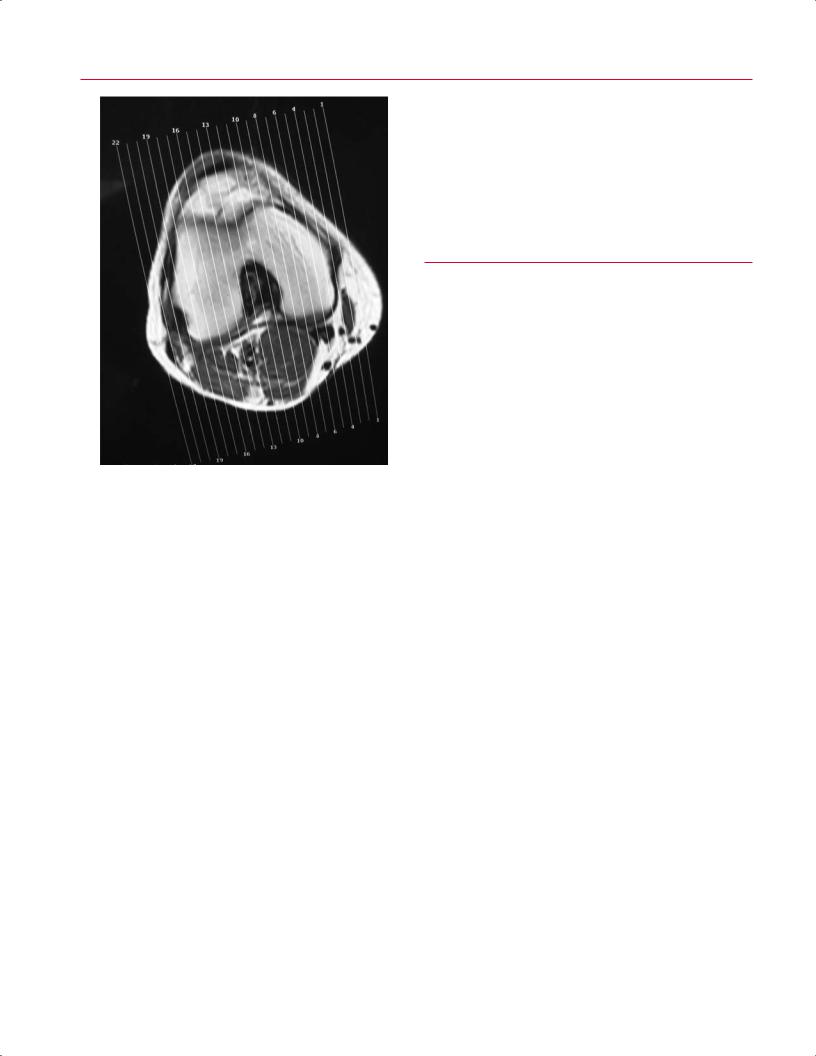
hung (or viewed on a work station) in sequence from the lateral to the medial side or vice versa. Looking for di erences in the lateral-side knee anatomy (such as the presence of the fibular head or the shape of the lateral tibial plateau compared with that of the medial tibial plateau) or correlating the sagittal image numbers with the number seen on the coronal or axial localizing pulse sequence (Fig. 3.13) will ensure that the lateral side is being evaluated. These images are then evaluated from the lateral to the medial side, beginning with the lateral femoral condyle, and then in sequence the ACL or PCL and the medial femoral condyle (see Chapter 2 for additional details regarding knee anatomy) (Fig. 3.14).
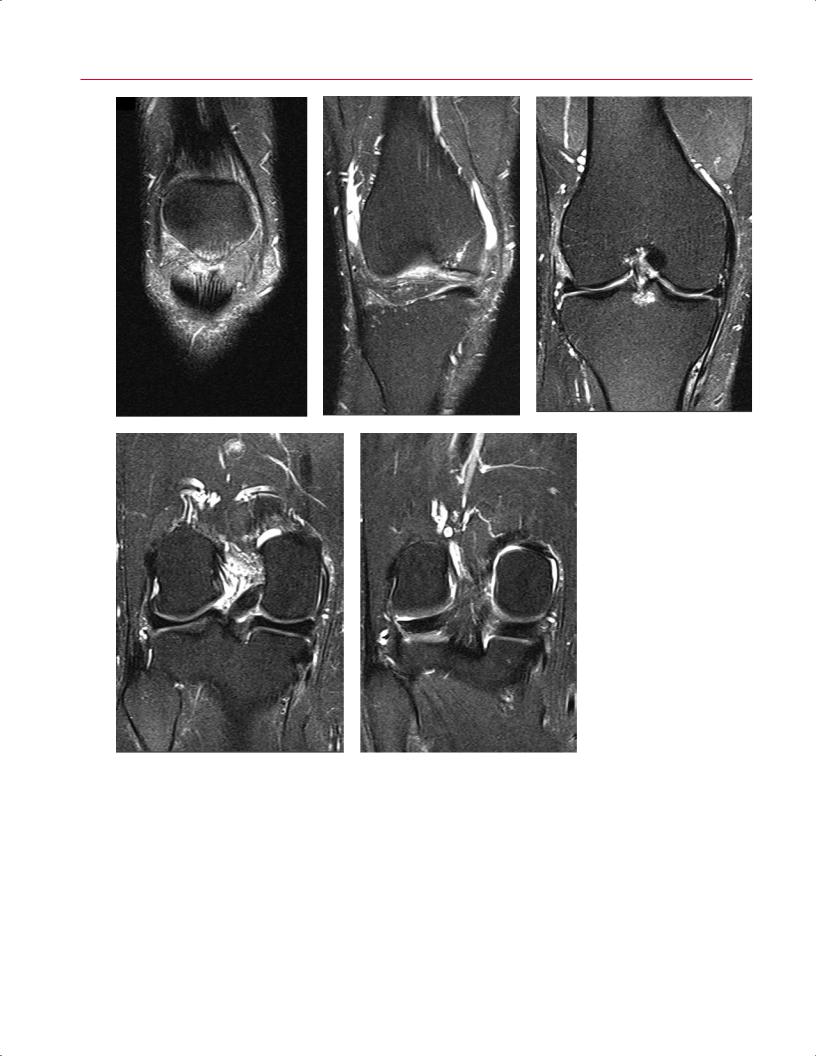
After evaluation of the sagittal T2-weighted images, the next step is to evaluate the coronal T2-weighted images in sequence, from anterior to posterior or vice versa. Using the sagittalor axial-localizing pulse sequence and matching the image numbers will ensure that an image is relatively anterior or relatively posterior. In addition, it is obvious that the anterior images begin with the patella, whereas the posterior images contain the popliteal artery and vein (Fig. 3.15).
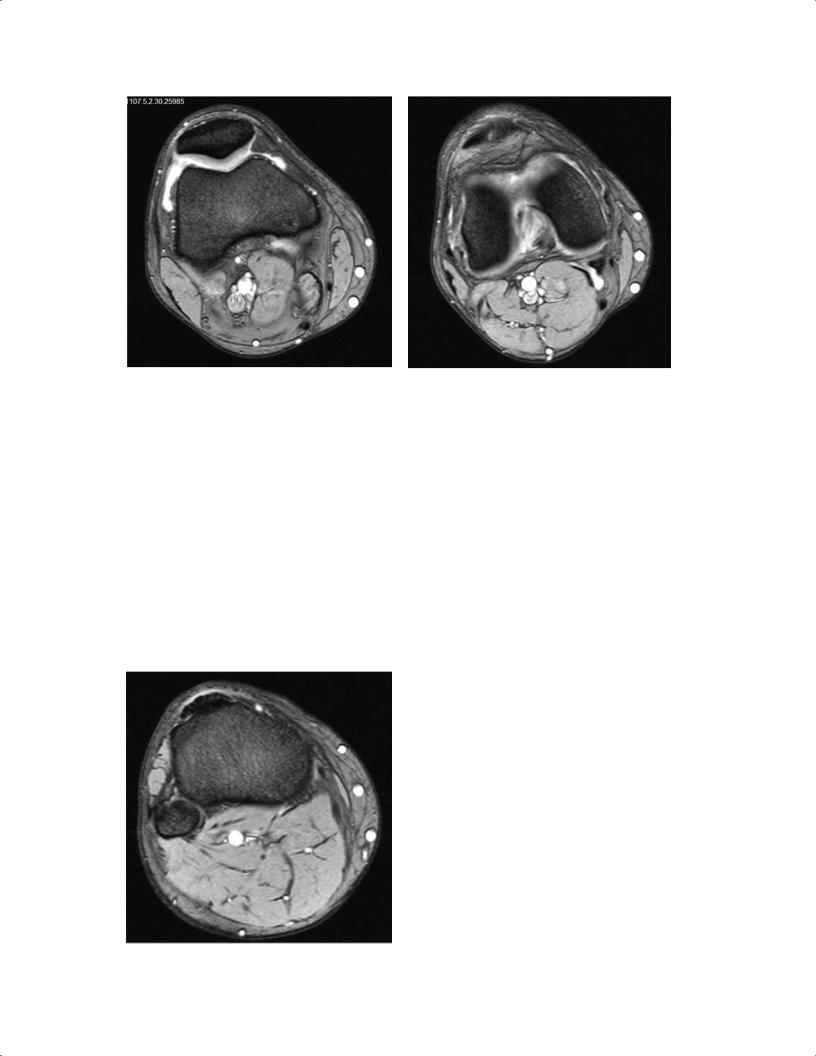
Next, the axial T2-weighted images can be evaluated from proximal to distal or vice versa. The images should be evaluated in sequence; the di erentiation of the direction of film progression can be made based on whether the femur or the tibia/fibula is visualized (Fig. 3.16). However, if there is any uncertainty in the region of the femoral condyles or the tibial plateau, the image number seen on the sagittalor coronal-localizing pulse sequence can be correlated with the image number seen on the axial images to determine the exact location of the axial cut.
οThe only way to ensure that all of the images are seen in sequence and that none is missed is to look at the image numbers on the printed film or on the screen and to confirm that the image number at the beginning of one sheet is the next sequential number after that on the previous sheet.
οConfirm the location at the occipitocervical junction by noting that the odontoid process appears di erent than the remaining cervical vertebral bodies in the subaxial cervical spine.
•Finally, evaluate all of the images in sequence to view the cervical spinal cord and note that there is CSF (bright signal) around it and adequate space available for the nerve roots at the neural foramina; correlating the axial image number with the sagittal localizing image, which contains lines corresponding with numbers that indicate the level of the axial image, will ensure accurate identification of the level being evaluated.
Knee Example
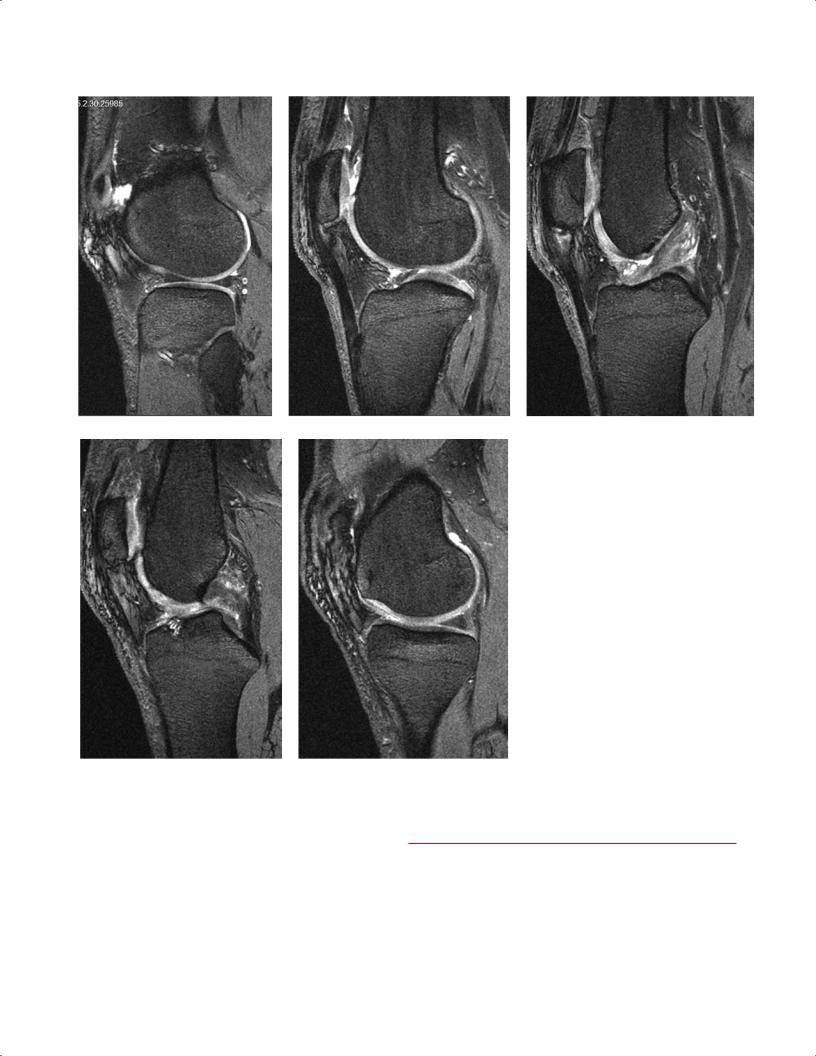
The same technique can be used for evaluating knee MR images. Again, all of the sagittal T2-weighted images are
Pattern Recognition
The next step is to evaluate for any areas of increased T2weighted signal that should not have increased T2-weighted signal. This evaluation may be relatively easy for a clinician with extensive experience in evaluating MRI studies of a particular region. Most clinicians would agree that in determining these areas of increased T2-weighted signal, they tend to use the gestalt method. However, for the less experienced clinician or the clinician in training, several techniques can be used to determine whether or not an area should show increased T2-weighted signal. These techniques rely on the concepts of pattern recognition and experience:
•Recall the evaluations of the last 20 to 50 MRI studies of the region of interest and attempt to remember exactly where the increase in T2-weighted signal was seen.
οIncreased T2-weighted signal outside of that pattern on the current study may represent an area of pathology.
οThis technique of pattern recognition is commonly used by experienced radiologists to read
3 A Systematic Approach to the Review of Musculoskeletal MRI Studies |
85 |
A 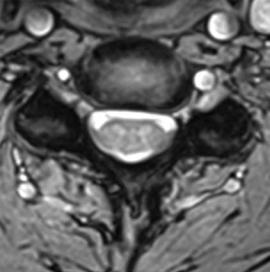 B
B
C 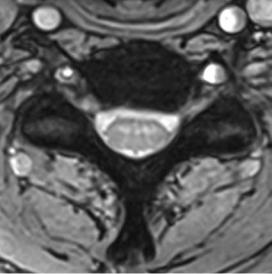 D
D
E 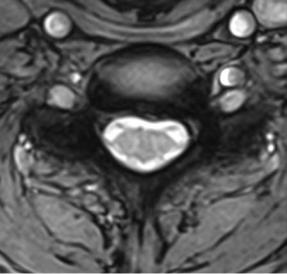 F Fig. 3.12 Sequential axial imaging of the cervical spine. These T2-weighted images should be viewed in order from C6 (A) to T1 (F).
86 I Initial Concepts
Fig. 3.13 Axial localizing pulse sequence of the right knee with numbers of prescribed sagittal images from medial (number 1) to most lateral (number 22).
films. Although clinicians tend to use this technique for in-o ce patient evaluation, it may or may not be a safe and e ective technique.1
•The other method with which one can evaluate for areas of abnormal increased T2-weighted signal is to note all areas of increased T2-weighted signal within a given image and then ask oneself if water does, indeed, “belong” in that area.
οFor example, if the shoulder is being evaluated on a T2-weighted coronal oblique image and a thin sliver of high signal is seen between the humeral head and the glenoid (anatomic structures that are obvious, even to the least-expe- rienced clinician), then one may assume that it represents fluid within the joint (Fig. 3.17). The question, then, is whether it is a normal (physiologic) or an excessive (pathologic) amount of fluid. The ability to make this determination comes from experience or from comparison to a normal contralateral joint.
οIn the same coronal oblique image, if increased T2weighted signal is seen superior and lateral to the humeral head in the expected location of the supraspinatus tendon (Fig. 3.18), the clinician must
ask this question: Does water or edema belong in the tendons? If the answer is no, the clinician may assume that there is edema within the tendon and then may be able to deduce that the signal may represent a partial or complete tear of the supraspinatus tendon. Additional findings such as retraction of the tendon and other morphologic changes may help make this determination.
■Step 3: Evaluation of T1-Weighted Images
T1-weighted images allow for optimal evaluation of anatomic detail. With current improvements in MRI techniques and equipment, including dedicated surface and other coils, T2-weighted images also often show excellent anatomic detail. This improvement may be the reason that the author believes the routine use of T1-weighted images by clinicians and radiologists is declining. Nevertheless, the most appropriate way to evaluate an MRI study fully and most e ectively is to review all of the images and pulse sequences.
Therefore, after identification of the pulse sequences obtained (step 1) and evaluation of the T2-weighted images (step 2), the next step is to review the T1-weighted images for improved evaluation of anatomic detail. This author’s routine is to correlate the areas of increased T2-weighted signal seen during the very detailed and systematic evaluation of the T2-weighted images outlined above with the same region on the T1-weighted images. The improved spatial resolution of the T1-weighted images facilitates the evaluation of regional and local disturbances in anatomic detail. For example, a coronal fat-suppressed T2-weighted image of a nondisplaced femoral neck fracture shows a somewhat indistinct area of increased T2-weighted signal within the femoral neck (Fig. 3.4A). The clinician may decide that it represents a nondisplaced femoral neck fracture but may also consider the possibility of other diagnoses. However, a relatively sharp and crisp fracture line seen within the femoral neck on the coronal T1-weighted image (Fig. 3.4B) would likely leave no doubt in the clinician’s mind that it represents a fracture and not some other process such as a bone bruise, infection, or tumor.
In addition, the T1-weighted images may help the clinician determine the type of tissue that is present in a lesion. Central to this concept is the fact that T1-weighted images tend to show fat as bright signal and fluid as dark signal. Therefore, lesions such as a lipoma (see Chapter 15) are noted to be bright on T1-weighted images, and, in fact, follow the signal of subcutaneous fat on all pulse sequences, including fat-suppressed or STIR pulse sequences. As another example, one of the few lesions that is bright on both T2-weighted and T1-weighted images is a hemangioma, which is often seen
3 A Systematic Approach to the Review of Musculoskeletal MRI Studies |
87 |
A–C
D, E
in the vertebral body (Fig. 3.19). Thus, if the lesion is seen to be bright on both of these images and displays the typical pattern of striations, the diagnosis of vertebral body hemangioma can be made with relative certainty.
As with T2-weighted images, T1-weighted images should be evaluated in all planes and in the same sequence as described in Step 2.
Fig. 3.14 Sequential sagittal imaging of the right knee. These T2-weighted images should be viewed in order from lateral (A) to medial (E).
■Step 4: Evaluation of Specialized Pulse Sequences
Fat-Suppressed T2-Weighted or STIR Images
The fat-suppressed T2-weighted or STIR pulse sequences are used to accentuate the increase in signal and edema seen
88 I Initial Concepts
A–C
|
Fig. 3.15 Sequential coronal im- |
|
aging of the right knee. These |
|
T2-weighted images should be |
|
viewed in order from anterior (A) |
D, E |
to posterior (E). |
in pathologic processes such as fracture, infection, and tu- |
phase nuclear scintigraphy (bone scan) study (see Chapter |
mor. On conventional T2-weighted images, the signal from |
17), which is relatively sensitive to increased bone turnover |
bone marrow fat is maintained, and one attempts to rec- |
but not very specific. Similarly, if a region is evaluated with |
ognize edema by noting the presence or absence of a very |
fat-suppressed T2-weighted imaging or STIR imaging and |
bright region (marrow pathology or edema) within a bright |
there is no area of increased signal, one can be somewhat |
background (fatty marrow) (Fig. 3.20A). On fat-suppressed |
reassured that a pathologic process is not present in that re- |
T2-weighted images, all of the subcutaneous, bone marrow, |
gion. Conversely, if an area of increased signal is noted, it may |
and other fat is suppressed, and one can more easily recog- |
represent pathologic change or a normal region of increased |
nize an area of edema as a bright region within a dark back- |
signal such as physiologic fluid within the joint or CSF. Other |
ground (Fig. 3.20B). This author considers fat-suppressed |
pulse sequences, such as T2-weighted and T1-weighted im- |
T2-weighted and STIR images to be somewhat like a three- |
ages, provide better anatomic detail for evaluation and help |
3 A Systematic Approach to the Review of Musculoskeletal MRI Studies |
89 |
A B
C 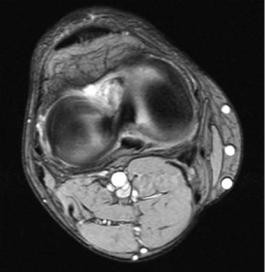
 D
D
|
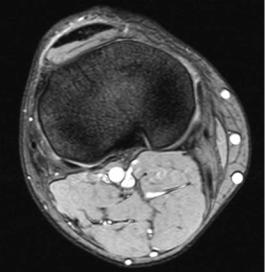
Fig. 3.16 Sequential axial imaging of the right knee. These T2- |
|
weighted images should be viewed in order from proximal (A) to |
E |
distal (E). |