

Книги по МРТ КТ на английском языке / MRI for Orthopaedic Surgeons Khanna ed 2010
.pdf210 III Lower Extremity
Posterior Tibial Tendon Dysfunction
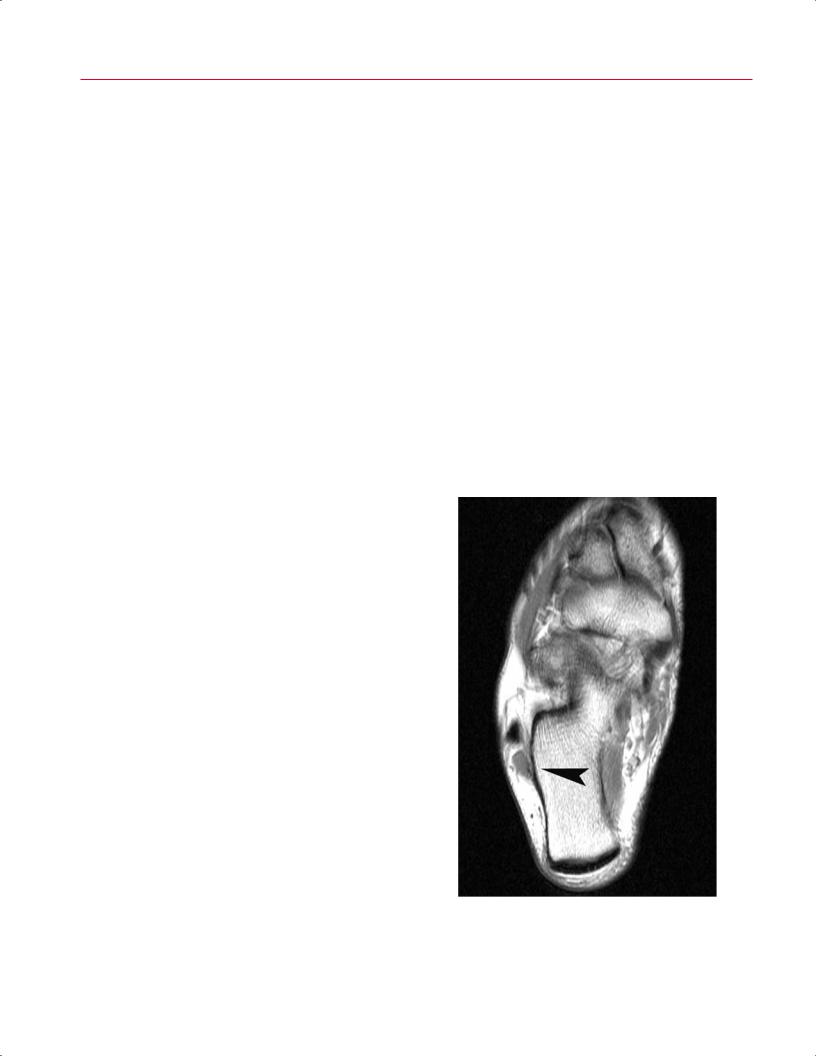
Fig. 9.13 This sagittal T1-weighted image shows tendon hypertrophy and heterogeneity of the substance (arrowhead), the characteristic MRI appearance of Achilles tendinosis.
is believed to be secondary to age-related degeneration and can also occur from repetitive strain or overuse, as is seen in running athletes.36 Achilles tendinosis can occur at the insertion on the posterior calcaneus or more proximally in the noninsertional tendon, approximately 3 to 6 cm above the insertion point.6,35 In Achilles tendinosis, there is a loss of the sharp tendon interface with the surrounding tissues, and the tendon may appear thickened and dysmorphic with loss of the normal concave appearance on axial images.6 Axial and sagittal T1-weighted images show tendon hypertrophy and heterogeneity of the substance (Fig. 9.13), whereas T2-weighted and fat-suppressed T2-weighted images show intratendinous edema and splitting.6 Insertional tendinosis may have an associated intratendinous spur on the calcaneus.
MRI is usually not necessary to diagnose acute rupture of the Achilles, which is often apparent clinically. The tear is typically located several centimeters above the insertion, but it may show complex patterns, including avulsion o the calcaneus or longitudinal splitting. MRI may be helpful for di erentiating partial and complete tears, or chronic ruptures that present in a delayed fashion.6 Sagittal and axial images show a gap between the torn ends with intervening fluid seen on T2-weighted images6 (Fig. 9.14). In chronic cases, fibrous tissue is present between the distal stump and the proximally retracted tendon.
Posterior tibial tendon dysfunction is the most common cause of adult-onset flatfoot deformity.30,37 It results from degenerative tendinosis, inflammatory disease, or, more rarely, trauma. The pathophysiology involves microscopic tears, collagen disorganization, and myxoid degenerative changes within the tendon. Clinically, patients present with flatfoot deformity, medial ankle pain, swelling, and weakness of the tendon.37
Conventional radiographs are useful in determining the severity of the deformity and the presence of secondary arthritis of the hindfoot and ankle. Although not necessary in all cases, MRI is a useful adjunct in assessing the posterior tibialis tendon and is superior to other modalities in detecting inflammation and tears within the tendon.37 Typically, the posterior tibial tendon is two to three times larger than the flexor digitorum longus tendon. It may have a small amount of synovial fluid around it, but usually no more than 1 to 2 mm.31 The tendon should have a homogeneous signal on both T1-weighted and T2-weighted images.31 Posterior tibial tendon tears are typically seen around the medial malleolus, or distally within 2 to 3 cm of its insertion on the navicu- lar.29–31 Posterior tibial tendon tears are best diagnosed on T2-weighted and fat-suppressed axial images, which show morphologic changes and intratendinous signal changes (Fig. 9.15). Sagittal images may be useful for assessing the distal insertion site on the navicular. Additionally, some
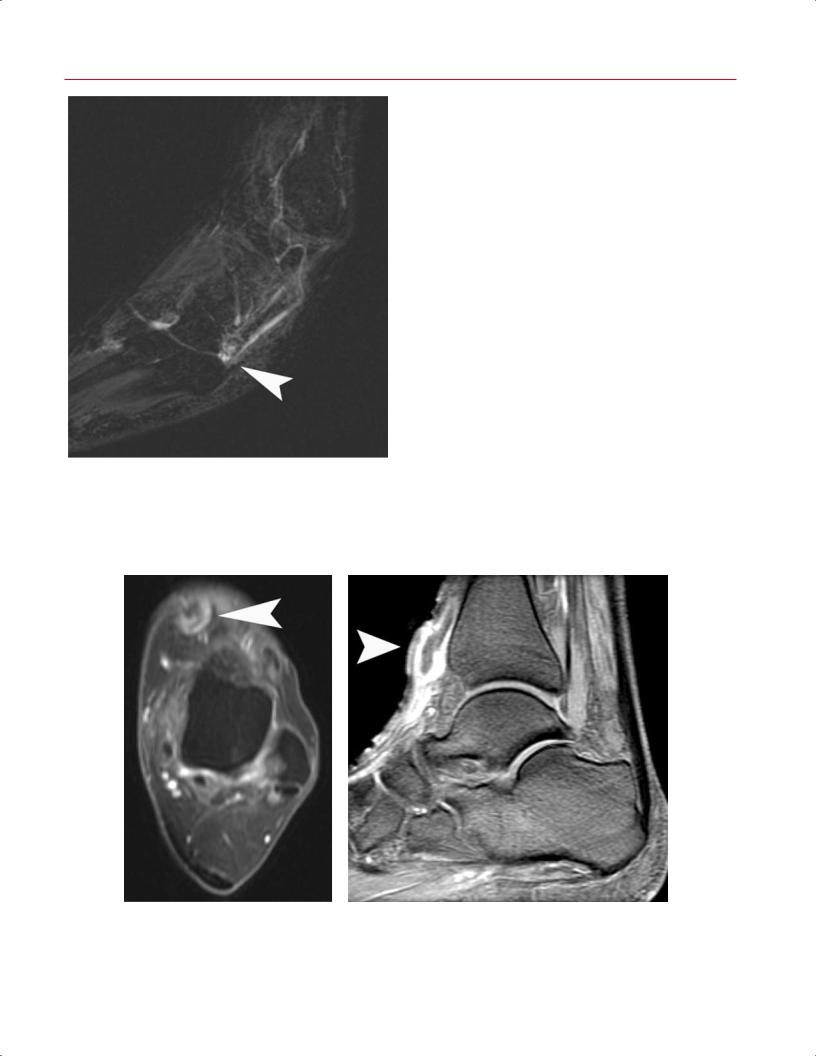
Fig. 9.14 A sagittal fat-suppressed T2-weighted image showing a tear of the Achilles tendon with overlapping ends and fluid and edema at the site of the tear (arrowhead).
9 The Foot and Ankle 211
at the level of the cuboid or fifth metatarsal base. The pathophysiology at each level di ers, but all three areas can be evaluated e ectively with MRI.
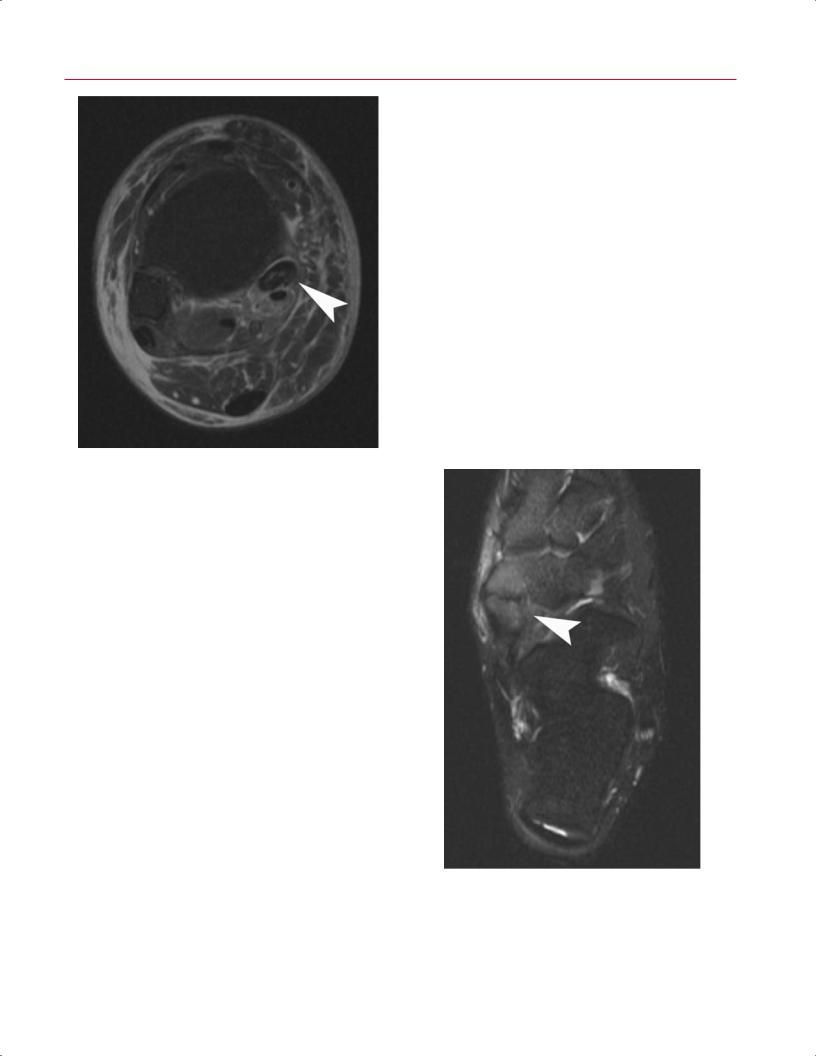
Peroneal tenosynovitis or tear can occur at the retrofibular groove behind the lateral malleolus secondary to acute injury or chronic involvement. Axial MR images are ideal for revealing evidence of tendon sheath e usion and tenosynovitis.32 A small amount of fluid can normally be observed in the peroneal sheaths.6 However, if the amount of fluid is larger than the tendon or if there is complexity to the tendon sheath fluid, the abnormality can be considered tenosynovitis (Fig. 9.18). In progressive cases, tendon thickening can be seen, as can increased signal on T1-weighted or T2-weighted images, consistent with chronic tendinopathy.
Acute peroneal tendon ruptures, although uncommon, can occur as a result of trauma, chronic oral corticosteroid use, or inflammatory arthritis. Axial MR images are most helpful, with irregular tendon appearance noted on T1-weighted images, and fluid within the sheath and surrounding tissues noted on T2-weighted and fat-suppressed T2-weighted im-
Fig. 9.15 An axial fat-suppressed T2-weighted image of the right ankle showing a posterior tibial tendon tear with hypertrophy and prominent intratendinous signal changes (arrowhead).
patients have posterior tibialis tendon dysfunction secondary to an accessory navicular. T2-weighted and fat-sup- pressed images may show bone marrow edema within the accessory bone or the fibrous connection (synchondrosis) to the main navicular body6 (Fig. 9.16).
Posterior tibialis tendon tears can be classified into three types on the basis of their MRI characteristics30:
•Type I tears have longitudinal splits in the tendon resulting in hypertrophy, scar formation, and thickening of the tendon. The posterior tibial tendon can be enlarged up to four to five times the size of the adjacent flexor digitorum longus (Fig. 9.17A).
•Type II tears are more severe, with longitudinal splits that cause the tendon to attenuate to one half to one third of its original thickness (Fig. 9.17B).
•Type III tears represent a complete rupture of the tendon with retraction of the stump and a visible gap (Fig. 9.17C).
Peroneal Tendon Disorders
Peroneal tendon disorders include tenosynovitis, tears, and subluxation. Pathology of the peroneal tendons can develop posterior to the lateral malleolus, on the lateral side of calcaneus inferior to the tip of the lateral malleolus, and distally
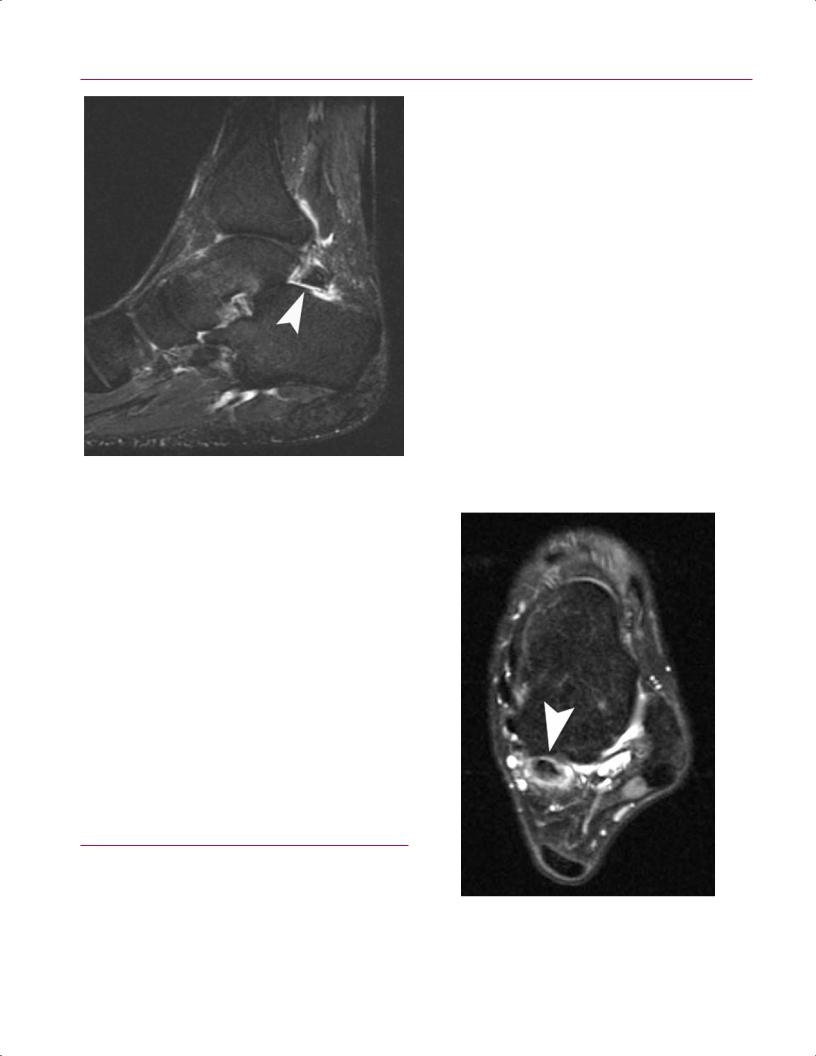
Fig. 9.16 An axial fat-suppressed T2-weighted image of the left foot shows marrow edema within an accessory navicular bone, superficial soft tissues, and the fibrous connection (synchondrosis) to the main navicular body (arrowhead). An accessory navicular bone is an occasional cause for posterior tibialis tendon dysfunction.
212 III Lower Extremity
A 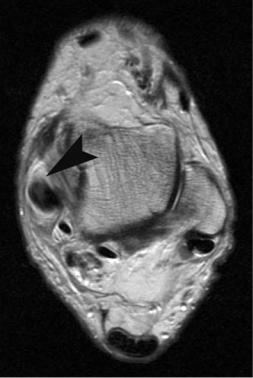 B
B
Fig. 9.17 Posterior tibial tendon tears (left foot). (A) Type I tears, |
|
as seen on this axial T2-weighted image, have longitudinal splits |
|
in the tendon resulting in hypertrophy, scar formation, and thick- |
|
ening of the tendon (arrowhead). The posterior tibial tendon can |
|
be enlarged to four to five times the size of the adjacent flexor |
|
digitorum longus. (B) Type II tears, as seen on this parasagittal |
|
STIR image, are more severe, with longitudinal splits that cause |
|
the tendon to attenuate to one half to one third of its original |
|
thickness (arrowhead). (C) Type III tears, as seen on this parasagit- |
|
tal STIR image, represent a complete rupture of the tendon with |
|
retraction of the stump and a visible gap (arrowhead). |
C |
ages. Chronic peroneal tendon tears are more common than |
for a peroneus brevis longitudinal tear is compression of the |
acute rupture. Chronic longitudinal split tears of the pero- |
peroneus brevis by the peroneus longus against the poste- |
neus brevis can occur from chronic abrasion of the tendon |
rior surface of the fibula, with central tendon attenuation |
against the posterolateral ridge of the fibula secondary to |
and damage. Axial MR images reveal an irregular shape of |
instability of the tendons.38 Another proposed mechanism |
the peroneus brevis tendon, such as a chevron or bilobed |
9 The Foot and Ankle 213
Fig. 9.18 In tenosynovitis of the peroneal longus tendon, the crosssectional area of the peritendinous fluid collection must be larger than the tendon itself (as seen on this axial STIR image of the left foot) (arrowhead) or complex.
appearance (Fig. 9.19); other suggestive findings include fluid within the sheath, a flat retrofibular groove, and spurring of the lateral edge of the fibula.32,39–41
Chronic peroneal tendon subluxation or instability has been reported with attenuation of the superior peroneal retinaculum and a shallow retrofibular groove. Both of these features can be well visualized on axial T1-weighted images39–41 (Fig. 9.20). The tendons may even be noted to be grossly dislocated on the lateral side of the lateral mal- leolus.39–41 Crowding of the retrofibular groove secondary to mass e ect, leading to peroneal instability, is another proposed mechanism. Such crowding can occur secondary to a low-lying peroneus brevis muscle belly, a ganglion cyst arising from the posterolateral ankle, or an accessory peroneus quartus muscle. A peroneus quartus muscle is present in 10% to 20% of individuals and occurs more commonly in men than in women.39,42 It is found posterior to the peroneus brevis and longus and inserts onto the calcaneus, cuboid, or peroneal tendons themselves.42 It is visualized on axial T1weighted images as a tendon separate from the brevis and longus tendons (Fig. 9.21).
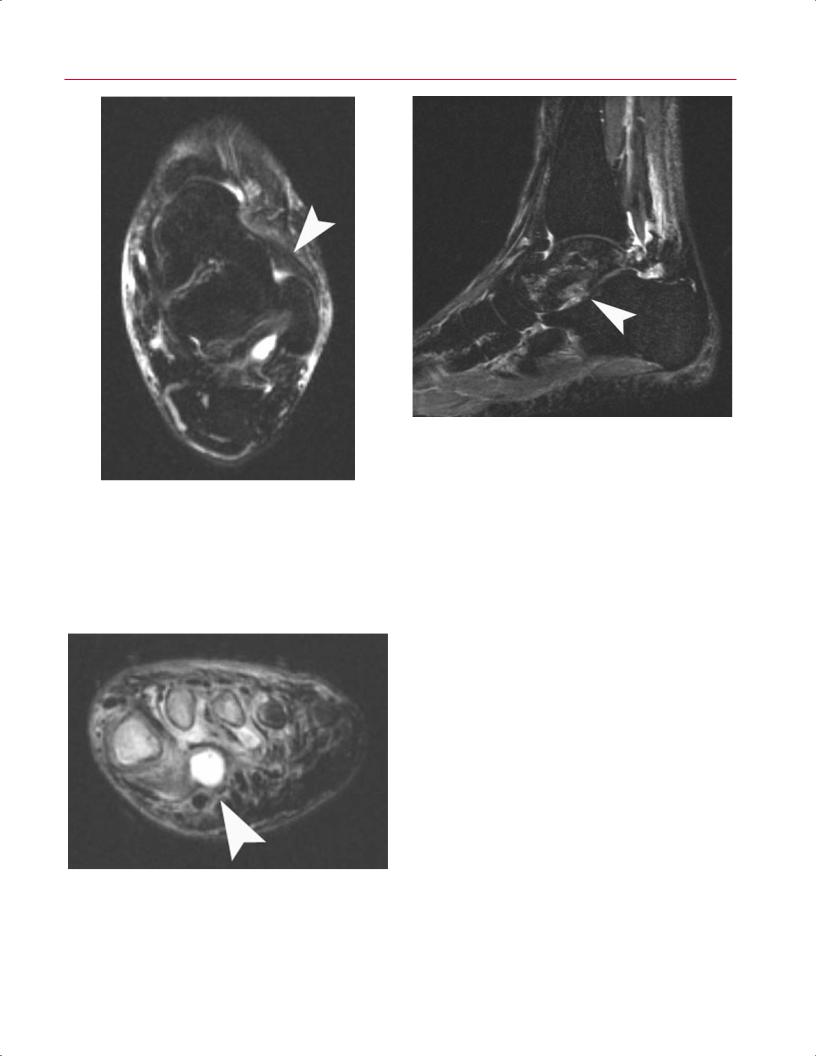
Fig. 9.19 An axial T1-weighted image of the left foot showing a “split” peroneus brevis tendon with an irregular, bilobed shape (arrowhead).
Fig. 9.20 An axial T1-weighted image of the left ankle showing the peroneal tendon laterally subluxed over the lateral aspect of the retrofibular groove (arrowhead).
214 III Lower Extremity
Distal peroneal pathology is less common; tenosynovitis or tear can occur inferior to the tip of the lateral malleolus or at the insertion sites of either tendon. Impingement of the peroneals can occur between the tip of the fibula and the peroneal tubercle on the lateral side of the calcaneus secondary to valgus hindfoot alignment or malunion of a previous calcaneal fracture. Distally, tenosynovitis can occur at the base of the fifth metatarsal at the insertion of the brevis tendon. Distal peroneus longus pathology can present as painful os peroneum syndrome (POPS).43 Patients with this entity present with pain and tenderness in the region of the cuboid inferolaterally secondary to tenosynovitis or tearing of the longus tendon. With complete rupture of the peroneus longus tendon, the associated os peroneum may retract proximal to the calcaneocuboid joint. Radiographically, a retracted or fragmented os peroneum may be seen. On MRI, there is fluid and edema in the sheath of the peroneus longus at the level of the cuboid, with edema and fragmentation of the os peroneum (Fig. 9.22).
Anterior Tibial Tendon Disorders
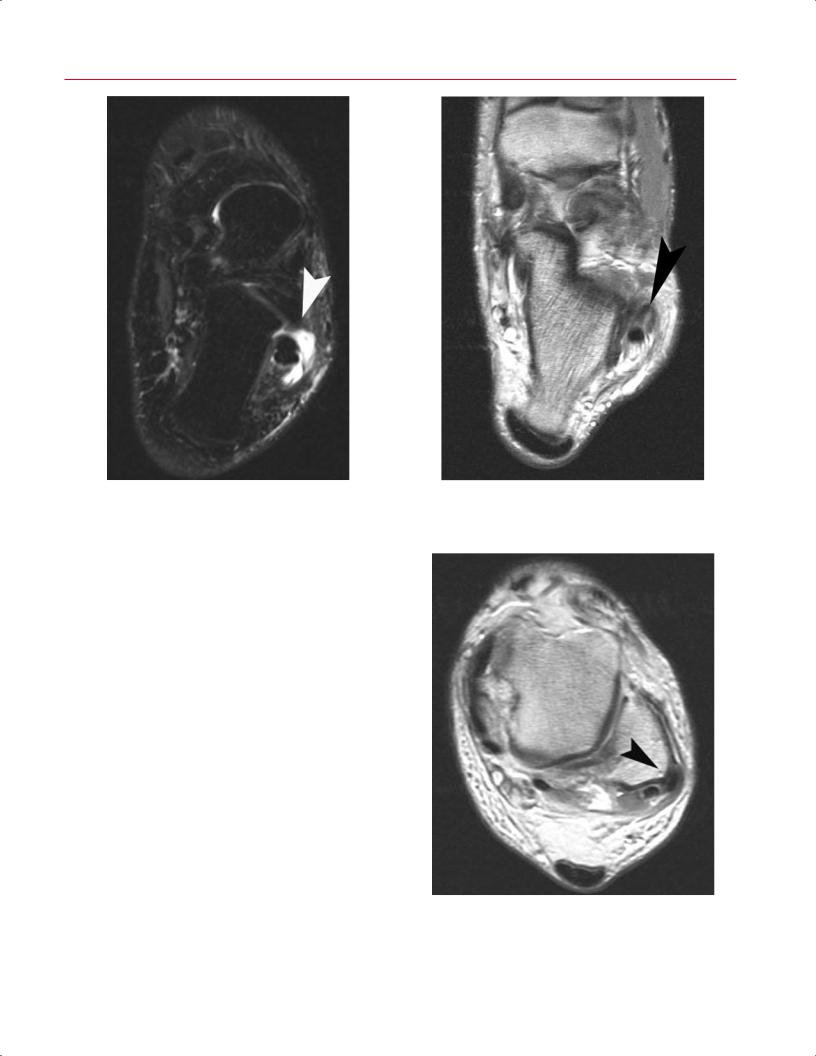
Disorders of the anterior tibialis tendon are relatively less common than those of the tendons listed above. Tendinitis can occur secondary to systemic inflammatory disease or overuse syndromes. Acute anterior tibialis tendon rupture can occur from trauma or laceration, and chronic attritional tear can present in elderly patients. Patients present with anterior ankle pain, localized soft-tissue swelling, and diminished dorsiflexion strength.33 Tendinitis appears as softtissue edema on axial and sagittal T2-weighted images33,44 (Fig. 9.23). As with tendinosis in other tendons, anterior tibial tendinosis appears on T1-weighted and T2-weighted images as hypertrophy, heterogeneous signal changes within the tendon substance, and even partial longitudinal splitting33,44 In complete rupture, sagittal T1-weighted images show discontinuity of the tendon, with proximal retraction and intervening fluid on T2-weighted images.33,44
Signal abnormality sometimes is seen on T1-weighted images distally at the insertion site because of the magic angle e ect. This phenomenon can occur when the foot is imaged in a neutral position.44 In addition, a longitudinal split of the tendon is occasionally seen at its insertion.
FHL and Posterior Impingement (Os Trigonum)
Tenosynovitis of the FHL tendon typically occurs at the posterior ankle at the level of the FHL tendon sheath posterior to the talus. Usually, patients present with deep ankle posteromedial pain, particularly with the ankle in plantarflexion. This condition is commonly seen in kicking athletes or ballet dancers performing in the en-pointe position.45 Clinically, tenosynovitis can overlap with posterior ankle impingement syndrome because of a prominent posterior process or
os trigonum. The os trigonum becomes impacted between the posterior tibia and calcaneus with ankle plantarflexion, which can cause osseous edema and localized inflammation; this impaction and inflammation can also lead to secondary FHL tenosynovitis and, potentially, a partial longitudinal tear. Passive plantarflexion on physical examination elicits posterior pain; passive dorsiflexion of the hallux stretches the FHL and may cause posterior ankle pain, also suggestive of FHL tendon pathology.
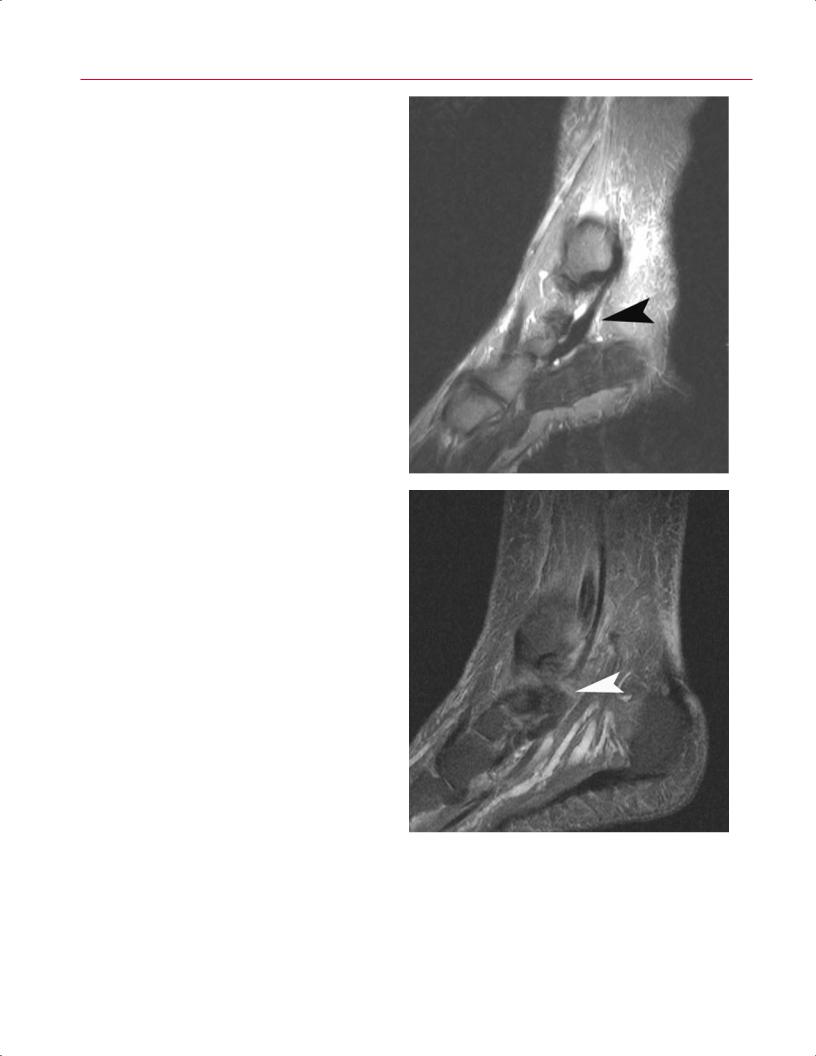
Conventional radiographs may show a large posterior talar process or an os trigonum. MRI shows fluid and softtissue signal intensity posteriorly around the region of the os trigonum, extending into the posterior portions of the ankle and the subtalar joints.6 The fibrous synchondrosis between the os trigonum and talus may show increased signal intensity on T2-weighted axial and sagittal images because of fluid traversing the articulation and forming a pseudarthrosis6 (Fig. 9.24). Edema also can be seen in the ossicle, posterior tibia, and dorsal calcaneus secondary to impaction. The FHL sheath appears enlarged and fluid-filled, and it may
Fig. 9.21 An axial T1-weighted image of the right foot showing an accessory peroneus quartus muscle posterior to the peroneus longus and brevis muscles (arrowhead).
9 The Foot and Ankle 215
Fig. 9.22 A sagittal T2-weighted image showing an edematous os peroneum with fluid and edema of the sheath of the distal peroneus longus tendon (arrowhead).
show loculation or a ganglion cyst; on rare occasions, the tendon may show intratendinous signal change consistent with a partial tear6 (Fig. 9.25).
Anterolateral Impingement
Impingement of the anterolateral aspect of the ankle joint is seen after a lateral ankle sprain in which hypertrophic scar tissue proliferates in the lateral gutter. This proliferation is sometimes called a meniscoid lesion because of its appearance as a meniscus-shaped focus of fibrous and synovial tissue that can lead to pain with dorsiflexion or eversion of the ankle.6,46 On physical examination, the patient exhibits tenderness at the anterolateral corner of the ankle that can be exacerbated by passive dorsiflexion. MRI findings in anterolateral impingement include the presence of inflamed soft tissue or increased fluid against the inner margin of the anteroinferior tibiofibular ligament and the anterior talofibular ligament instead of a small fat pad that sits anterior to the fibula on axial imaging6,46 (Fig. 9.26). MR arthrography with gadolinium contrast may help to outline this synovial tissue more accurately and confirm the diagnosis.46
Osteonecrosis of the Talus
Osteonecrosis (also termed avascular necrosis) of the talus typically occurs after talus fracture secondary to disruption
A B
Fig. 9.23 Anterior tibialis tendon pathology. (A) An axial fat-sup- pressed T2-weighted image of the left ankle showing anterior tibial tendinitis with soft-tissue edema (arrowhead). (B) A sagittal fat-sup-
pressed T2-weighted image showing a complete rupture of the anterior tibialis tendon with discontinuity of the tendon, proximal retraction, and intervening fluid (arrowhead).
216 III Lower Extremity
Fig. 9.24 A sagittal fat-suppressed T2-weighted image shows fluid signal within the fibrous synchondrosis between the os trigonum and talus (arrowhead), representing formation of a pseudarthrosis.
of the osseous blood supply.47 Atraumatic osteonecrosis can also occur in various medical conditions (such as vasculitis, sickle cell disease, or excessive alcohol use) or secondary to oral corticosteroid use.47 Patients complain of severe pain and di culty with ambulation. Conventional radiographs may show sclerosis, cystic changes, or bone collapse, although they are believed to have low sensitivity. MRI is a very sensitive test for making the diagnosis of osteonecrosis of the talus and has the added advantage of better anatomic resolution than bone scintigraphy.48 On T1-weighted images, low signal is seen with osteonecrosis secondary to marrow fat replacement, whereas T2-weighted images typically show edema in the avascular lesion (Fig. 9.27). Because there is a risk of osteonecrosis after talar neck fractures, titanium screws are recommended for surgical fixation to minimize the metallic artifact on postoperative MRI studies.47
reveals swelling, erythema, induration, tenderness, and warmth. Many infections in the foot and ankle result from a direct spread from contiguous ulceration, which occurs often in diabetic patients; penetrating trauma is another common cause.
Cellulitis and Abscess
An MRI study is often obtained in the setting of cellulitis to rule out deep-space abscess or associated osteomyelitis. Cellulitis typically shows low signal intensity in the subcutaneous fat on T1-weighted images and increased signal intensity on T2-weighted images. Fat-suppressed T2-weighted images are particularly sensitive in detecting subcutaneous edema; the underlying osseous structures appear normal. An abscess appears as a well-defined fluid collection that is low signal on T1-weighted and higher signal on T2-weighted and fat-suppressed images49 (Fig. 9.28). Administration of gadolinium contrast results in enhancement of the abscess rim.49 Cellulitis or abscess in the foot is best imaged on coronal and sagittal images; cellulitis at the ankle level is better visualized with sagittal and axial images. In cases of cellulitis or abscess secondary to penetrating trauma, a retained foreign
■ Infectious Processes
Infections in the foot and ankle are typically seen in the pediatric population, in patients with diabetes, and in immunocompromised individuals. Patients with infections present with pain, erythema, and swelling and can have fevers and other systemic responses. Physical examination
Fig. 9.25 An axial fat-suppressed T2-weighted image of the left ankle showing an enlarged and fluid-filled FHL with intratendinous signal change consistent with a partial tear (arrowhead).
9 The Foot and Ankle 217
Fig. 9.26 An axial fat-suppressed T2-weighted image of the left ankle showing a nidus of inflammatory soft tissue adjacent to the inner margin of the anteroinferior tibiofibular ligament (arrowhead), suggestive of anterolateral impingement.
Fig. 9.27 A sagittal fat-suppressed T2-weighted image showing osteonecrosis of the talus with patchy areas of bone marrow edema (arrowhead), some of which contain devitalized bone.
body may be di cult to identify but can present as a signal void in the midst of the edema pattern or fluid collection.
Fig. 9.28 A coronal fat-suppressed T2-weighted image of the left foot showing a well-defined fluid collection within the plantar forefoot (arrowhead), representing an abscess. Note that there is inflammation and edema of the surrounding tissues and probable osteomyelitis involving the first, second, and third metatarsals.
Septic Arthritis
Septic arthritis can occur secondary to direct penetration of a foreign body into the joint or secondary to hematogenous spread from a noncontiguous source. Occasionally, when the diagnosis is unclear, MRI may be helpful in identifying a joint e usion and may exclude a deep abscess or associated bone changes indicative of osteomyelitis. On MRI, septic arthritis shows a joint e usion with distention of the synovial recesses and intense contrast enhancement.50 Aspiration of the involved joint confirms the diagnosis and provides fluid for microscopic examination, culture, and sensitivity examination to help guide antibiotic management. The treatment involves drainage of the involved joint with repeated aspiration or open surgical drainage.
Osteomyelitis
Osteomyelitis, or bone infection, can be acute or chronic. In the foot and ankle, osteomyelitis is usually seen in the presence of a contiguous ulcer as in the diabetic or neuropathic patient. Radiographs in the early stages of osteomyelitis often are normal, and changes (including osteolysis, periosteal reaction, and osseous destruction) may not be seen until
218 III Lower Extremity
|
several weeks later. MRI has become an extremely useful tool |
tive trauma on insensate joints (leading to degeneration and |
|
|
in the diagnosis of osteomyelitis, with a reported sensitivity |
fractures), combined with autonomic dysfunction (leading |
|
|
and specificity of more than 90%.49 Low-intensity bone mar- |
to altered local osseous circulation and osteopenia). Osseous |
|
|
row signal is seen on T1-weighted images and high signal is |
fragmentation and destruction lead to progressive foot de- |
|
|
seen on T2-weighted images, particularly if fat suppression |
formity and ulceration with increased risk of infection. The |
|
|
is used49 (Fig. 9.29). In addition, periosteal reaction will be |
midfoot is most commonly involved, but Charcot arthropa- |
|
|
seen as circumferential high signal on T2-weighted images |
thy can also a ect the hindfoot or ankle. Careful history and |
|
|
with disproportionate enhancement on postgadolinium T1- |
physical examination are supplemented by conventional ra- |
|
|
weighted images. Cortical disruption also is seen in more |
diographs to confirm the diagnosis, determine the extent of |
|
|
advanced cases and may be associated with surrounding |
involvement and deformity, and monitor the progression of |
|
|
soft-tissue abscess or fluid collection.49 These changes are |
the disease. |
|
|
usually seen adjacent to the associated ulcer, which can be |
The clinical scenario becomes more complicated in the |
|
|
labeled with a skin marker at the time of scanning to assist |
setting of concomitant Charcot arthropathy and contiguous |
|
|
with interpretation. |
ulceration from deformity and osseous pressure. Distinguish- |
|
|
The MRI changes seen in osteomyelitis are somewhat |
ing osteomyelitis from underlying Charcot arthropathy can |
|
|
nonspecific, however, and can be confused with neuroar- |
be di cult because both show osseous edema, soft-tissue |
|
|
thropathic fractures, which also can occur in patients with |
inflammation, and bone destruction. Distinguishing osteo- |
|
|
neuropathy, diabetes, and ulceration. |
myelitis from neuroarthropathy via imaging has been di - |
|
|
|
|
cult. Osteomyelitis typically occurs secondary to contiguous |
|
|
|
spread from an adjacent ulcer. Osseous changes seen on |
|
|
|
MRI that are not adjacent to an ulcer have a lower likeli- |
|
|
|
hood of signifying infection and instead suggest neuropathic |
|
■ Other Pathologic Conditions |
||
|
arthropathy. In settings with neuroarthropathic changes, |
||
|
Charcot Neuroarthropathy |
contiguous ulceration, and clinical findings of infection, a po- |
|
|
tentially useful MRI finding is the “ghost” sign.49 Bones that |
||
|
|
|
|
|
Charcot neuroarthropathy is most commonly seen in pa- |
appear to be “dissolved” on T1-weighted images but appear |
|
|
tients with diabetes or those with other forms of peripheral |
more morphologically normal on T2-weighted or contrast- |
|
|
neuropathy; the reported rate of Charcot arthropathy in |
enhanced imaging with di usely abnormal marrow signal |
|
|
individuals with diabetes is 0.1% to 0.4%.51,52 Charcot neu- |
often contain infection, and these findings are more specific |
|
|
roarthropathy is hypothesized to occur secondary to repeti- |
for osteomyelitis.49 |
|
A |
B |
||
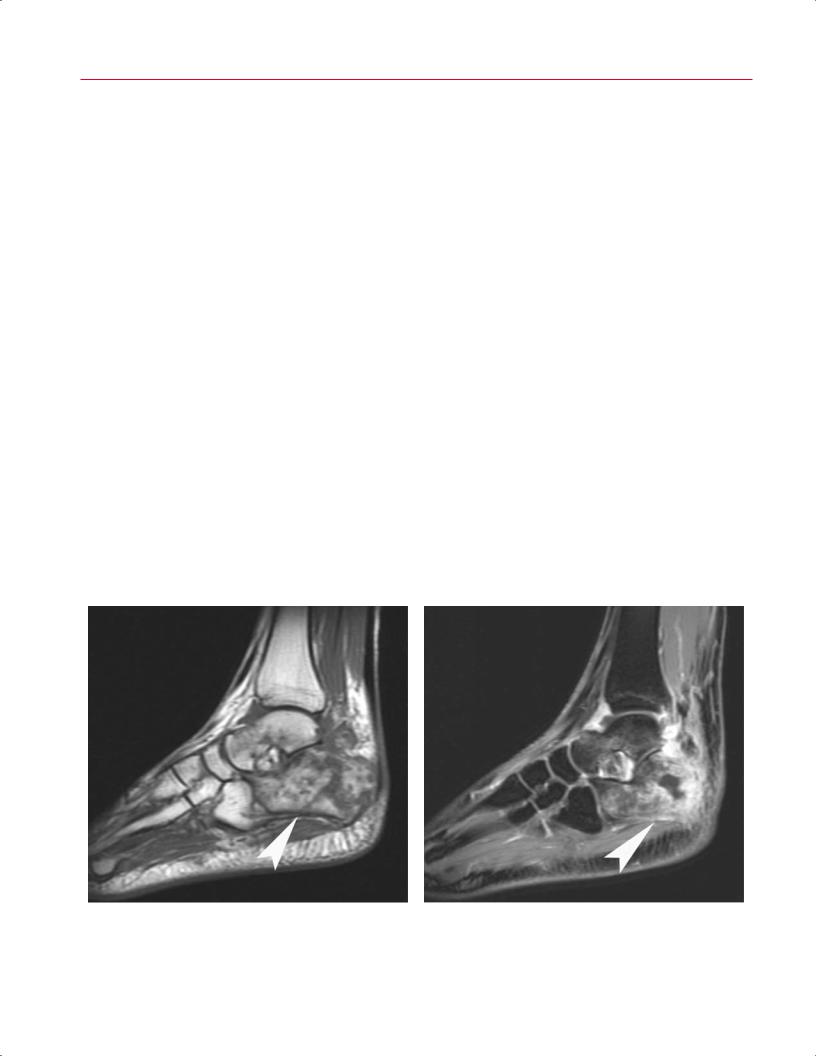
Fig. 9.29 Osteomyelitis. (A) A sagittal T1-weighted image showing di use foci of low signal throughout the calcaneus and talus (arrowhead). (B) A sagittal fat-suppressed T2-weighted image of the same
patient showing di use foci of high signal in the same distribution (arrowhead). There is devitalization of a portion of the calcaneus.
|
9 The Foot and Ankle 219 |
||
|
|
|
|
Tumors |
mation, but it can be locally infiltrative and may have a high |
||
MRI is a crucial component in the diagnosis and character- |
recurrence rate after surgical excision. Plantar fibromatosis |
||
is best seen on coronal and sagittal MR images of the foot; |
|||
ization of tumors of the foot and ankle (see Chapter 15, for a |
|||
the lesion typically has low to intermediate signal intensity |
|||
more detailed review of MRI for this disease process). MRI is |
|||
on T1-weighted and T2-weighted images and is directly con- |
|||
extremely helpful in determining the size and morphology |
|||
tiguous to the plantar fascia, with minimal soft-tissue edema |
|||
of benign and malignant lesions of bone and soft tissues. As |
|||
or signal alternation in the deep musculature (Fig. 9.31). |
|||
in other areas of the body, certain lesions have character- |
Hemangiomas have a tendency to involve the muscular |
||
istic appearances on MRI that can aid in the diagnosis and |
|||
components of the lower extremities, often with a multi- |
|||
can suggest appropriate treatment. The following discussion |
|||
compartmental distribution. In the region of the foot and |
|||
focuses on the most common lesions seen in the foot and |
|||
ankle, hemangiomas tend to involve the plantar aspect. |
|||
ankle. |
|||
They produce pain, focal swelling, and paresthesia. On MRI, |
|||
A ganglion cyst is a benign lesion that occurs next to a |
|||
they show increased signal intensity on T2-weighted and fat- |
|||
joint capsule or tendon sheath. Weakening or degeneration |
|||
suppressed T2-weighted images, with intermediate signal |
|||
of the capsule or tendon sheath secondary to underlying ar- |
|||
on T1-weighted images. With gadolinium enhancement, |
|||
thritis or inflammation results in an outpouching of retained |
|||
hemangiomas show a marked increase in signal intensity.53 |
|||
fluid and mucoid degeneration. Such ganglion cysts, which |
PVNS and giant cell tumor of the tendon sheath are char- |
||
can be simple or multilocular, are frequently seen about the |
|||
acterized by inflammatory proliferation of the synovium |
|||
ankle, in the sinus tarsi area, and on the dorsal midfoot. The |
|||
associated with deposits of hemosiderin. PVNS often oc- |
|||
cyst shows high signal intensity consistent with fluid on T2- |
|||
curs in individuals 20 to 50 years old and can manifest as |
|||
weighted images53 (Fig. 9.30A). On T1-weighted images, the |
|||
a focal mass or as a generalized lesion involving the entire |
|||
cyst exhibits intermediate signal intensity (Fig. 9.30B). Cysts |
|||
joint space. It can develop in any joint of the foot but is most |
|||
may also show rim enhancement after intravenous gado- |
|||
frequently found in the ankle.53 The characteristic appear- |
|||
linium contrast. |
ance on MRI is inhomogeneous signal intensity within the |
||
Plantar fibromatosis is a benign nodular proliferation of |
|||
synovial proliferation. The lesion has low signal intensity on |
|||
fibroblasts arising from the plantar fascia.54 The nodule typi- |
|||
T1-weighted and T2-weighted images and may show dif- |
|||
cally arises from the superficial (plantar) side of the fascia |
|||
fusely inhomogeneous enhancement with gadolinium con- |
|||
and may infiltrate the subcutaneous tissues and skin of the |
|||
trast53 (Fig. 9.32). Although histologically similar to PVNS, |
|||
plantar foot in a manner similar to that of a Dupuytren con- |
giant cell tumor of the tendon sheath originates in a tendon |
||
tracture of the hand. It does not undergo malignant transfor- |
|||
sheath rather than a joint. In the foot, giant cell tumor of the |
|||
|
|||
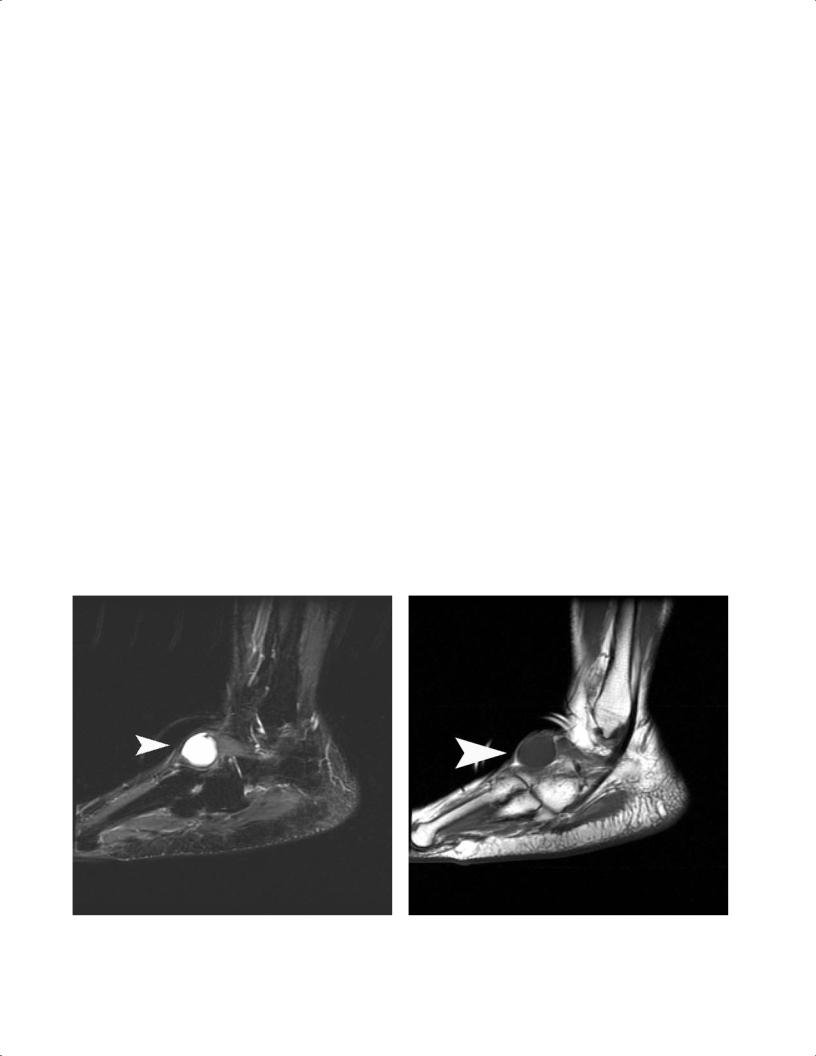
A B
Fig. 9.30 Ganglion cysts. These lesions have high signal intensity (arrowhead) on T2-weighted images (A) and intermediate signal intensity (arrowhead) on T1-weighted images (B), consistent with fluid.