

Книги по МРТ КТ на английском языке / MRI for Orthopaedic Surgeons Khanna ed 2010
.pdfCord
|
Motor root of C1 |
|
C1 |
Dorsal root of C2 |
Vertebral a. |
|
Ventral ramus of C2 |
|
Posterior ramus of C2 |
|
C2 lateral mass |
|
C3 |
Dorsal root of C2
Fig. 2.69 A posterior 3D illustration of the upper cervical spine showing the location of the vertebral artery relative to the posterior arch of C1 and the exit of the C2 nerve root above the pedicle of C2.
Transverse lig.
Anterior arch of atlas (C1)
Odontoid process (dens)
Epiglottis
Hyoid
Cerebellum |
Posterior |
|
|
|
arch of |
|
atlas (C1) |
Rectus
 capitis m.
Oblique  capitis m.
 Lamina
(C2)
Spinal cord
Ligamentum nuchae
Glottis |
Trapezius |
|
m. |
Thyroid 
cartilage Splenius capitis m.
Cricoid
cartilage C7 spinous process
|
|
|
T1 spinous process |
|
|
A |
Tracheal rings |
T1 vertebral body |
B |
||
|
|||||
|
|
|
Fig. 2.70 A sagittal T1-weighted midline image (A) and artist’s sketch (B) of the cervical spine depicting the cervical cord, CSF, and the anterior and posterior longitudinal ligaments, as well as the anterior and posterior elements of the cervical spine and the intervertebral discs.
toward more accessible knowledge
Available for academic purposes
2 Normal MRI Anatomy of the Musculoskeletal System 71
Axial Images
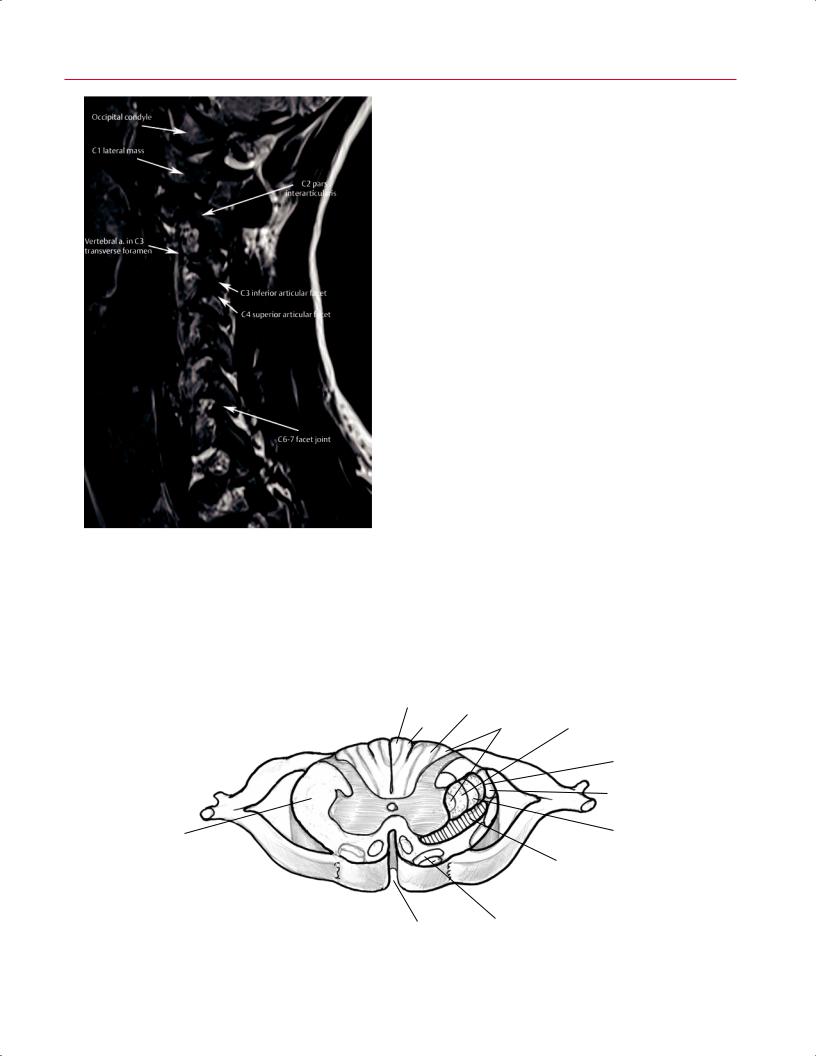
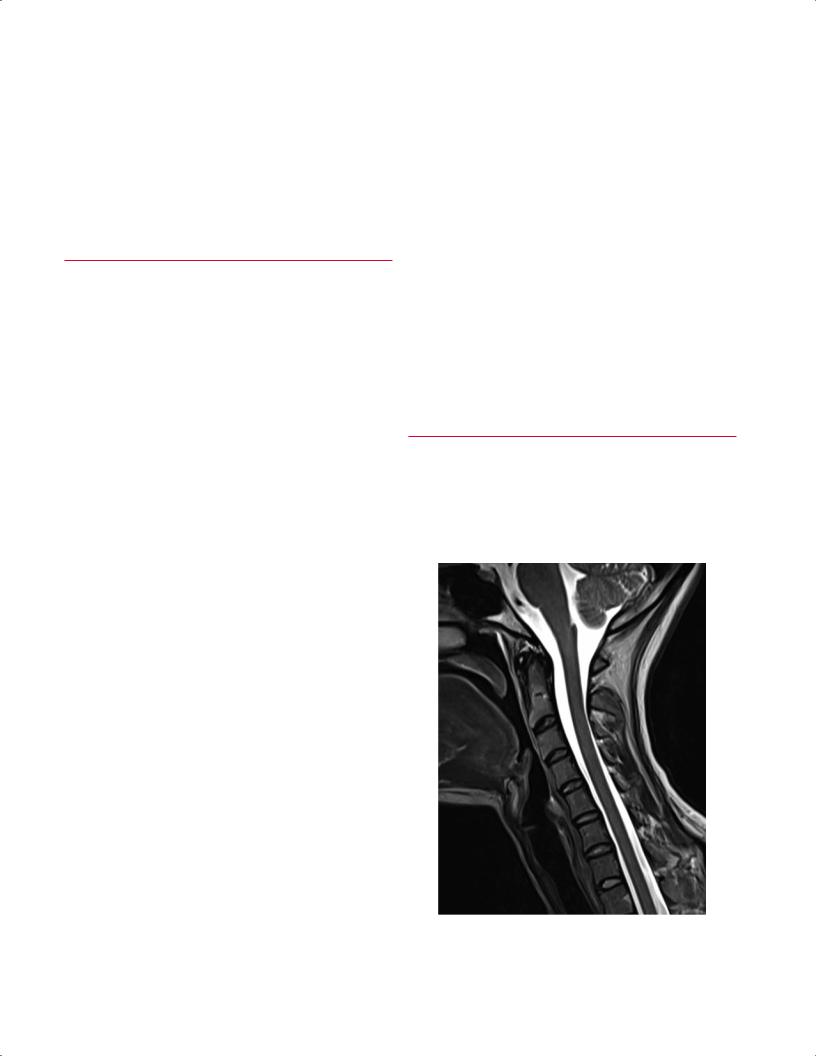
Fig. 2.71 A sagittal T2-weighted paramidline image of the cervical spine showing the vertebral artery in long axis coursing through the transverse foramina of the cervical spine. The facet joints are most easily evaluated in the parasagittal plane, as shown here.
Evaluation of the cervical spine on axial MRI initially requires the correct identification of the spinal level, which can be accomplished by using the localizing sagittal images or by evaluating signal intensity di erences between the intervertebral discs and vertebral bodies and sequentially numbering the levels caudal to the odontoid process. Given the potential risk of wrong-level surgery, special care should be taken to identify the level by using a combination of these two labeling techniques (see Chapter 3). In addition, most imaging workstations have a tool that allows the vertebral bodies to be identified using the numbering techniques outlined above, which facilitates rapid localization on the midsagittal images while evaluating the associated axial images.
Cervical spine anatomy and anatomic pathology are well visualized on axial T1-weighted images; T2-weighted images have good CSF-to-cord contrast (Fig. 2.64), which allows evaluation of spinal cord or nerve root compression.15,17,18 Knowledge of the location of the various spinal tracts can allow a clinician to correlate the clinical and radiographic findings in a patient with known or suspected spinal cord injury (Fig. 2.72). Compared with sagittal images, axial T2-weighted images can provide a higher resolution depiction of the cord (because of the smaller field of view), enabling a more sensitive assessment of its signal intensity. Sagittal images are also helpful in evaluating signal abnormalities in the spinal cord because one image can show a long segment of the spinal cord. Neural foramina are best depicted with gradient-echo and T2-weighted images and should be evaluated on axial and parasagittal images. Evaluation of the neural foramina in the axial and sagittal planes takes experience and training, especially with patients who have scoliosis or poor positioning
Sacral
Posterior column |
Thoracic |
|
|||||
Lumbar |
|
||||||
|
|
|
|
|
|
Thoracic |
|
|
|
|
|
|
|
Cervical |
|
|
|
|
|
|
|
|
Lateral corticospinal tract |
|
|
|
|
|
|
|
|
|
|
|
|
|
|
|
|
|
|
|
|
|
|
|
Sacral |
Lateral column |
|
Lumbar |
|||||
|
|
||||||
|
|
|
|
|
|
|
Lateral spinothalamic tract |
|
|
|
|
|
|
|
|
|
|
|
|
|
|
|
|
Anterior |
|
column |
Olivospinal tract |
||||
|
|||||||
|
|
|
|
|
|
||
|
|
|
|
|
|
Anterior fissure |
|
Fig. 2.72 An axial 3D illustration of cervical spinal cord anatomy with location of various spinal tracts.
http://www.boxutech.com
Available for academic purposes
72 I Initial Concepts
toward more accessible knowledge
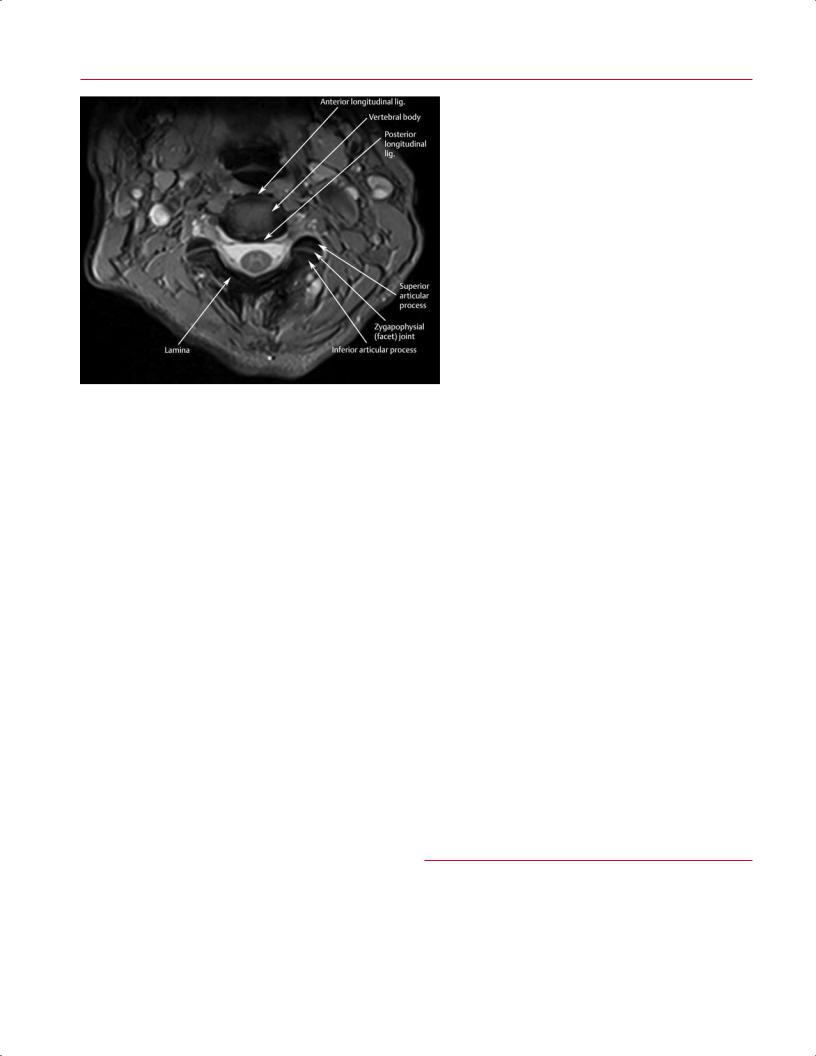
in the scanner, which can cause each neural foramen to be visualized on individual parasagittal images. Care should be taken to evaluate the axial T2-weighted images and to recognize the normal shape and size of the central canal and the neural foramina. Specifically, the degree of contribution of the three primary contributors to cervical spinal stenosis (disc pathology, facet arthropathy, and ligamentum flavum hypertrophy) should be noted, and their combined contribution to the degree of central and foraminal stenosis should be assessed. The anterior border of the neural foramen is the disc, and the posterior border is the facet joint (Fig. 2.73). It is important to note the location and course of the vertebral arteries on the axial images. Aberrant vertebral arteries should be identified preoperatively, especially if a cervical corpectomy is being considered. Furthermore, the vertebral arteries should show normal hypointense pulsation signal. Incidentally imaged structures should also be evaluated. For instance, lymph nodes in the neck should be evaluated for size and the presence of a normal fatty hilum. The thyroid should also be evaluated for size and to exclude large nodules.
Fig. 2.73 An axial T2-weighted image of the cervical spine showing the anterior and posterior longitudinal ligaments and the superior and inferior articular processes of the facet joints.
Coronal Images
Coronal images show the craniocervical spine articulations, intervertebral discs, uncinate processes, atlantooccipital joints, and lateral atlantoaxial joints.15 Although the sagittal and axial images provide enough information for diagnosis in most cases, coronal images may be especially valuable for evaluating the craniocervical junction or assessing for spinal tumors. Coronal plane MR images, along with conventional radiographs, also facilitate evaluation of the rarely occurring cervical scoliosis because the entire scoliotic spine can be included within a single imaging plane.
■ Thoracic Spine
MRI of the thoracic spine is obtained relatively less frequently than that of the lumbar and cervical spine. The anatomic structures in the thoracic spine are unique in that the ribs form two additional articulations with the vertebrae:
http://www.boxutech.com
Available for academic purposes
2 Normal MRI Anatomy of the Musculoskeletal System 73
toward more accessible knowledge
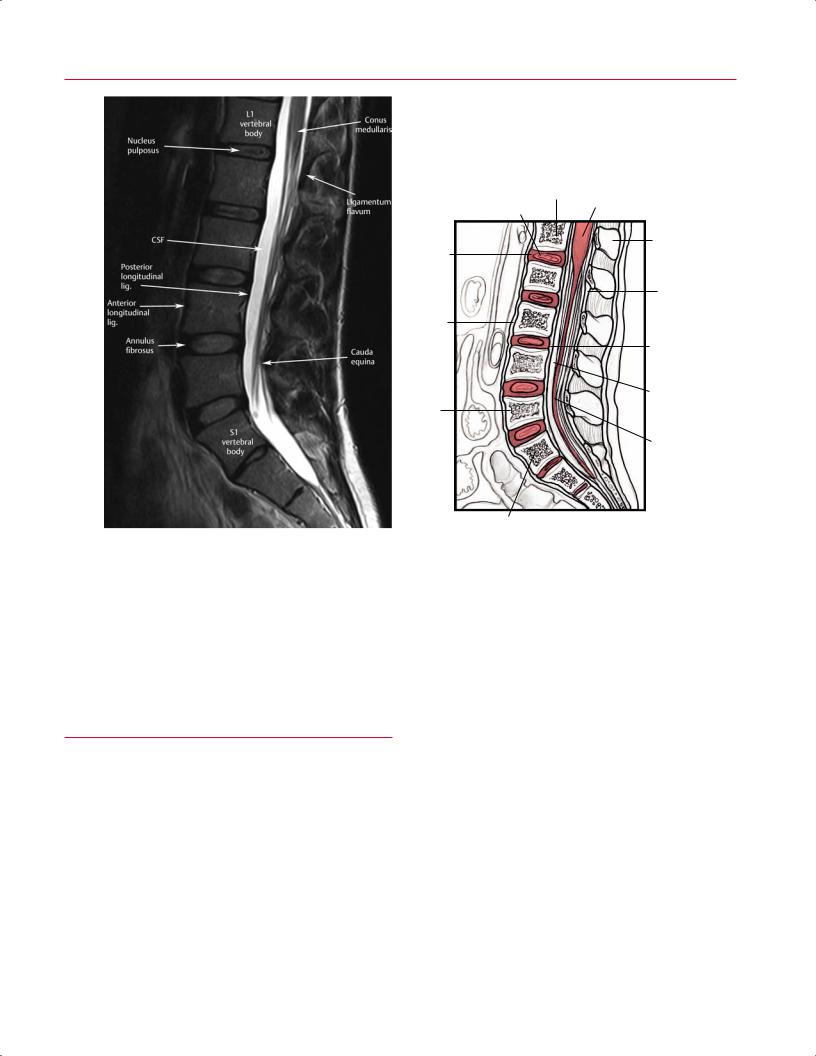
L1
Conus medullaris
Nucleus pulposus
Spinous Annulus process fibrosus
Ligamentum flavum
Anterior longitu-
dinal lig.
Posterior longitudinal lig.
CSF
L5
Cauda equina
A |
S1 |
B |
Fig. 2.74 A sagittal T2-weighted midline image (A) and artist’s sketch (B) of the lumbar spine showing the conus medullaris. The posterior longitudinal ligament, intervertebral discs, and vertebral
the costocentral joint (between the vertebral body and the rib head) and the costotransverse joint (between the transverse process and proximal rib). The thoracic intervertebral discs are fairly uniform and monotonous. The facet joints are coronally oriented.
■ Lumbar Spine
Sagittal Images
Sagittal imaging of the lumbar spine is usually obtained with T1-weighted and T2-weighted pulse sequences (Figs. 2.74 and 2.75). The T1-weighted images are best used for evaluating the anatomic detail of the lumbar spine. The midsagittal image should be evaluated first. This image shows the full profile of the sacrum and most of the lumbar vertebral bodies, spinal cord, and cauda equina in patients without substantial scoliosis. After evaluating the midsagittal image, the sagittal images are sequentially evaluated toward each side to assess the facet joints and neural foramina.
bodies are better di erentiated on the T2-weighted images than on T1-weighted images (see Fig. 2.70).
The sagittal images can be concurrently evaluated with the axial sequence to confirm laterality. The bright signal from CSF on T2-weighted images provides a myelographic e ect. T1-weighted gradient-echo images assist by providing improved evaluation of end plate and osteophyte anatomy and di erentiation of the anterior and posterior longitudinal ligaments from the cortical bone.
Axial Images
When evaluating axial MR images, it is important to accurately identify the level at which the pathology exists, which can be achieved by using the localizing sagittal image. In addition, each level can be identified by starting at the sacrum and numbering each vertebral body from L5 to L1. In complex cases where severe pathology is present at multiple levels, it may also be helpful to use the spine labeling tool (see Cervical Spine, above). On axial images, the di erence in signal intensity between the intervertebral discs and vertebral bodies allows for the distinction between vertebral levels.
http://www.boxutech.com
Available for academic purposes
74 I Initial Concepts
toward more accessible knowledge
|
|
Anterior |
|
|
|
|
|
|
longitudinal lig. |
L1 |
L1-L2 intervertebral |
||
|
|
|
|
|||
|
|
|
|
foramen |
||
|
|
|
|
|
||
L1-L2 disc |
|
|
|
|
|
|
L2 |
|
|
|
|
|
|
L3 |
|
|
|
|
|
|
L4 |
|
|
|
|
Pedicle |
|
|
|
|
|
(L3) |
||
vertebral |
|
|
|
|
||
|
|
|
|
|
||
body |
|
|
|
|
|
|
|
|
|
|
|
Spinous |
|
L4 exiting |
|
|
|
process |
||
|
|
|
(L3) |
|||
spinal |
|
|
|
|
||
|
|
|
|
|
|
|
n. root |
|
|
|
|
Lamina |
|
|
|
|
|
|
|
|
|
|
|
|
|
|
(L3) |
L5 vertebral |
|
|
|
|
|
|
body |
|
|
|
|
|
|
A |
S1 |
B |
|
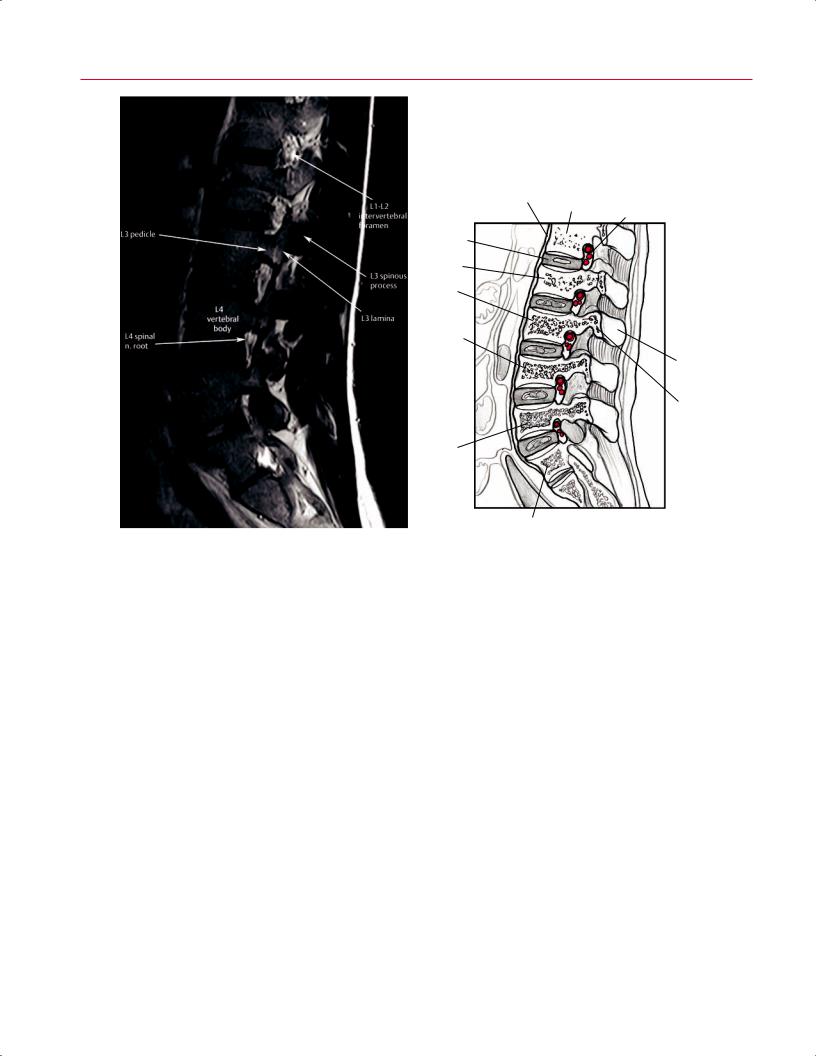
Fig. 2.75 A parasagittal T2-weighted image (A) and artist’s sketch (B) roots at multiple levels.
Evaluation of the axial images requires more experience and training than does the evaluation of the sagittal images. Care should be taken to evaluate the axial T2-weighted images and recognize the normal shape and size of the central canal and the neural foramina (Fig. 2.76). Specifically, the degree of contribution of the three primary contributors to spinal stenosis (disc pathology, facet arthropathy, and ligamentum flavum hypertrophy) should be noted, and their combined contribution to the degree of central and foraminal stenosis should be carefully assessed (Fig. 2.77). The relationship between the superior articular process from the caudal level and the exiting nerve root should be evaluated because hypertrophy of this structure leads to lateral recess and foraminal stenosis. The extraforaminal zone should also be studied at each level to rule out far lateral disc pathology. The psoas muscles are seen adjacent to the vertebral bodies in the
of the lumbar spine showing the neural foramina and exiting nerve
lumbar spine (Fig. 2.77), and the major vessels (including the aorta and vena cava) are seen anterior to the vertebral bodies. Along with the spine, these structures should also be evaluated for pathologic processes such as aneurysm, thrombosis, and infection.
Coronal Images
Coronal images provide a clear evaluation of the general alignment and anatomy of the lumbar spine, allowing for the identification of the vertebrae and intervertebral discs. Because lordosis increases toward the caudal aspect of the lumbar spine, it is impossible to obtain one image that visualizes the entire spinal canal and its contents. The coronal plane images can be used to evaluate spinal alignment and transitional anatomy at the lumbosacral junction.
http://www.boxutech.com

Available for academic purposes
toward more accessible knowledge
|
L1-L2 |
Anterior |
|
|
|
longitudinal lig. |
Aorta |
||
|
disc space |
|
||
|
Inferior |
|
|
|
|
vena cava |
|
Posterior |
|
|
|
|
longitudi- |
|
|
|
|
nal lig. |
|
|
Right |
|
|
|
|
kidney |
|
|
|
|
Exiting |
|
Dural sac |
|
|
spinal |
|
|
|
|
n. root |
|
|
|
|
Transverse |
|
Conus |
|
|
process |
|
||
|
|
|
medullaris |
|
|
Superior |
|
|
|
|
articular |
|
|
|
|
facet |
|
Ligamentum |
|
|
Longissimus |
|
flavum |
|
|
|
|
|
|
|
m. |
|
|
|
|
Iliocostalis m. |
Rotatores m. |
|
|
|
Spinalis m. |
Spinous process |
||
|
Multifidus m. |
|||
|
|
|
|
|
|
|
|
|
|
A |
Semispinalis m. |
|
B |
|
Fig. 2.76 An axial T2-weighted image (A) and artist’s sketch (B) of the spine at the level of the L1-L2 intervertebral disc showing the conus medullaris and the L1 spinal nerve root, as well as the superior and inferior articular processes of the L1-L2 facet joint.
Fig. 2.77 An axial T2-weighted image at the level of the L4-L5 intervertebral disc showing the cauda equina, L4 spinal nerve root, and L4 dorsal root ganglion. Normal flow voids are seen within the common iliac arteries, just below the aortic bifurcation.
http://www.boxutech.com

toward more accessible knowledge
Available for academic purposes
76I Initial Concepts
References
1.Stoller DW, ed. Stoller’s Atlas of Orthopaedics and Sports Medicine. Baltimore: Lippincott Williams & Wilkins; 2008
2.El-Khoury GY, Montgomery WJ, Bergman RA, eds. Sectional Anatomy by MRI and CT. 3rd ed. Philadelphia: Churchill Livingstone (Elsevier); 2007
3.Uri DS. MR imaging of shoulder impingement and rotator cu disease. Radiol Clin North Am 1997;35:77–96
4.Bredella MA, Tirman PFJ, Peterfy CG, et al. Accuracy of T2weighted fast spin-echo MR imaging with fat saturation in detecting cartilage defects in the knee: comparison with arthroscopy in 130 patients. AJR Am J Roentgenol 1999;172:1073– 1080
5.Disler DG, Recht MP, McCauley TR. MR imaging of articular cartilage. Skeletal Radiol 2000;29:367–377
6.Potter HG, Linklater JM, Allen AA, Hannafin JA, Haas SB. Magnetic resonance imaging of articular cartilage in the knee. An evaluation with use of fast-spin-echo imaging. J Bone Joint Surg Am 1998;80:1276– 1284
7.Blease S, Stoller DW, Safran MR, Li AE, Fritz RC. The elbow. In: Stoller DW, ed. Magnetic Resonance Imaging in Orthopaedics and Sports Medicine. Philadelphia: Lippincott Williams & Wilkins; 2007:1463– 1625
8.Werlen S, Leunig M, Ganz R. Magnetic resonance arthrography of the hip in femoracetabular impingement: technique and findings. Oper Tech Orthop 2005;15:191–203
9.Fitzgerald RH Jr. Acetabular labrum tears. Diagnosis and treatment. Clin Orthop Relat Res 1995;311:60–68
10.Loredo R, Hodler J, Pedowitz R, Yeh LR, Trudell D, Resnick D. Posteromedial corner of the knee: MR imaging with gross anatomic correlation. Skeletal Radiol 1999;28:305–311
11.Cone RO III. Knee. Section B. Imaging sports-related injuries of the knee. In: DeLee JC, Drez D Jr, Miller MD, eds. DeLee and Drez’s Orthopaedic Sports Medicine: Principles and Practice. Philadelphia: WB Saunders; 2003:1595–1652
12.Stanitski CL. Knee. Section D. Meniscal injuries. Part 2. Meniscal injuries in the skeletally immature patient. In: DeLee JC, Drez D Jr, Miller MD, eds. DeLee and Drez’s Orthopaedic Sports Medicine: Principles and Practice. Philadelphia: WB Saunders; 2003:1686–1696
13.Peterfy CG, Janzen DL, Tirman PFJ, van Dijke CF, Pollack M, Genant HK. “Magic-angle” phenomenon: a cause of increased signal in the normal lateral meniscus on short-TE MR images of the knee. AJR Am J Roentgenol 1994;163:149–154
14.Morgan S, Saifuddin A. MRI of the lumbar intervertebral disc. Clin Radiol 1999;54:703–723
15.White ML. Cervical spine: MR imaging techniques and anatomy. Magn Reson Imaging Clin N Am 2000;8:453–469
16.Kaiser JA, Holland BA. Imaging of the cervical spine. Spine (Phila Pa 1976) 1998;23:2701–2712
17.Khanna AJ, Carbone JJ, Kebaish KM, et al. Magnetic resonance imaging of the cervical spine. Current techniques and spectrum of disease. J Bone Joint Surg Am 2002;84(Suppl 2):70–80
18.Boden SD, Lee RR, Herzog RJ. Magnetic resonance imaging of the spine. In: Frymoyer JW, ed. The Adult Spine: Principles and Practice. Philadelphia: Lippincott-Raven; 1997:563–629
http://www.boxutech.com
|
Available for academic purposes |
|
|
3 |
A Systematic Approach to the Review |
of Musculoskeletal MRI Studies |
A. Jay Khanna
toward more accessible knowledge
■ General Concepts
As with any new skill, learning the process for evaluating an MRI study begins with a systematic approach. Less experienced clinicians may have a tendency to review films without paying special attention to the type of imaging studies, the pulse sequences that are being evaluated, or the plane in which they are being evaluated. When reviewing films on a computer workstation, they also may tend to review only one pulse sequence or one or two imaging planes. These shortcuts, especially early in a clinician’s experience in evaluating MRI studies, may lead to less accurate and less reliable MR study interpretation.
Chapter 1 provided a summary of the technical foundation that radiologists often use to select the appropriate pulse sequences and imaging techniques for the study of a given region or pathologic process. The purpose of this more clinically oriented chapter is to provide the clinician or radiologist with a method for evaluating MRI studies in an organized and systematic fashion. The adoption of such a system early in a clinician’s experience is believed to lead to improved accuracy and reliability in the interpretation of MRI studies. Over time, clinicians may be able to incorporate a more informal method of evaluating the MRI studies and rely more on their own experience and personalized method of study evaluation.
The evaluation of an MRI study can be divided into the following five steps:
1.Determination of which conventional and specialized MRI pulse sequences are available for review
2.Evaluation of T2-weighted images for recognition of areas of increased T2-weighted signal that are not expected or physiologic
3.Evaluation of T1-weighted images for improved detection of anatomic detail and correlation of the alteration in local and regional anatomy on the T1-weighted images with areas of increased signal intensity on the T2-weighted images
4.Evaluation of specialized MRI pulse sequences that may be specific to the region or disease process that is being evaluated
5.Correlation of the above imaging information with the patient’s history, physical examination, and laboratory
study results to identify the most likely di erential diagnostic considerations
The use of a general technique of MRI study evaluation described in this chapter in conjunction with the more regionand concept-specific information provided in subsequent chapters will help improve a clinician’s ability to accurately interpret an MRI study of the musculoskeletal system.
■Step 1: Determination of Pulse Sequences Available for Review
The first step in the evaluation of an MRI study is to determine which pulse sequences are available for review. For
Fig. 3.1 A sagittal T2-weighted image of the cervical spine. Note that the CSF is of high signal intensity.
77
http://www.boxutech.com
Available for academic purposes
78 I Initial Concepts
toward more accessible knowledge
A
Fig. 3.2 Sagittal fat-suppressed T2-weighted (A) and T1-weighted
(B) images of the knee. Note that the joint fluid is high signal on the former and low signal on the latter. Note also that there is a horizontal
most cases, such sequences include at least T1-weighted and conventional T2-weighted images, acquired in the sagittal, axial, and (frequently) coronal planes. MR images of the spine (cervical, thoracic, and lumbar) are often acquired only in the sagittal and axial planes.
In addition to conventional T1-weighted and T2-weighted pulse sequences, there are other pulse sequences that are often acquired and that should be recognizable, including the following:
•Fat-suppressed T2-weighted images or STIR images
•Postgadolinium T1-weighted images
•Gradient-echo images
•MR arthrography images
•MR angiography images
B
tear of the posterior horn of the medial meniscus with an associated meniscal cyst, which is best seen on the T2-weighted image (A).
T1-Weighted and T2-Weighted Images
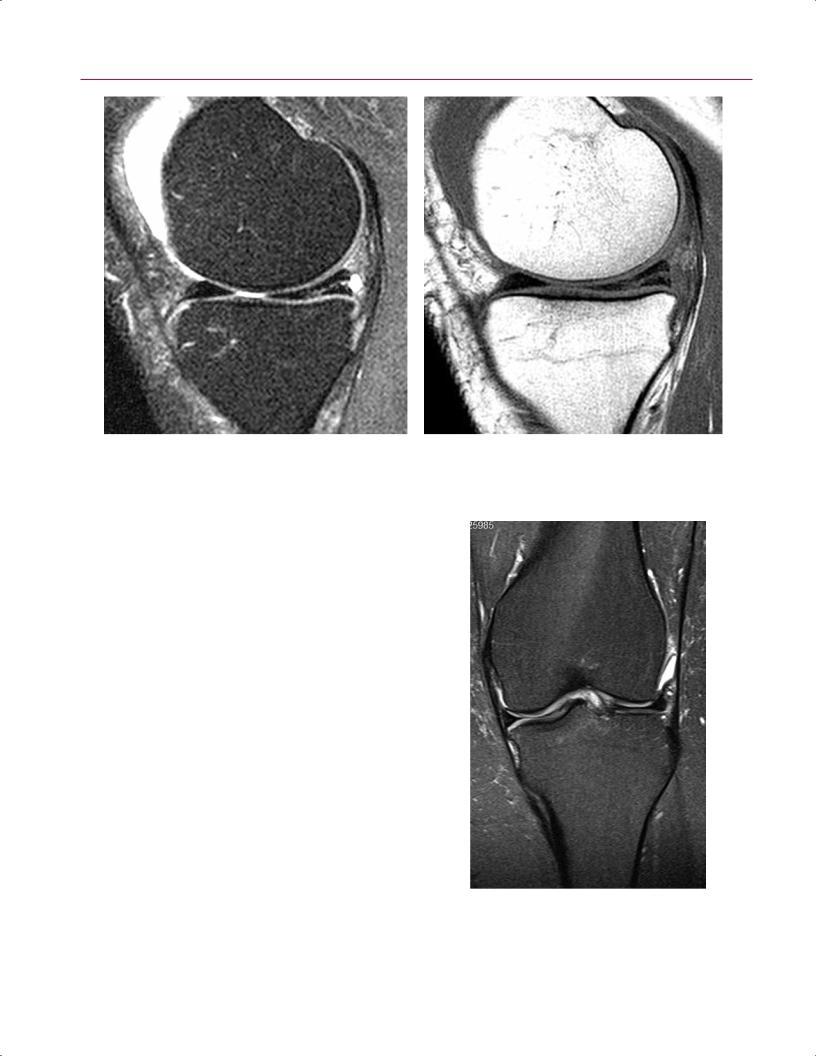
One should be able to determine whether an image is T1weighted or T2-weighted using the following techniques:
•Recognition of an area within an image that is known to contain fluid, such as the spine (CSF) (Fig. 3.1), the region of the hip (bladder), and the knee or other joints (intraarticular fluid) (Fig. 3.2). If this fluid is noted to be bright or of high signal intensity, that image is likely T2-weighted. If the region of the fluid is noted to be dark, that image is likely T1-weighted.
Fig. 3.3 In this coronal STIR image of the left knee, note that this image is relatively dark. Thus, if an area of increased signal is noted in the tibial plateau, for example, it would be relatively conspicuous and di cult to miss.
http://www.boxutech.com
toward more accessible knowledge
Available for academic purposes
3 A Systematic Approach to the Review of Musculoskeletal MRI Studies |
79 |
•Recognition of the TR and TE values, which are often printed on the film or are visible on the workstation screen. Recognizing these values may allow the clinician to determine whether an image is T1-weighted or T2-weighted. In most institutions and in most cases, images are acquired using an SE technique (for additional details, see Chapter 1). When this technique or similar techniques are used, the TR value is usually 300 to 800 ms for T1-weighted images and 2000 to 5000 ms for T2-weighted images. If the clinician evaluates the image and is unable to use the technique in which fluid recognition allows the di erentiation of T1weighted and T2-weighted images, this technique is a good second option. If the TR number is found on the film and is noted to be in the 100s range, it likely is a T1-weighted image. If the TR number is found to be in the 1000s range, it likely is a T2-weighted image. With newer and more variable pulse sequences, this method may be less reliable.
Fat-Suppressed T2-Weighted Images or STIR Images
Fat-suppressed T2-weighted images are acquired using techniques similar to those for conventional T2-weighted images,
and then various computer algorithms and processes are used to “suppress” the signal that is coming from fat. A more “pure” way of achieving this goal is to acquire a STIR image, in which case the signal from fat is not acquired. Because of the suppression of signal from fat in either of these techniques, the images tend to appear quite a bit “darker” than images obtained via other techniques (such as conventional T2-weighted images) and thus help accentuate the increase in T2-weighted signal (relative to the adjacent tissues), which may otherwise be missed (Fig. 3.3). Specifically, this technique facilitates the evaluation of bone marrow edema and edema secondary to other pathologic processes. Fatsuppressed T2-weighted images or STIR images show areas of edema with markedly greater conspicuity than that seen on conventional T2-weighted images (see individual chapters for applications of these techniques for region-specific pathology).
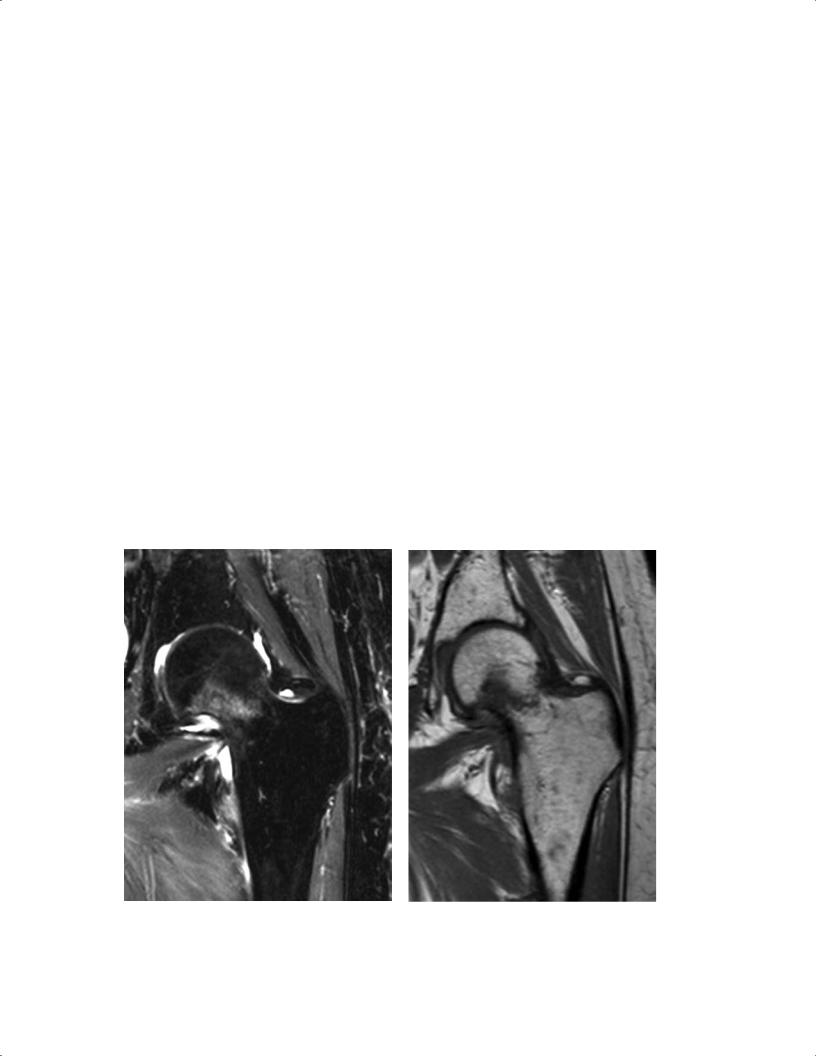
As an example, in the evaluation of a nondisplaced femoral neck fracture, coronal T1-weighted or T2-weighted images may not show edema along the fracture line, whereas a fat-suppressed T2-weighted image or a STIR image would make such a finding quite obvious (Fig. 3.4). These latter images are also useful for determining whether a vertebral compression fracture represents a chronic fracture or an acute or subacute fracture (Fig. 3.5).
A |
B |
Fig. 3.4 Nondisplaced femoral neck fracture in the left hip. (A) A |
fracture. (B) A T1-weighted image shows a linear pattern of low sig- |
coronal STIR image shows a region of increased signal intensity in |
nal within the femoral neck, which helps confirm the diagnosis of an |
the femoral neck, suggestive of an acute or subacute nondisplaced |
acute, nondisplaced femoral neck fracture. |
http://www.boxutech.com