

Книги по МРТ КТ на английском языке / Functional Neuroimaging in Child Psychiatry Ernst 1 ed 2000
.pdf34 E. D. Morris et al.
Fig. 2.6. Comparison of images achieved with a perfect scanner (left) and a realistic scanner (right) for the same object. The large circle represents the entire brain while the ellipses represent the striatum. The measured radioactivity concentrations equal the true concentrations in both regions. In the realistic scanner, the radioactivity distribution in the ªstriatumº is artifactually reduced owing to smearing (spill-over) into the adjacent brain tissue. Conversely, radioactivity in the area of the brain adjacent to the ªstriatumº is artifactually too high from radioactivity spilling in from the ªstriatumº.
Fig. 2.7. The resolution of a PET or SPECT scanner is often expressed in terms of its full width at-half-maximum (FWHM). The image intensity is plotted as function of position along a line in an image of a point of radioactivity. At half the maximum amplitude, 0.5 here, lines are drawn extending toward the x-axis. The distance between these lines, 8mm, is the FWHM.
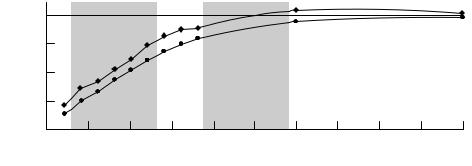
(both in terms of mass and radioactivity) of ligand injected. Figure 2.8 shows results of a simulation study of the eVect of striatum size on binding potential estimates. The experimental conditions simulated were similar to those described in the literature (Morris et al., 1999). For simulated striata of sizes comparable to those of a rhesus monkey, the eVect was quite pronounced on a PET scanner with 6.5mm resolution. The estimated binding potential was found to be as little as 35%, and at best 80% of the true value. The error would not be as large for human adult striata but it might still be signiWcant.
By way of example, consider that the age-related decline in striatal D2 receptor binding has been measured at 1±2% per year in humans (Rinne et al., 1993; Wong et al., 1997) but there is also evidence that the size of the striatum changes (declines) with age (McDonald et al., 1991). Fully one third of the decline in D2 binding with age in monkeys (measured via PET) can be attributed to size changes with age (Morris et al., 1999). In studies where the diVerence in the size of an eVect between groups is expected to be small and where there may be a bias in structure size between subject groups, it would seem prudent to correct for partial volume error. Group biases might be present in develop-
Modeling of receptor images in PET/SPECT |
35 |
|
|
binding |
|
100 |
|
|
|
|
|
|
|
|
|
|
potential |
80 |
|
Fitting |
|
Graphical |
|
|
|
|
|
||
Percentage true |
60 |
|
|
|
|
|
|
|
|
|
|
|
40 |
|
Monkey |
|
|
Human |
|
|
|
|
|
||
|
|
|
|
|
|
|
|
|
||||
20 |
|
|
|
|
|
|
|
|
|
|
||
|
|
6 |
8 |
10 |
12 |
14 |
16 |
18 |
20 |
22 |
24 |
|
|
|
4 |
||||||||||
|
|
|
|
|
|
Object width (mm) |
|
|
|
|
||
Fig. 2.8. The eVect of partial volume (striatum size) on binding potential (BP) estimation studied using computer simulation techniques. Brain and striatum sizes over a wide range of sizes were considered. For sizes that correspond to those of small monkeys, both the Wtting and graphical methods of estimating BP produced estimates that were between 35 and 80% of its true value (E. D. Morris and R. F. Muzic, unpublished data). For larger sizes, in the range of adult humans, the BP estimates were much closer to the true value.
mental studies of children or in studies that compare normal subjects with those with brain atrophy. The proper choice of a group of age-matched controls for any PET study requires that researchers consider the possible eVects of partial voluming.
Correcting for the partial volume eVect
The partial volume eVect has been widely recognized as a limiting factor in the ability to quantify the amount of radioactivity in tissue accurately. The challenge has been to formulate a correction that is practical to apply yet accounts for the dependence on the local contrast (which changes with time) and the object size (which does not). Existing correction methods can be divided loosely into two groups: those that require (or make assumptions about) anatomic information and those that do not. Typically, the information is MR or CT data from which the size of the various structures may be determined. When such data are available, it is preferable to use them in the correction since there is the potential to determine the radioactivity concentration accurately in very small structures. In comparison, techniques that do not require or assume anatomic data will have diYculty in distinguishing between a certain amount of radioactivity in a small object and a higher amount of radioactivity in an even smaller object. Hence an inherent limitation of emission tomography is that, below a certain object size, the size of the object and the concentration of radioactivity in that object are intrinsically (inversely) correlated. For a given measurement, size and concentration cannot both be determined. As the size decreases, the degree of correlation worsens. Sometimes it is feasible and convenient to obtain MR or CT data for the purpose of applying a partial volume correction; other times it is not.
Corrections requiring anatomic information
Kessler et al. (1984) presented a seminal paper on a method to correct for partial volume eVects. Their work introduced the hot spot recovery coeYcient (HSRC) and the cold spot recovery coeYcient (CSRC). The measured radioactivity in a structure can be calculated as
Measured radioactivity 5 (HSRC!true structure
(2.12)
radioactivity)1 (CSRC!true background radioactivity)
The HSRC is the fraction of the true activity in the structure that is measured when there is no background radioactivity. The CSRC is the fraction of the background activity that is measured (erroneously) in the structure containing no radioactivity, given a hot background. HSRC and CSRC are dependent on the size of the structure and can be determined either mathematically (i.e., via simulations) or via phantom experiments. They are both independent of contrast. Given an estimate of the structure size, one can determine appropriate values of HSRC and CSRC. With these values and knowledge of the true background radioactivity (often approximated as being equal to the measured background radioactivity), the above equation can be solved to determine a structure's true radioactivity from the measured tissue radioactivity.
A number of studies have extended this method to consider cross-contamination between multiple structures in the image (Rousset et al., 1996, 1998). This is analogous to having HSRC and CSRC values for each structure and `background' in the image. To determine these values, the structures of interest are deWned in the MR or CT images. For each structure, a mask image is created with pixel values inside the structure set to unity, and zero otherwise. A spatial resolution distortion function that models the resolution characteristics of the PET or SPECT scanner is then applied to each. The resultant set of blurred mask

36E. D. Morris et al.
images represents how each structure would be imaged if it represented the only radioactivity present. Region-of- interest analysis of these images yields a matrix with elements corresponding to HSRCs and CSRCs. Multiplication of the matrix by the vector containing the true radioactivity concentrations yields a vector of the observed concentrations. Therefore, the true concentrations may be obtained by solving the matrix equation. This is analogous to a generalization of the above equation for a set of n regions:
m1 |
|
HSRC 1 |
CSRC 12 ¼ CSRC 1n |
T1 |
|
m2 |
= |
CSRC 21 |
HSRC 2 |
T2 |
(2.13) |
¼ |
|
¼ |
¼ |
¼ |
|
mn |
|
CSRC n1 |
HSRC n |
Tn |
|
where the left hand side of the equation is the set of measured radioactivities, mi, in each region i and the elements of the vector on the right hand side are the true radioactivity Ti in each region, respectively. The matrix on the righthand side consists, on the diagonal, of recovery coeYcients for each region. The oV-diagonal terms are the spillover fractions CSRCij, indicating the spillover of radioactivity from ªbackgroundº region j to ªforegroundº region i. When the region j is far from the region i, then the CSRCij is zero.
Another group has described a correction technique based on the similar principle except that corrected values are determined directly from the mask images and the measured image (Muller-Gartner et al., 1992). As part of this analysis, the set of blurred masks are then summed together to reconstitute the blurred image. In eVect, they are implicitly solving the matrix equations.
The above approaches are quite elegant and use wellaccepted principles of scanner performance. Yet, there are caveats to keep in mind. First, and foremost, MR or CT data must be available to create the masks for each structure. Of course the structures of interest must be clearly discernable since small errors in the size of the structures can lead to signiWcant errors in the correction (Herrero et al., 1989). Second, the PET or SPECT data must be accurately registered with the MR or CT data so that mask images can be properly applied to the PET or SPECT data. Third, there is an underlying assumption that the radioactivity concentration within each structure (e.g. all the white matter) is uniform.
Corrections not requiring anatomic information
Corrections that do not require anatomic information can be subclassiWed into ones that are based on a pharmacokinetic model and ones that are based on a model of scanner (spatial resolution) characteristics. The pharmacokinetic
approach requires the PET or SPECT data to be analyzed using a mathematical model of radioactivity uptake. The models are similar to the one discussed earlier in this chapter but terms for the HSRC and CSRC, or their equivalents, are also included in the model as unknown parameters (see, for example, Herrero et al. (1989) or Feng et al. (1996)). These values are estimated simultaneously with the physiologic parameters. Aside from requiring that dynamic tissue data are available, perhaps the most signiWcant limitation of this approach is that the physiologic parameters (e.g., blood Xow) are often highly correlated with HSRC and CSRC parameters (Feng et al., 1996; Muzic, et al., 1998). In other words, estimates of some or all of the parameters may be unreliable.
In the approach based on a model of the scanner, the radioactivity in the structure of interest (e.g., a lesion) is approximated as having a simple geometric shape (e.g., a sphere) containing a uniform concentration of activity (Chen et al., 1999). Likewise, the lesion is assumed to be situated within a much larger ªbackgroundº region that is also uniform in radioactivity. Parameters representing the size, position, and radioactivity of the lesion along with the radioactivity in the background region are estimated simultaneously. This is accomplished by blurring the sphere with a mathematical model for scanner resolution eVects and adjusting the size and activity inside the sphere until the model-predicted image best matches the measured image. This has the advantage of not requiring MR or CT data, although the minimum object size at which both the size and radioactivity can be estimated is limited because the quantities become increasingly correlated as lesion size diminishes. Nevertheless, any anatomic data about the object size, if available, could be used in this model-based method so that only the radioactivity need be estimated.
Model simpliWcations
It is not always practical to acquire structural data on a patient (e.g., for use in partial volume correction), nor is it always practical, or even permitted, to acquire blood samples for plasma radioactivity measurements. In other words, a kinetic analysis must be attempted without the critical plasma input function P. Luckily, a number of modeling techniques have been developed for such situations.
Eliminating the need for an input function
Although PET receptor studies are promoted as being noninvasive to the patient, this term is often modiWed to ªmini-

Modeling of receptor images in PET/SPECT |
37 |
|
|
mally invasiveº when arterial blood sampling is performed. Obtaining arterial blood samples can be a relatively painful experience and carries some risk of arterial damage (Jons et al., 1997). The presence of this risk may preclude the use of quantitative PET and SPECT in pediatric studies. As discussed earlier, determining the proper input function can sometimes be tricky even if blood samples are not proscribed. For these reasons, considerable eVort has been spent in eliminating the need for arterial blood samples.
The (metabolite-corrected) radioactivity concentration of tracer in arterial plasma represents the amount of radiotracer that is presented to the tissue of interest over the course of the experiment. In principle, this input function is required to solve any of the systems of equations given earlier (e.g., Eqs (2.1±2.3) or (2.5±2.7)). However, researchers can take advantage of predictable relationships between the input function and activity in either receptorrich or receptor-poor regions. Because the input to both (receptor-rich and receptor-poor) regions is essentially the same, the equations describing ligand dynamics in one region can be expressed solely in terms of concentration measured in the other. Explicit use of the plasma concentration is not needed. What are the assumptions inherent in this simpliWcation and which parameters can be measured with such techniques?
Reference region techniques
Reference region techniques refer to analysis methods that use scanned measurements in an area in the brain to provide an estimate of the free ligand concentration where speciWc binding is negligible. The concentration from such a region is then plugged into a tracer kinetic model, either as a dynamic input function or as a static estimate of the free ligand concentration at equilibrium. In order to reduce the degrees of freedom in the estimation problem, these methods typically assume that the free space distribution volume, DVF 5 K1/k2, is constant across all regions of the brain. That is, at steady state, the ratio of ligand in the free compartment to plasma compartment is assumed to be the same everywhere. The term DVF describes the volume of tissue into which the free ligand mass present in 1ml of tissue would distribute with the same concentration as in the blood (P). If the ligand can distribute in only one third of the volume of the tissue, then at steady state, a mass, x, of ligand dissolved in 1ml blood would distribute in the available space of 3ml tissue; the distribution volume, DVF, is 3 (ml tissue)21/(ml blood)21 (Delforge et al., 1996). The assumption of constant DVF does not mean that K1 is identical from region to region. Neither is the concentration of free ligand constant across regions except
at steady state. This means that the diVerence between activities in a target and a reference region cannot be taken as a measure of binding except at equilibrium. This can then be used to modify the model equations.
A model-®tting method
Cunningham et al. (1991) proposed solving for the arterial input function in a reference region in the following way:
dFR |
|
R |
R |
|
dt |
5 K1 |
P2 k2 |
FR |
(2.14) |
|
|
|
|
Equation 2.14 is rearranged to
P5 3ddFtR 1 k2RFR4/K1R
and substituted into the model to give Eqs. 2.15 and 2.16, which describe dynamics in a receptor-rich region:
dF |
5 K |
P2 (k 1 k )F1 k |
B |
(2.15) |
|||
|
|||||||
dt |
1 |
2 |
3 |
4 |
|
|
|
|
|
|
|
|
|
||
dB |
5 k F 2 k B |
|
|
|
(2.16) |
||
|
|
|
|
|
|||
dt |
3 |
4 |
|
|
|
|
|
|
|
|
|
|
|
||
FR represents radioligand concentrations in the reference region and F and B represent the (time varying) free and speciWcally bound activities, respectively, in the target region. We apply the constraint that the free space distribution of the radioligand be equal in the two regions, (i.e., KR1/k2R5 K1/k2). Corrections to the technique may be necessary if the reference region is not completely devoid of speciWc binding (Cunningham et al., 1991). By constraining only the free-space distribution ratio and not K1 or k2, individually, the model allows for kinetic diVerences between regions. The constraint is necessary, however, to guarantee that the remaining parameters, k3 and k4, will be identiWable.
This reference region model was originally applied to a -- opioid receptor ligand, [3H]-diprenorphine (Cunningham et al., 1991) and later modiWed for use with PET and [11C]- raclopride (Hume et al., 1992) in rats. A comparative study was performed and reported by Lammertsma et al. (1996) examining this method and several others that require arterial blood data for analysis. The goal of the Lammertsma study was to measure the apparent BP, B9max/KD, accurately. The authors concluded that the most reliable measure of BP was given by the method described above (Eqs. (2.14±2.16)). Because this technique uses an iterative leastsquares minimization algorithm, it is presumed to be an unbiased estimator of BP (Hsu et al., 1997). Unfortunately, as an iterative method, it may be too slow for making parametric images. A recent modiWcation of the iterative reference region technique incorporates a further model

38 E. D. Morris et al.
Fig. 2.9. An example of a Logan plot for rapid data analysis. The data are plotted as described in Eq. (2.17) from the cerebellum (n) and the straitum (e) (Ca is equivalent to P and ROI is equivalent to Ct ). The binding potential is determined by the ratio of the slopes (striatum/cerebellum) of the lines regressed to the data.
simpliWcation and uses spectral analysis methods for estimating parameters. It has been used successfully for parametric image generation (Gunn et al., 1997).
Graphical methods: Logan-plot analysis
The method of Logan et al. (1990) was initially developed to provide a technique for rapid data analysis. It uses another rearrangement of the model equations (2.1) and (2.2) that can be solved noniteratively to generate a parametric image of BP values at each pixel of a PET/SPECT image. The rearranged operational equation used for this technique is given as:
T |
|
T |
|
|
|||
E Ct(t)dt |
|
E P(t)dt |
|
|
|||
0 |
|
5 DV |
0 |
|
1 b |
(2.17) |
|
Ct(T) |
Ct(T) |
||||||
|
|
|
|||||
where Ct(t) is the concentration of the radioligand in the tissue, P is the arterial plasma concentration, DV is the distribution volume, and b is a constant of integration that is a composite function of the rate parameters dependent on the assumed model. Notice the resemblance of Eq. (2.17) to that of a line, y5 mx1 b, with its two estimable parameters. An example of the Logan plot is shown in Fig. 2.9. In essence, the nonlinear ªPETº curve in Fig. 2.2, which is made up of bound and free ligand, has been transformed, or linearized, into Fig. 2.9. (By way of comparison, the log function is a common way of linearizing data that demonstrate exponential behavior.) The ªfreeº curve in the earlier Wgure can be thought of as a reference region; when it is transformed it yields a curve like the lower one in Fig. 2.9. For reversibly bound tracers, a point in time is reached when the change in plasma
concentration is approximately equal to the change in tissue concentration. Beyond this time, the slope of the above function will be constant and will equal DV. On the Logan plot, this time corresponds to a transition point beyond which the plot is linear. (The x axis on the Logan plot represents a sort of ªstretchedº time.) For a region with no speciWc binding, DV describes the free space distribution volume K1/k2. In regions with speciWc binding, DV represents the product of free and bound distribution
volumes (K1/k2)(11 B9max/KD). In both regions, slow nonspeciWc binding (i.e., small values of k5 and k6) and
plasma volume, +v are neglected. Contrary to the modeling approaches discussed at the beginning of the chapter, the transformation underlying the Logan plot cannot accommodate a radioactive decay term. Therefore, it is essential that the data be corrected for radioisotope decay prior to graphical analysis. This method was originally validated for [11C]-cocaine and subsequently for [11C]- raclopride (Logan et al., 1994).
Further work by Logan and co-workers (1996) demonstrated that the above model could be modiWed to eliminate the need for a measured arterial input function. By substituting reference region data, Cref, for the arterial plasma, Eq. (2.17) becomes:
T |
|
T |
|
|
|||
E Ct(t)dt |
|
E Cref(t)dt |
|
|
|||
0 |
|
5 DVR |
0 |
|
1 b9 |
(2.18) |
|
Ct(T) |
Ct(T) |
||||||
|
|
|
|||||
where DVR is the ratio of distribution volumes in target to
reference region and equals (11 fNSB9max/KD), where fNS is equivalent to the free fraction of tracer (f2), introduced by
Mintun, and converts KD to the eVective equilibrium dissociation constant. This equation holds provided that the ratio of Cref to Ct is nearly constant. If this condition is not satisWed, there is still a valid linearization using the reference region concentration but it requires the use of a pop- ulation-average k2 value.
The primary merit of this technique, other than obviating the need to sample arterial blood, is its computational ease. The linear function given in Eq. (2.18) can be solved pixel-by-pixel, permitting rapid generation of parametric images; an example of an image of the BP
fNSB9max/KD, is shown in Fig. 2.10. The model can also be applied to other reversibly bound radioligands. The
application of the model to other radiotracers diVers only in choosing the (transformed) time at which the function becomes linear.
The use of [11C]-raclopride has been well validated for determining the BP of D2 receptors and change in BP (i.e., receptor occupancy). The reference region techniques
Modeling of receptor images in PET/SPECT |
39 |
|
|
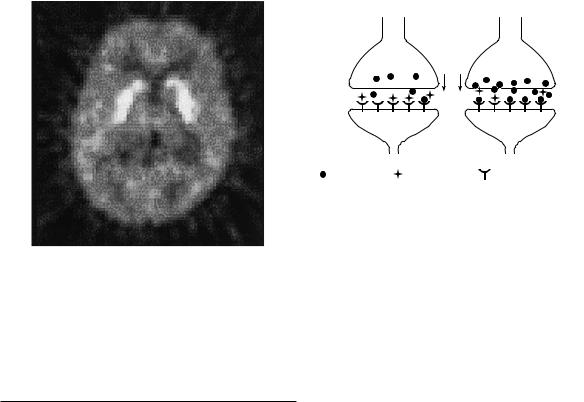
Fig. 2.10. A parametric image of binding potential. A value of binding potential was calculated for each pixel in the image via the reference region technique of Logan et al. (1996).
described above work well for measuring these parameters in a clinical setting.
Rest |
Activation |
Presynaptic
Postsynaptic |
|
|
Dopamine |
Radioligand |
Dopamine receptor |
Fig. 2.11. Schematic diagram of a dopamine (DA) synapse at rest and during activation. At rest, the neuron releases some DA, but there are many free postsynaptic receptors to which the PET tracer (radioligand) can bind. During performance of a task that activates DA neurons (or application of a drug that increases DA release or inhibits reuptake), there is increased DA in the synapse, which causes increased competition for the postsynaptic receptors. Consequently, speciWc binding of the PET radioligand is decreased.
New clinical and research applications
Armed with an array of both complicated and simple modeling approaches, let us return to the problem of measuring neurotransmitter changes with PET.
Neurotransmitter ,,activation,, studies
Until recently, PET and SPECT brain imaging studies could be divided into two groups: receptor±ligand studies (as discussed above) and tracer studies that included activation. In the latter type, a subject would be asked to perform an activation task, such as speaking words or recalling items from memory, during a brain scan. Images of regional cerebral blood Xow (or glucose metabolism) would be obtained and processed to reveal areas of the brain that are involved in the task. This technique, unfortunately, does not reveal the speciWc neurotransmitter systems that might be activated by the task.
Nevertheless, it has been believed for some time that the competition between endogenous and exogenous ligands (Fig. 2.11) could be exploited to image some aspect of dopamine release in vivo resulting from ªactivationº of a neuronal pathway or circuit (Dewey et al., 1990, 1991). Through the performance of a task that activates dopaminergic neurons, or the administration of a drug that
increases dopamine levels, extra dopamine can compete with radioligand at dopamine receptors. As mentioned above, to succeed, this competition must reduce the PET signal by a discernible amount. If detectable, the measurement could have applications in the imaging of various neuromodulatory transmitter systems (e.g., dopamine, acetylcholine, serotonin, norepinephrine (noradrenaline)). These systems typically innervate the brain diVusely but constitute only a small fraction of all the synapses in any target brain region (Squire 1987; Cooper et al., 1991). As such, the PET signal from these neurons would probably be overwhelmed by the signal from other neurons in a cerebral blood Xow or metabolism study.
In fact, the neurotransmitter activation approach has been used successfully to demonstrate dopamine release induced by a variety of drugs, including amphetamine (Dewey et al., 1991; Laruelle et al., 1995; Carson et al., 1997) and cholinergic antagonists (Dewey et al., 1993). Clinical applications have already begun to appear, including the demonstrations of high dopamine response to amphetamine in schizophrenics (Breier et al., 1997; Laruelle et al., 1996) and the low dopamine response to methylphenidate in cocaine abusers (Volkow et al., 1997). The technique has even been used to visualize task-acti- vated, dopaminergic synaptic transmission in the human brain in vivo (Koepp et al., 1998) without a pharmacological stimulus.

40E. D. Morris et al.
Detection of neuromodulatory synaptic transmission in the human brain
Background
Until the 1990s, it was commonly believed that a very large increase in dopamine levels, such as that induced by pharmacologic means, would be necessary to detect a change in the PET or SPECT signal. It was not clear whether activation of dopaminergic neurons by a mental or physical task would cause suYcient dopamine release to be observable. The answer would depend on the concentrations of dopamine and radiotracer in the synapse, aYnities of the two molecules for dopamine receptors, and alterations in dopamine neuronal Wring rates during activation tasks. The concentration of dopamine in the synapse remains unknown. However, estimates from a variety of sources indicate that it reaches a peak of 10±100-mol/l following release from the presynaptic terminal and that it clears with a time constant on the order of 2ms. These numbers suggest an average synaptic concentration of about 100 nmol/l, which rises to at least 200nmol/l during an activation task (see references and calculations in Fisher et al., 1995).
Given these and other estimates, Fisher and colleagues were willing to predict that such a cognitive activation task would indeed cause a measurable change in radioligand binding (Fisher et al., 1995; Morris et al., 1995). Encouraging preliminary results have been obtained using
SPECT with the D2 receptor antagonist [123I]-IBZM (Ebert et al., 1994): depressed patients that responded to total
sleep deprivation showed a decrease in relative radioligand binding in the basal ganglia in the post-sleep deprivation scan compared with the baseline scan. These preliminary results were interpreted as evidence of increased dopamine release induced by sleep deprivation. More deWnitive experimental support for imaging of behavioral activation was lacking.
New developments
The functional imaging landscape changed after Koepp et al. (1998) observed eight volunteers performing a video game while undergoing an [11C]-raclopride PET scan. The game required players to maneuver a tank through a battleWeld, and players received a monetary award depending on their success at the game. On a separate day, the same volunteers underwent another raclopride scan while staring at a blank screen instead of playing the video game. This is the two-bolus protocol discussed earlier in this chapter; the measured parameter that was used as the index of competition was change in binding potential, % BP. The researchers found that the binding of [11C]-
raclopride in the striatum was signiWcantly decreased during the video game, compared with the level at rest. This indicated that the dopaminergic neurons in the striatum had been activated during the playing of the game and had presumably liberated an increased quantity of dopamine into their synapses. In other words, Koepp and co-workers had witnessed, via PET, the nonpharmacologic activation of the dopamine system in humans.
The results of Koepp et al. (1998) raise several interesting questions. First, what aspect of the video game caused the subjects' dopaminergic neurons to increase their Wring rate? The video game is a complex task involving visual perception, decision-making, hand movements, frustration, pleasure, rewards, etc. The game, most likely, was chosen for exactly that reason: it maximized the chances of activating dopaminergic neurons. Now that the investigators have succeeded in demonstrating such activation, an important next step will be to determine what cognitive and/or motor features of physical tasks require the use of dopamine-containing neurons. This new type of PET protocol is exactly what is needed to answer such a question. The fact that the subjects' success in the game correlated signiWcantly with their dopamine outXow (i.e., inversely with radiotracer binding), is intriguing given the role of dopaminergic neurons in pleasure and reward (Robbins and Everitt, 1996; Schultz, 1997). Electrophysiologic studies in animals suggest that dopamine neuron activity is typically triggered by reward stimuli (see Schultz (1997) for review). The hypothesis that this holds true in humans now appears to be testable using PET.
A further question is whether the same results could have been obtained by a conventional regional blood Xow study? This appears not to be the case. Koepp et al. (1998) reported a decrease in regional blood Xow (i.e., a decreased delivery of tracer) to the striatum during the study. This Wnding underscores the fact that neuromodulatory synapses comprise only a small fraction of all the synapses in any brain region. The striatum is one of the few brain regions where neuromodulatory synapses are relatively concentrated (dopamine synapses may represent up to one third of the synaptic population (Doucet et al., 1986; discussion in Wilson, 1998). And yet, the net neuronal activity in the striatum, as revealed by the blood Xow parameter Ri, was seen to decrease despite activation of the dopamine neurons. Had the experiment been performed with conventional blood Xow imaging, the results would have provided evidence for deactivation of the striatum during the task! The exact opposite conclusion regarding striatal (and, by implication, dopaminergic) function might have been reached. It is worth noting that the changes in blood Xow from subject to subject had no
Modeling of receptor images in PET/SPECT |
41 |
|
|
correlation with the changes in tracer binding, indicating that the dopamine induced decreases in receptor binding were independent of blood Xow eVects.
The opportunities for dissecting the functional neurochemistry of humans are intriguing. Serotonergic, noradrenergic, and cholinergic systems will surely be probed once radioligands with appropriate neuroreceptor speci- Wcity and kinetic properties are identiWed.
Optimal ligand kinetics
What makes a ligand optimal depends on the conditions and aims of an experiment. If the goal is to estimate the binding properties of a receptor (as Zeeberg (1995) has said, to maximize the ªreceptor sensitivityº as opposed to ªdelivery sensitivityº) then identiWability of parameters is key. As mentioned earlier, the binding parameters (k3 and k4 or kon, and koV) cannot be estimated reliably if they are too fast relative to the inXux and eZux parameters (K1 and k2). However, if detection of neurotransmitter activation is the goal, then we wish to maximize the magnitude of a particular detection index. Endres and Carson (1998) have shown that for the bolus-infusion protocol there is an optimum range of binding potentials that maximize the detection parameter %BP. Morris et al. (1995) demonstrated (also in a simulation study) that irreversible ligands would yield maximal values of x2 using the two-bolus protocol.
Possible clinical applications
What are the clinical applications of this new brain imaging paradigm? Our Wrst concern should be with the length of the activation task. The video game, described above, was played continuously for 60min: from 10min prior to raclopride injection until 50min after. This is too long a task for routine clinical examinations, particularly for children and for patients suVering from certain psychiatric illnesses. Children, in fact, will have trouble simply remaining still in the scanner for that long. Fortunately, such a lengthy task is not absolutely necessary to yield a detectable eVect. The Koepp study appears to show that release of endogenous dopamine causes a sustained decrease in the PET signal that lasts well beyond the restoration of normal resting dopamine levels. In fact, it had already been predicted that an activation task lasting 7min could be suYcient to cause a near-maximal eVect on raclopride binding using the two-bolus method (Morris et al., 1995).
There is also reason to believe that similar studies will be possible with SPECT which is more widely available. Druginduced release of dopamine has been demonstrated
using SPECT and the steady-state technique (Laruelle, et al., 1995, 1996). Results were very similar to those of PET. Mental and physical activation of dopamine neurons has not yet conclusively been demonstrated with single photon imaging. However, as mentioned above, Ebert et al. (1994) reported preliminary results of SPECT studies suggesting that sleep deprivation caused depressed subjects to release detectable amounts of dopamine.
Let us assume that quantitative SPECT imaging and analysis is possible without arterial blood sampling, what sort of neurologic or psychiatric patients might beneWt from a PET/SPECT neurotransmitter activation study? The Wrst candidates would be those suVering from illnesses that respond to drugs that alter the dopamine system. Some schizophrenics, for instance, are best treated with D2 receptor antagonists (ªtypical neurolepticsº), while others respond better to mixed D2/D1 antagonists (ªatypical neurolepticsº). Clozapine, for example, is an atypical neuroleptic that has been shown to occupy D1 and D2 receptors (among others) nearly equally in human subjects (Farde et al., 1992). Theoretically, a PET neurotransmitter activation study using a D2 receptor ligand (e.g., raclopride) and a D1 ligand (e.g., SCH23390) could demonstrate that one patient releases too much dopamine at D2 receptor synapses, while another is overactive at D1 synapses. Drug therapy could be adjusted accordingly. Related studies have already been performed: schizophrenic patients have been observed to respond to amphetamine with higher elevations of extracellular dopamine at D2 synapses than normal controls (Breier et al., 1997; Laruelle et al., 1996). These results support the dopamine hypothesis for schizophrenia in that they demonstrate a functional abnormality in the dopamine system in schizophrenics. The results, however, are not yet directly applicable to patient care.
Attention-deWcit hyperactivity disorder (ADHD) also may have a strong dopaminergic component (Ernst et al., 1998; Swanson et al., 1998a, b). Given the variety of evidence for pathophysiology of the dopaminergic system in ADHD, there may be an opportunity for a dopamine neu- rotransmitter-activation scan with a methylphenidate challenge (methylphenidate is commonly used to treat the disorder; it blocks reuptake of dopamine, thereby increasing synaptic dopamine levels). Such a perturbation might be used to predict which children would respond to the drug, as well as to aid in diagnosis in equivocal cases. The noradrenergic and serotonergic systems have been implicated in a variety of psychiatric illnesses, including depression, suicidality, and obsessive compulsive disorder (Jacobs, 1994; Kaplan et al., 1994; Kegeles and Mann, 1997). Again, with the neuroreceptor ligands it might be possible

42E. D. Morris et al.
to determine whether patients are hyperor hypoactive at various classes of synapse; these Wndings would inform drug therapy decisions.
iReferencesi
Bahn, M. M., Huang, S. C., Hawkins, R. A. et al. (1989). Models for
in vivo kinetic interactions of dopamine D2-neuroreceptors and 3-(29-[18F]Xuoreoethyl)spiperone examined with positron emis-
sion tomography. J. Cereb. Blood Flow. Metab., 9, 840±9.
Breier, A., Su, T.-P., Saunders, R. et al. (1997). Schizophrenia is associated with elevated amphetamine-induced synaptic dopamine concentrations: evidence from a novel positron emission tomography method. Proc. Natl. Acad. Sci. USA, 94, 2569±74.
Carson R. E., Channing, M. A., Blasberg, R. G. et al. (1993). Comparison of bolus and infusion methods for receptor quantitation: application to [18F]-cyclofoxy and positron emission tomography. J. Cereb. Blood Flow Metab., 13: 24±42.
Carson, R. E., Breier, A., de Bartolomeis, A. et al. (1997). QuantiWcation of amphetamine-induced changes in [11C]-raclo- pride binding with continuous infusion. J. Cereb. Blood Flow Metab., 17, 437±47.
Chen, C. H., Muzic, R. F. Jr, Nelson, A. D. and Adler, L. P. (1998). A non-linear, spatially-variant, object-dependent system model for prediction and correction of partial volume in PET, IEEE Trans. Med. Imaging, 27, 214±27.
Chen, C. H., Muzic, R. F. Jr, Nelson, A. D. and Adler, L. P. (1999). Simultaneous recovery of size and radioactivity concentration of small spheroids with PET data. J. Nucl. Med., 40, 118±30.
Cooper, J. R., Bloom, F. E. and Roth, R. H. (1991). The Biochemical Basis of Neuropharmacology. New York: Oxford University Press.
Cunningham, V. J., Hume, S. P., Price, G. R., Ahier, R. G., Cremer, J. E. and Jones, A. K. P. (1991). Compartmental analysis of diprenorphine binding to opiate receptors in the rat in vivo and its comparison with equilibrium data in vitro. J. Cereb. Blood Flow Metab., 11, 1±9.
Delforge, J. Syrota, A. and Mazoyer, B. M. (1989). Experimental design optimisation: theory and application to estimation of receptor model parameters using dynamic positron emission tomography. Phys. Med. Biol., 34, 419±35.
Delforge, J., Syrota, A. and Mazoyer, B. M. (1990). IdentiWability analysis and parameter identiWcation of an in vivo ligand-recep- tor model from PET data. IEEE Trans. Biomed. Eng., 27, 653±61.
Delforge, J., Syrota, A. and Bendriem, B. (1996). Concept of reaction volume in the in vivo ligand±receptor model. J. Nucl. Med., 37, 118±25.
Dewey, S. L., Brodie, J. D., Fowler, J. S. et al. (1990). Positron emission tomography (PET) studies of dopaminergic/cholinergic interactions in the baboon brain. Synapse, 6, 321±7.
Dewey, S. L., Logan, J., Wolf, A. P. et al. (1991). Amphetamine induced decreases in 18F-N-methylspiroperidol binding in the baboon brain using positron emission tomography (PET).
Synapse, 7, 324±7.
Dewey, S. L., Smith, G. S., Logan, J. et al. (1993). EVects of central
cholingergic blockade on striatal dopamine release measured with positron emission tomography in normal human subjects.
Proc. Natl. Acad. Sci. USA, 9, 11816±20.
Doucet, G., Descarries, L. and Garcia, S. (1986). QuantiWcation of the dopamine innervation in adult rat neostriatum.
Neuroscience, 19, 427±45.
Ebert, D., Feistel, H., Haschka, W., Barocka, A. and Pirner, A. (1994). Single photon emission computerized tomography assessment of cerebral dopamine D2 receptor blockade in depression before and after sleep deprivation ± preliminary results. Biol. Psychiatry, 35, 880±5.
Endres, C. J. and Carson, R. E. (1998). Assessment of dynamic neurotransmitter changes with bolus or infusion delivery of neuroreceptor ligands. J. Cereb. Blood Flow Metab., 18, 1196±210.
Endres, C. J., Kolachana, B. S., Saunders, R. C. et al. (1997). Kinetic modeling of [11C]-raclopride: combined PET-microdialysis studies. J. Cereb. Blood Flow Metab., 17, 932±42.
Ernst, M., Zametkin, A. J., Matochik, J. A., Jons, P. H. and Cohen, R. M. (1998). DOPA decarboxylase activity in attention deWcit hyperactivity disorder adults. A [Xuorine-18]Xuorodopa positron emission tomographic study. J. Neurosci., 18, 5901±7.
Farde, L., Eriksson, L., Blomquist, G. and Halldin, C. (1989). Kinetic analysis of central [11C]-raclopride binding to D2-dopamine receptors studied by PET: a comparison to the equilibrium analysis. J. Cereb. Blood Flow Metab., 9, 696±708.
Farde, L., Nordstrom, A.-L., Wiesel, F.-A., Pauli, S., Halldin, C., Sedvall, G. (1992). Positron emission tomographic analysis of central D1 and D2 receptor occupancy in patients treated with classical neuroleptics and clozapine. Arch. Gen. Psychiatry, 49, 538±44.
Feng, D., Li X and Huang, S. C. (1996). A new double modeling approach for dynamic cardiac PET studies using noise and spillover contaminated LV measurements. IEEE Trans. Biomed. Eng.,
43, 319±327.
Fisher, R. E., Morris, E. D., Alpert, N. M. and Fischman, A. J. (1995). In vivo imaging of neuromodulatory synaptic transmission using PET: a review of the relevant neurophysiology. Hum. Brain Map., 3, 24±34.
Friston, K. J., Malizia, A. L., Wilson, S., Cunningham, V. J., Jones, T. and Nutt, D. J. (1997). Analysis of dynamic radioligand displacement or `activation' studies. J. Cereb. Blood Flow Metab., 17, 80±93.
Frost, J. J., Douglass, K. H., Mayber, H. S. et al. (1989). Multicompartmental analysis of [11C]-carfentanil binding to opiate receptors in humans measured by positron emission tomography. J. Cereb. Blood Flow Metab., 9, 398±409.
Gunn, R. N., Lammertsma, A. A., Hume, S. P. and Cunningham, V. J. (1997). Parametric imaging of ligand-receptor binding in PET using a simpliWed reference region model. Neuroimage, 6, 279±87.
Herrero, P., Markham, J. and Bergmann, S. R. (1989). Quantitation of myocardial blood Xow with H215O and positron emission tomography: assessment and error analysis of a mathematical approach, J. Comput. Assist. Tomogr., 13, 862±73.
Hsu, H., Alpert, N. M., Christian, B. T., Bonab, A. A., Morris, E. and
Modeling of receptor images in PET/SPECT |
43 |
|
|
Fischman, A. J. (1997). Noise properties of a graphical assay of receptor binding. J. Nucl. Med., 38, 204P.
Huang, S. C., Mahoney, D. K. and Phelps, M. E. (1986). Quantitation in positron emission tomography. 8 EVects of nonlinear parameter estimation on functional images. J. Cereb. Blood Flow Metab., 6, 515±21.
Huang, S. C., Bahn, M. M., Barrio, J. R. et al. (1989). A doubleinjection technique for the in vivo measurement of dopamine D2-receptor density in monkeys with 3-(29-[18F]Xuoro- ethyl)spiperone and dynamic positron emission tomography. J. Cereb. Blood Flow Metab., 9, 850±8.
Huang, S. C., Dan-chu, Y., Barrio, J. R. et al. (1991). Kinetics and modeling of L-6-[18F]Xuoro-DOPA in human positron emission tomographic studies. J. Cereb. Blood Flow Metab., 11, 898±913.
Hume, S. P., Myers, R., BloomWeld, P. M. et al. (1992). Quantitation of carbon-11 labeled raclopride in rat striatum using positron emission tomography. Synapse, 12, 47±54.
Jacobs, B. L. (1994). Serotonin, motor activity, and depressionrelated disorders. Am. Sci., 82, 457±63.
Jons, P. H., Ernst, M., Hankerson, J., Hardy, K. and Zametkin, A. J. (1997). Follow-up of radial arterial catheterization for positron emission tomography studies. Hum. Brain Map., 5, 119±23.
Kaplan, H. I., Sadcock, B. J. and Grebb, J. A. (1994). Kaplan and Sadcock's Synopsis of Psychiatry. Baltimore:Williams and Wilkins.
Kegeles, L. S. and Mann, J. J. (1997). In vivo imaging of neurotransmitter systems using radiolabeled receptor ligands.
Neuropsychopharmacology, 17, 293±307.
Kessler, R. M., Ellis, J. R. J. and Eden, M. (1984). Analysis of emission tomographic scan data: limitations imposed by resolution and background, J. Comput. Assist. Tomogr., 8, 514±22.
Koepp, M. J., Gunn, R. N., Lawrence, A. D. et al. (1998). Evidence for striatal dopamine release during a video game. Nature, 393, 266±8.
Koeppe, R. A., HolthoV, V. A., Frey, K. A., Kilbourn, M. R. and Kuhl, D. E. (1991). Compartmental analysis of [11C]Xumazenil kinetics for the estimation of ligand transport rate and receptor distribution using positron emission tomography. J. Cereb. Blood Flow. Metab., 11, 735±44.
Lammertsma, A. A., Bench, C. J., Hume, S. P. et al. (1996). Comparison of methods for analysis of clinical [11C]raclopride studies. J. Cereb. Blood Flow. Metab., 16, 42±52.
Laruelle, M., Wallace, E., Seibl, P. (1994). Graphical, kinetic, and equilibrium analyses of in vivo [123I](-CIT binding to dopamine transporters in healthy human subjects. J. Cereb. Blood Flow. Metab., 14, 982±94.
Laruelle, M., Abi-Dargham, A., van Dyck, C. H. et al. (1995). SPECT imaging of striatal dopamine release after amphetamine challenge. J. Nucl. Med., 36, 1182±90.
Laruelle, M., Abi-Dargham, A., van Dyck, C. H. et al. (1996). Single photon emission computerized tomography imaging of amphetamine-induced dopamine release in drug-free schizophrenic subjects. Proc. Natl. Acad. Sci. USA, 93, 9235±40.
Logan, J., Fowler, J. S., Volkow, N. D. et al. (1990). Graphical analysis of reversible radioligand binding from time-activity measurements applied to [N-11C-methyl]-(2)-cocaine PET studies in human subjects. J. Cereb. Blood Flow. Metab., 10, 740±7.
Logan, J., Dewey, S. L., Wolf, A. P. et al. (1991). EVects of endogenous dopamine on measures of [18F]-methylspiroperidol binding in the basal ganglia: comparison of simulations and experimental results from PET studies in baboons. Synapse, 9, 195±207.
Logan, J., Fowler, J. S., Volkow, N. D. et al. (1994). EVects of blood
Xow in [11C]-raclopride binding in the brain: model simulations and kinetic analysis of PET data. J. Cereb. Blood Flow. Metab., 14, 995±1010.
Logan, J.,Fowler, J. S., Volkow, N. D., Wang, G. J., Ding, Y. S. and AlexoV, D. L. (1996). Distribution volume ratios without blood sampling from graphical analysis of PET data. J. Cereb. Blood Flow. Metab., 16, 834±40.
McDonald, W. M., Hussain, M., Doraiswamy, P. M., Figel, G., Boyko, O. and Krishnan, K. R. R. (1991). A magnetic resonance image study of age-related changes in human putamen nuclei.
Neuroreport, 2, 41±4.
Mintun, M. A., Raichle, M. E., Kilbourn, M. R., Wooten, G. F. and Welch, M. J. (1984). A quantitative model for the in vivo assessment of drug binding sites with positron emission tomography.
Ann. Neurol., 15, 217±27.
Morris, E. D., Fisher, R. E., Alpert, N. M., Rauch, S. L. and Fischman, A. J. (1995). In vivo imaging of neuromodulation using positron emission tomography: optimal ligand characteristics and task length for detection of activation. Hum. Brain Map., 3, 35±55.
Morris, E. D., Babich, J. W., Alpert, N. M. et al. (1996a). QuantiWcation of dopamine transporter density in monkeys by dynamic PET imaging of multiple injections of 11C-CFT. Synapse,
24, 262±72.
Morris, E. D., Alpert, N. M. and Fischman, A. J. (1996b). Comparison of two compartmental models for describing receptor ligand kinetics and receptor availability in multiple injection PET studies. J. Cereb. Blood Flow. Metab., 16, 841±53.
Morris, E. D., Chefer, S. I., Lane, M. A. et al. (1999). Decline of D2 receptor binding with age, in rhesus monkeys: importance of correction for simultaneous decline in striatal size. J. Cereb. Blood Flow. Metab., 19, 218±29.
Muller-Gartner, H. W., Links, J. M., Prince, J. L. et al. (1992). Measurement of radiotracer concentration in brain gray matter using positron emission tomography: MRI-based correction for partial volume eVects. J. Cereb. Blood Flow. Metab., 12, 571±83.
Muzic, R. F. Jr, Chen, C. H. and Nelson, A. D. (1998). Method to account for scatter, spillover and partial volume eVects in region of interest analysis in PET. IEEE Trans. Med. Imaging, 17, 202±13.
Rinne, J. O., Hietala, J. Ruotsalainen, U. et al. (1993). Decrease in human striatal dopamine D2 receptor density with age: a PET study with [11C]raclopride. J. Cereb. Blood Flow Metab., 13, 310±14.
Robbins, T. W. and Everitt, B. J. (1996). Neurobehavioural mechanisms of reward and motivation. Curr. Opin. Neurobiol. 6, 228±36.
Rousset, O. G., MaY., Marenco, M.,Wong, D. F. and Evans, A. C. (1996). In vivo correction method for partial volume eVects in positron emission tomography. Accuracy and precision. In QuantiWcation of Brain Function using PET ed. R. Myers,V. Cunningham, D. Bailey, T. Jones, pp. 158±165. San Diego, CA: Academic Press.