

Книги по МРТ КТ на английском языке / Functional Neuroimaging in Child Psychiatry Ernst 1 ed 2000
.pdfFig. 13.1. Research has shown that certain brain structures are involved in the neurobiology of obsessive-compulsive disorder. (Created by Frank P. MacMaster.)
Fig. 13.2. Structures such as the thalamus, cingulate, amygdala, hippocampus and the orbital frontal cortex (OFC) are activated in the emotion fear. (Created by Frank P. MacMaster.)

Fig. 13.6. Positron emission tomography with a-[11C]-methyl-l-tryptophan showing serotonin synthesis levels in the ventral±striatal brain areas of a developmentally normal control, a patient with obsessive-compulsive disorder (OCD), and a patient before and after drug treatment with paroxetine. Higher serotonin synthesis levels correspond to the areas highlighted in yellow, while low serotonin synthesis levels correspond to areas in blue. (Created by the laboratory of Dr David Rosenberg.)
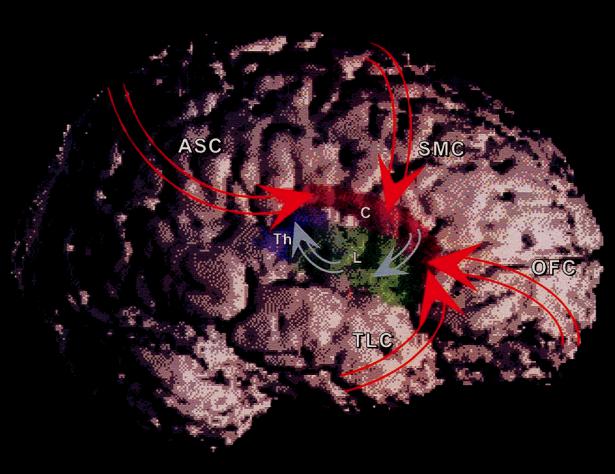
Fig. 14.1. Cortico±striato±thalamo±cortical (CSTC) circuits. White, cerebral cortex; red, caudate nucleus (labeled ªCº); green, lenticular nucleus (labeled ªLº); purple, thalamus (labeled ªThº); ASC, association cortex; SMC, sensorimotor cortex; OFC, orbitofrontal cortex; TLC, temporolimbic cortex. See Fig. 14.3a for a more detailed schematic drawing of connectivity in CSTC circuits. Here excitatory cortico±striatal projections are represented with red arrows. Projections from OFC and TLC are primarily to ventral striatum, whereas those from SMC and ASC are primarily to dorsal striatum (Leckman et al., 1997). Inhibitory striato±pallidal and pallido±thalamic projections are represented with blue arrows. Excitatory thalamo±cortical projections are not shown.
(a)
(b)
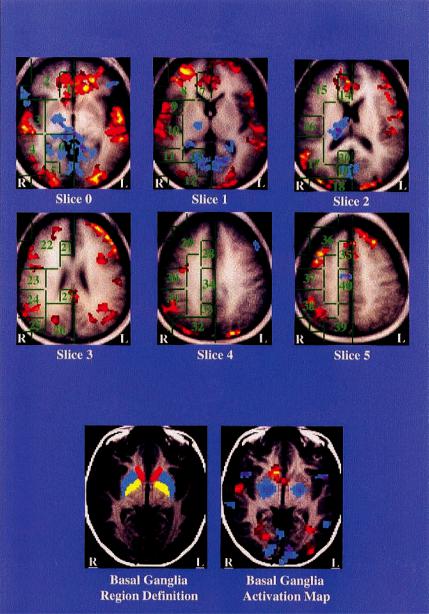
Fig. 14.3. Tic suppression. (a) Group-averaged activations in Talairach space: red indicating increased activity during tic suppression and blue decreased activity. Intersubject averaging is an imperfect visual representation of regional signiWcance testing because of the variability between subjects in the location of anatomic regions such as the basal ganglia, and variability in the spatial location of activation within subcortical and stereotactically deWned cortical regions. This is especially evident in the left basal ganglia, where the group-average map fails to indicate activation (Peterson et al., 1998). The Talairach stereotactic deWnitions of cortical regions of interest are shown in green outline. Anterior cingulate: 1, 7, 14, 21, 28, 35; posterior cingulate: 20, 27, 34, 40; frontal cortex: 2, 8, 15, 22, 29, 36; superior temporal gyrus; 3, 10, 17; middle temporal gyrus: 4, 11, 25; precentral gyrus: 9; sensorimotor cortex: 16, 23, 30, 37; inferior parietal cortex: 24, 31, 38; occipital cortex: 5, 12, 18, 26, 32; hippocampus/parahippocampus: 6; cuneus: 13, 19; and precuneus: 33, 39. (b) Basal ganglia deWnition and activation in a single subject. Region deWnitions are shown for the inferior-most slice, where basal ganglia activation was seen. In the basal ganglia deWnitions on the left, yellow indicates putamen, blue indicates globus pallidus, and red indicates caudate. In the activation map on the right, decreased activity of the putamen and globus pallidus is seen bilaterally (blue); activity during tic suppression in the caudate nucleus is increased on the right (red).

(a) |
(b) |
(c )
Fig. 16.1. Basal ganglia loops. (a) General representation of the motor cortico±striatal loop encompassing the putamen and the prefrontal caudate loop (background slice) in relation to the subthalamic nucleus and substantia nigra (foreground slice). (b) Cortical projections to rostral frontal section of the basal ganglia (dashed line style corresponds to loops in (c). (c) The Wve major cortico±striatal loops: the motor circuit serving sensorimotor area (SMA) integration; the oculomotor composed of the frontal eye Welds (FEF) projecting to the head and body of the caudate in the attentional control of eye movements; the prefrontal cognitive/association pathway composed of the dorsolateral prefrontal cortex (DLPFC), dorsolateral (dl) head of the caudate; the orbitofrontal pathway composed of the lateral orbitofrontal cortex (LOFC), which projects to the ventromedial (vm) head of the caudate; and the ventral striatal pathway composed of the anterior cingulate (not shown), medial orbitofrontal (MOF) cortex and ventromedial caudate and nucleus accumbens. GP/SNR, global pallidus/substantia nigra pars reticulata, PFC, prefrontal cortex. (Based on Fig. 3 in Alexander et al., 1986.)
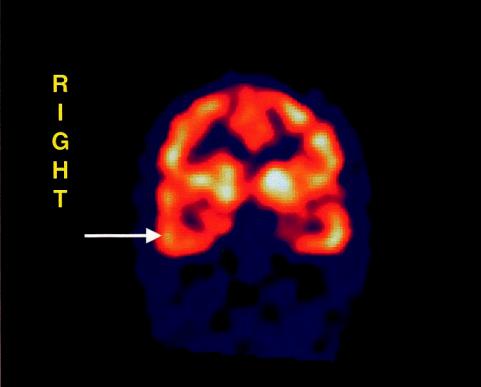
Fig. 17.1. SPECT image: coronal section of the brain showing unilateral temporal lobe hypoperfusion in
patient with early-onset anorexia nervosa.
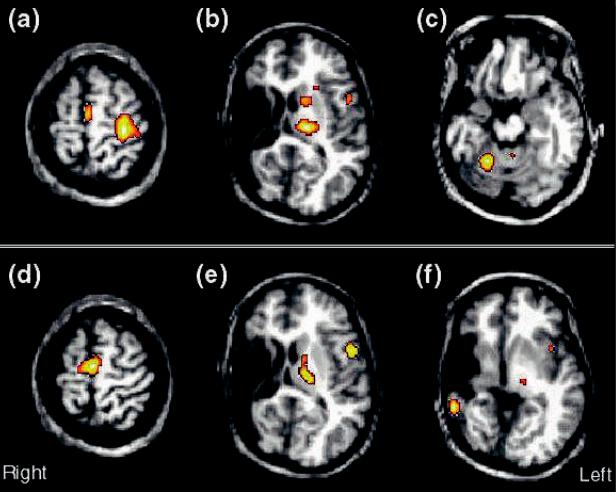
Fig. 20.2. Regional cerebral blood Xow (rCBF) increases . 20% (p , 0.001; uncorrected) for unilateral Wnger movement in a 20-year-old patient with history of intrauterine or perinatal middle cerebral artery infarction in the right hemisphere (from Müller et al., 1998e). The activations from the H215O PET subtraction images are superimposed onto the patient's structural MRI. (a±c) A normal pattern of activations for Wnger movement of the unaVected right hand is seen in primary motor cortex and the supplementary motor area (a), as well as in the thalamus, basal ganglia, and premotor cortex of the left hemisphere (b), and in the right anterior cerebellum (c). (d±f) Activations for movement of the hemiparetic left hand. Activations in the supplementary motor area (d) are enhanced and are more bilateral compared with movement of the unaVected hand, but there is no activation in primary motor cortex. (e) Atypical activations are also seen in the hemisphere ipsilateral to the side of movement in premotor cortex and in the thalamus. (f) An unexpected activation is found in residual temporal cortex of the lesioned hemisphere. The activations for movement of the hemiparetic hand suggest that multiple regions are involved in reorganization, with the exception of the primary motor cortex.

Part 1
Techniques of functional neuroimaging
Since the mid-1980s, there has been a rapid technological development in functional neuroimaging methods that have enabled the study of the human brain in vivo. Positron emission tomography (PET), single photon emission computed tomography (SPECT), functional magnetic resonance imaging (fMRI), magnetic resonance spectroscopy (MRS), and magnetoencephalography (MEG) now offer a diverse array of methods for studying metabolic and neurochemical brain development, as well as the neural systems subserving cognitive and emotional processes.
To provide a foundation for understanding these methods, particularly as applied to the study of brain development and deviance, Part 1 delineates the basic principles, advantages, and disadvantages of these modalities. Herscovitch and Ernst discuss the nuclear medicine techniques of PET and SPECT (Chapter 1) and Morris and colleagues discuss PET methods used to map receptors (Chapter 2). Eden and ZeViro then describe the recent emergence of fMRI as a technique that can be used with neurophysiologic and neurocognitive probes to deWne neural circuits and determine their integrity in childhood disorders (Chapter 3). Yurgelun-Todd and Renshaw in Chapter 4 discuss advances in MRS for the study of brain chemistry and the evolution of this technique into a brain mapping technique. Finally, in Chapter 5, Rojas and colleagues describe MEG, a technique with superior temporal resolution that directly measures neuronal electrical activity.
This diversity of functional imaging methods provides the means for mapping a variety of important brain maturational processes. These methods diVer in the nature of the recorded signal (radioactive counts, electromagnetic energy), the physiologic variables (e.g., cerebral blood Xow, glucose metabolism, receptor density, neurochemical concentration), the temporal and spatial resolution, the health risks, and the availability and cost. The neuroscientist can theoretically choose a best method or combination of methods to address scientiWc questions relating to normal and aberrant brain development. Furthermore, the integration of these techniques (multimodal imaging) will doubtlessly increase over time, oVering a more comprehensive knowledge base from which to study, diagnose, and treat psychiatric disorders.

1
Functional brain imaging with PET and SPECT
Peter Herscovitch and Monique Ernst
Introduction
Functional brain imaging refers to the use of techniques to obtain images of the brain that are related to its physiology or biochemistry, rather than its structural anatomy. Two nuclear medicine-based approaches to functional brain imaging can be used to study the pediatric population, positron emission tomography (PET) and single-photon emission computed tomography (SPECT). Both will be reviewed in this chapter.
PET is a nuclear medicine technique for performing physiologic measurements in vivo. The PET scanner provides tomographic images of the distribution of positronemitting radiopharmaceuticals in the body. From these images, measurements such as regional cerebral blood Xow (rCBF) and glucose metabolism can be obtained. PET has been widely used as a research tool to study normal brain function and the pathophysiology of neurologic and psychiatric disease in adults (Grafton and Mazziotta, 1992; Volkow and Fowler, 1992). Its role in the management of patients with brain disorders is at an earlier stage (Powers et al., 1991) and its use in children has been limited. Conceptually, PET consists of three components: (i) tracer compounds labeled with radioactive atoms that emit positrons; (ii) scanners that provide tomographic images of the concentration of positron-emitting radioactivity in the body; and (iii) mathematical models that describe the in vivo behavior of radiotracers and allow the physiologic process under study to be quantiWed from the images. The Wrst tomographs for quantitative PET imaging were developed in the mid-1970s (Ter-Pogossian, 1992). Subsequently, instrument design has become more sophisticated, with improved spatial resolution and sensitivity. Radiotracer techniques have been developed to study regional CBF and blood volume; glucose, oxygen, and protein metabolism; blood±brain barrier permeability; numerous neuroreceptor±neurotransmitter
systems; tissue pH; and the concentration of radiolabeled drugs in brain.
SPECT is another nuclear medicine technique that provides tomographic images of radioactivity (George et al., 1991; Wyper, 1993; Green, 1996). SPECT is simpler than PET because it uses radiopharmaceuticals labeled with conventional radionuclides such as technetium-99m (99mTc); however, it still has the same three components: radiotracers, scanners, and mathematical models. Its quantitative accuracy is less than that of PET and the range of radiopharmaceuticals for studying the brain is relatively limited; it has primarily been used to map cerebral perfusion. Improvements in instrumentation and radiopharmaceuticals are being actively pursued, especially in the development of radiotracers labeled with iodine-123 (123I) to image neuroreceptors (Holman and Devous, 1992; Juni, 1994), and there is a strong interest in clinical SPECT brain studies.
This chapter will provide an overview of PET instrumentation, radiotracers, and mathematical modeling, emphasizing methods to measure cerebral hemodynamics and metabolism, and the most common applications. In addition, SPECT instrumentation and radiopharmaceuticals are described. The analysis and interpretation of functional brain images and special considerations for the pediatric age group are discussed. Methods for studying neurotransmitter systems are treated elsewhere in this volume (Chapter 2). An abbreviated lexicon of various terms used in nuclear medicine is provided in the glossary (p. 408).
Positron emission tomography
Imaging
PET provides tomographic images of the distribution of positron-emitting radioactivity using rings of radiation
3